EUR/USD:
Across the board the US dollar lost ground against the majority of its trading peers on Thursday, thus providing support to the euro (the euro holds the most weight versus the dollar index, constituting about 58% of the weighting).
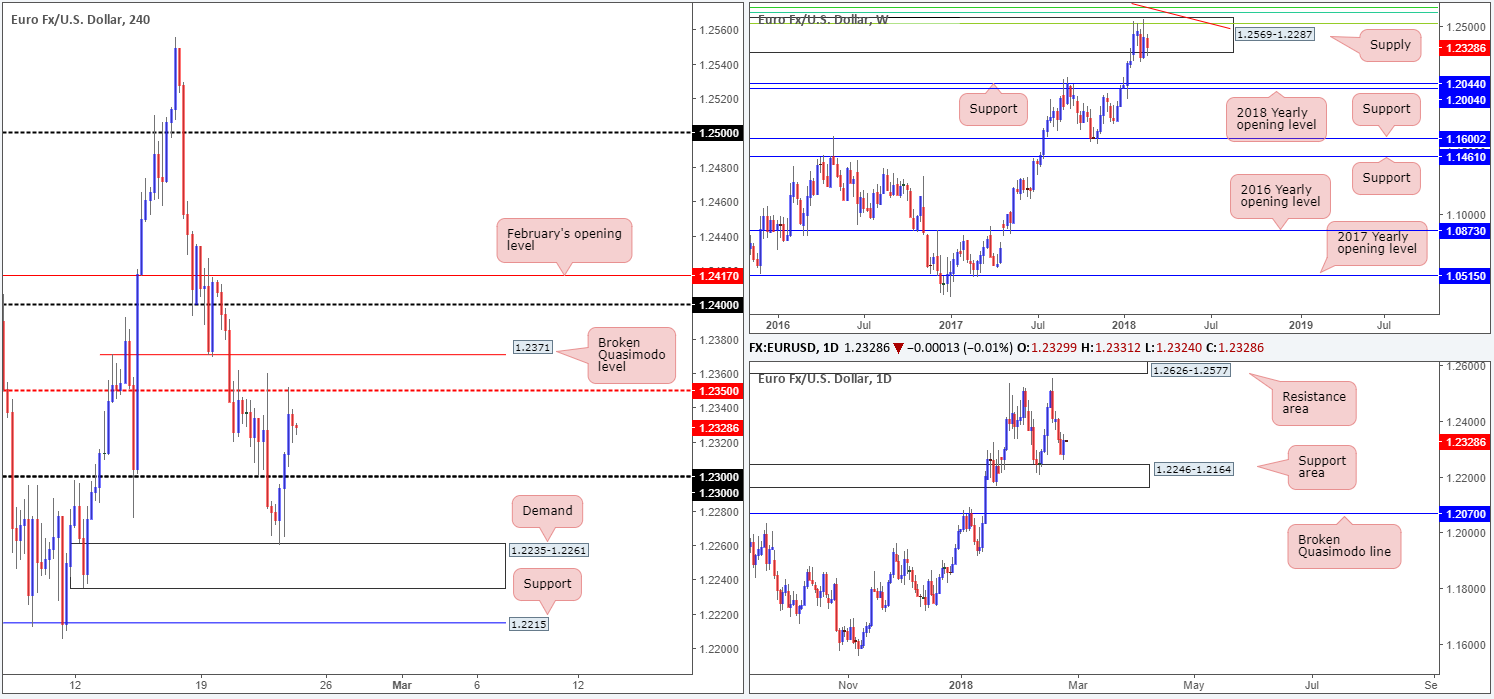
H4 price found active bids around the top edge of a H4 demand base coming in at 1.2235-1.2261, which happens to be positioned on top of a daily support area at 1.2246-1.2164. Following a H4 bullish engulfing candle, the pair went on to conquer the 1.23 handle, and retest the underside of the H4 mid-level resistance band at 1.2350. Should this number suffer a break, the next port of call is seen directly above in the form of a H4 broken Quasimodo line at 1.2371.
This latest move is the first show of bullish intent we’ve seen this week. However, considering that technically we are trading from a major weekly supply at 1.2569-1.2287, there’s a possibility that the sellers may still be looking to take this market lower in the coming weeks.
Potential trading zones:
This is quite a tricky market to trade at the moment, especially for those looking for medium to long-term positions.
On the one hand we have potential sellers from the noted weekly supply, but on the other hand there’s active buying being seen from a H4 demand that’s bolstered by a daily support area. Therefore, irrespective of the direction one selects here, you’ll have to entertain going up against some form of higher-timeframe structure!
Intraday, however, we do like the H4 broken Quasimodo line mentioned above at 1.2371, since it is positioned above the mid-level psychological point 1.2350. Above 1.2350 there are likely stop-loss orders. Once these orders are filled they become buys, and this liquidity can be used to sell into from 1.2371. The first take-profit target from this angle would be set at 1.23, then followed by the top edge of the noted daily support area at 1.2246 (seen planted within the aforesaid H4 demand).
Data points to consider: EUR final CPI y/y at 10am; FOMC members Dudley, Mester and Williams speaking at 3.15pm, 6.30pm and 8.40pm GMT, respectively.
Areas worthy of attention:
Supports: 1.2235-1.2261; 1.23 handle; 1.2246-1.2164.
Resistances: 1.2350; 1.2371; 1.2569-1.2287.
GBP/USD:
In a similar fashion to the EUR/USD, the British pound is seen trading higher this morning. UK growth data q/q was largely ignored as the main focus seemed to be on the declining dollar.
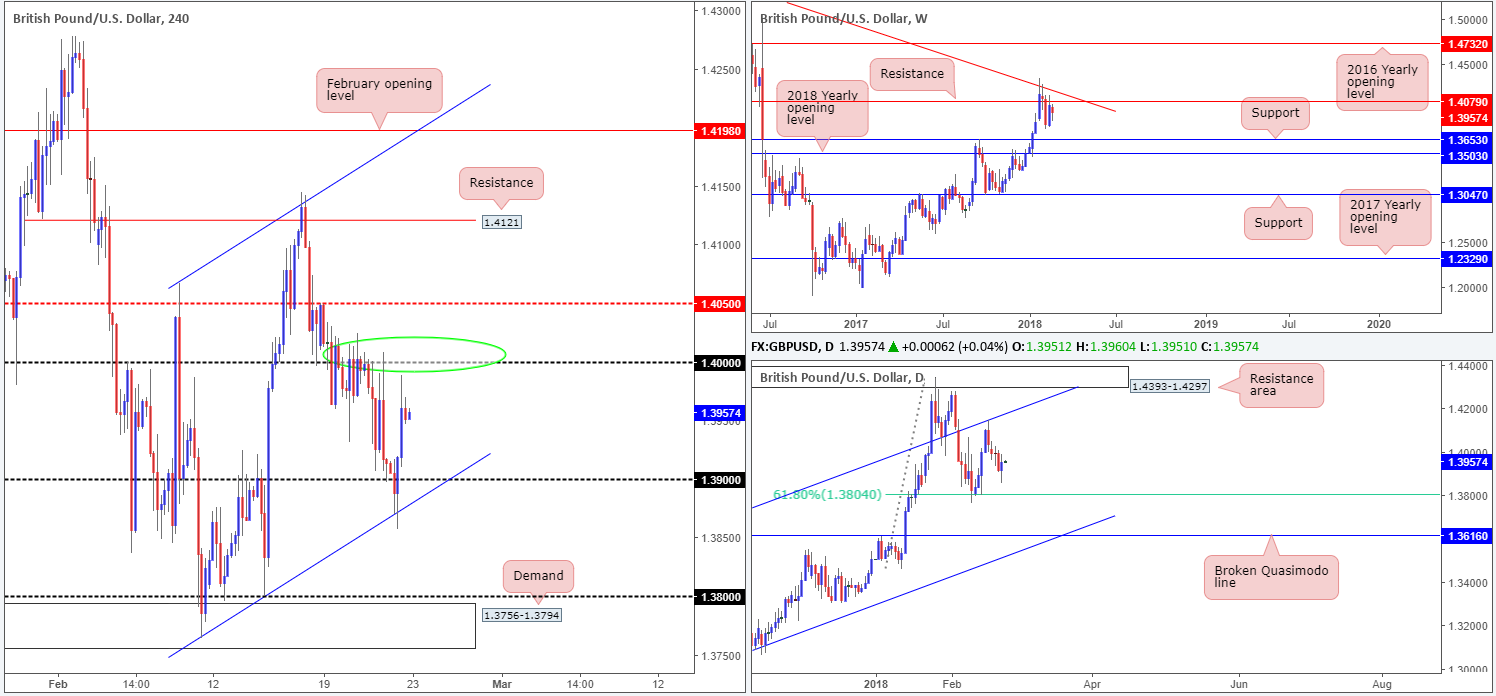
From a technical standpoint, we can see that H4 price whipsawed through the 1.39 handle – shook hands with a H4 channel support etched from the low 1.3764 – and drove back up to just ahead of the large psychological level 1.40 which has proven to be a key resistance this week.
Over on the weekly timeframe, the pair is seen loitering beneath a weekly resistance plotted at 1.4079, which, as you can see, is closely situated nearby a weekly trendline resistance carved from the high 1.5930. Daily movement, on the other hand, is currently trading mid-range between a 61.8% daily Fib support at 1.3804 and a daily channel resistance taken from the high 1.2903.
Potential trading zones:
Although the 1.40 handle looks appealing given how it has held firm this week, we’re a little wary here since it is not positioned nearby any form of higher-timeframe resistance. Essentially, there’s very little stopping weekly/daily players dragging the unit beyond 1.40, thus making it a risky trade zone, in our humble opinion.
Data points to consider: MPC Ramsden speaks at 12pm; FOMC members Dudley, Mester and Williams speaking at 3.15pm, 6.30pm and 8.40pm GMT, respectively.
Areas worthy of attention:
Supports: 1.39 handle; 1.3804.
Resistances: 1.4079; 1.40 handle.
AUD/USD:
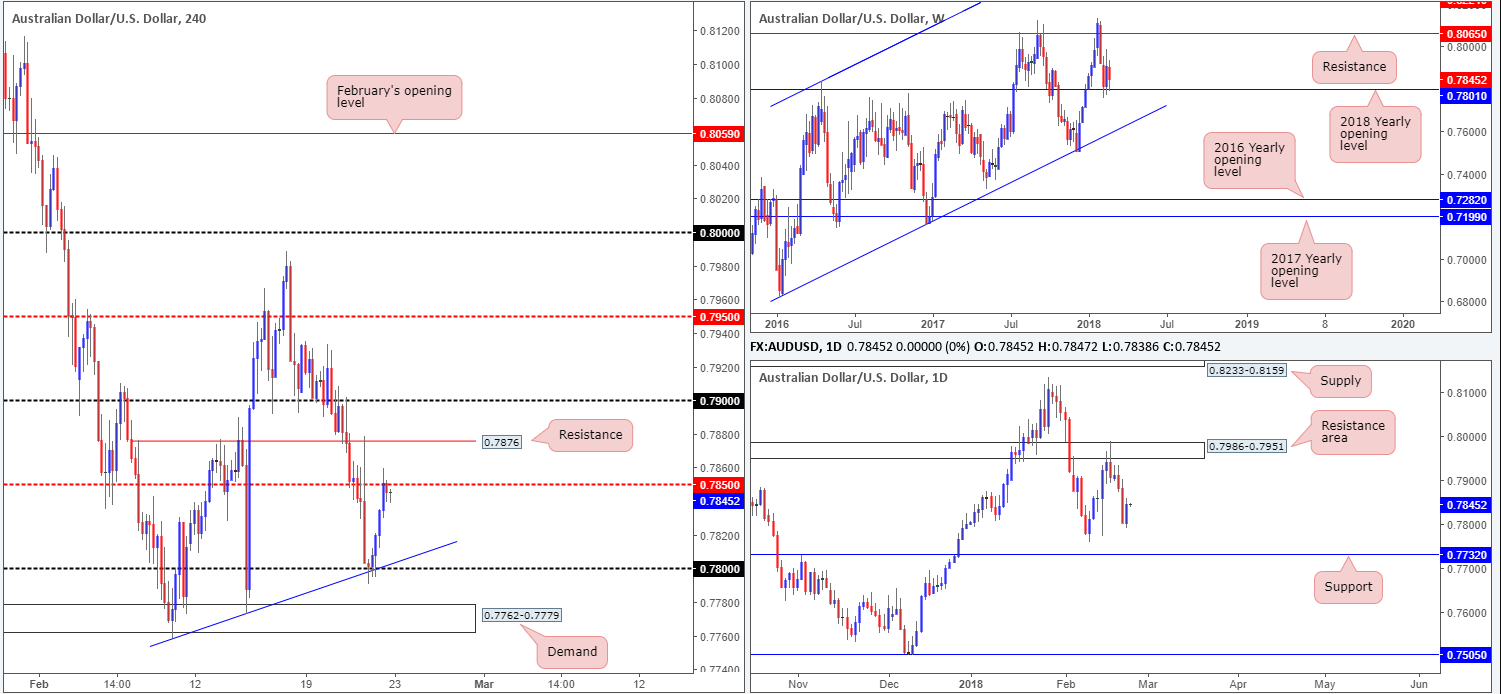
During the course of yesterday’s sessions, the commodity currency printed a healthy recovery from a converging 0.78 handle and H4 trendline support taken from the low 0.7758. In the shape of a series of near-full-bodied H4 bull candles, the pair ended the day crossing swords with a H4 mid-level resistance plotted at 0.7850 (this was a noted move to watch for – well done to any of our readers who managed to jump aboard here). Beyond this line, the H4 resistance at 0.7876 and the 0.79 handle is eyed.
Longer term, however, recent movement has brought the Aussie dollar back down to the 2018 yearly opening level written at 0.7801 on the weekly timeframe – an area which offered support the week prior. A closer look at the action on the daily timeframe shows that despite yesterday’s advance, we do not really see much propping the market up on this scale. The next downside target does not come into view until we reach the daily support level drawn from 0.7732.
Potential trading zones:
Selling 0.7850, in our book, lacks substance. Not only does it have limited confluence on the H4 timeframe, one also has to take into account that there’s absolutely no higher-timeframe structure present. A short from the nearby H4 resistance at 0.7876 also faces the same pressure!
As such, remaining on the sidelines until more conducive price action presents itself may be a path to consider.
Data points to consider: FOMC members Dudley, Mester and Williams speaking at 3.15pm, 6.30pm and 8.40pm GMT, respectively.
Areas worthy of attention:
Supports: 0.78 handle; H4 trendline support; 0.7801; 0.7732.
Resistances: 0.7850; 0.7876; 0.79 handle.
USD/JPY:
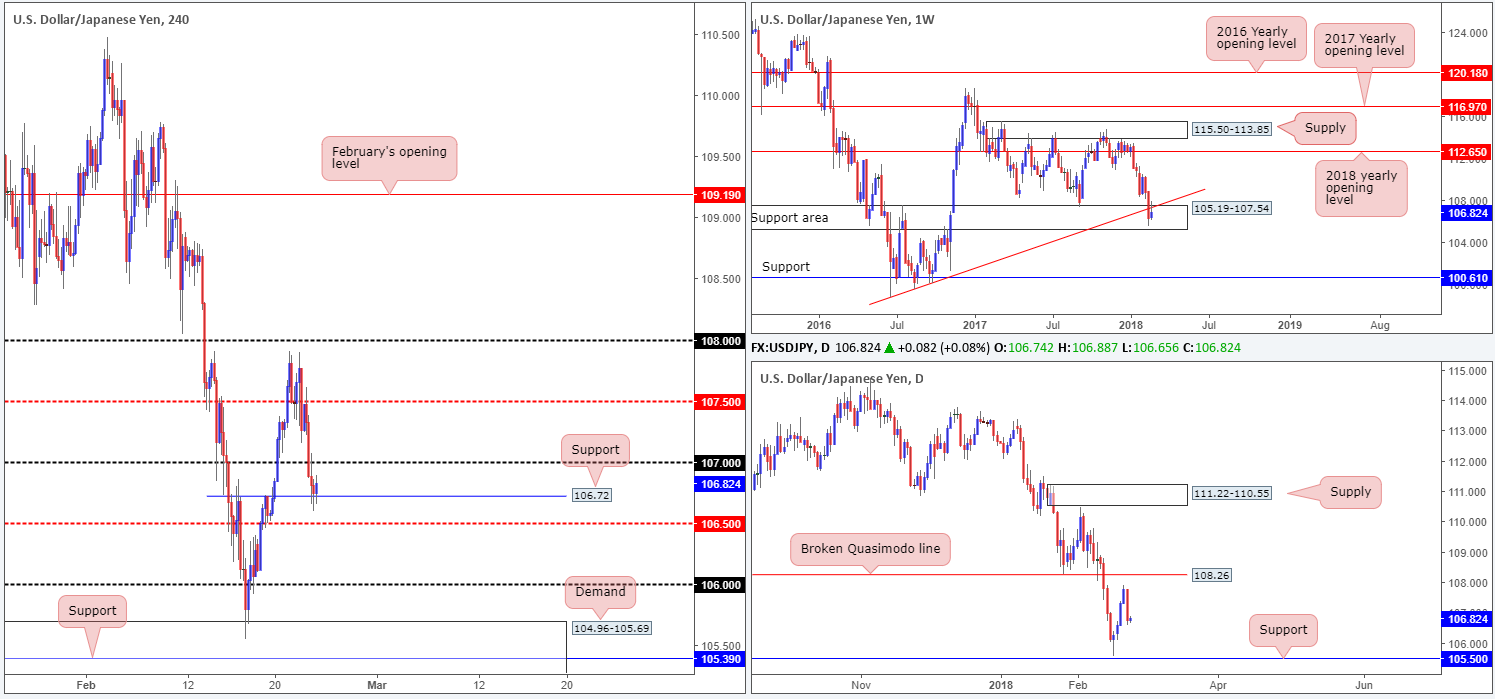
The USD/JPY, as you can see, retraced amid Thursday’s segment, breaking a four-day bullish phase and chalking up a near-full-bodied daily bearish candle.
Sliding US Treasury bond yields helped keep a lid on the recent dollar recovery, and therefore exacerbated yesterday’s decline. H4 price retested the underside of the mid-level point 107.50 and quickly smashed through the 107 handle to challenge H4 support noted at 106.72, which appears to be holding form, as we write.
Daily price turned just ahead of a broken Quasimodo line at 108.26, and has the support level printed at 105.50 to target. Weekly flow, although price remains within the walls of a weekly support area at 105.19-107.54, is showing signs of weakness from the weekly trendline support-turned resistance extended from the low 98.78.
Potential trading zones:
In a nutshell, this is what we have so far:
- Weekly price undecided.
- Daily price could potentially test either the daily broken Quasimodo line at 108.26 or the daily support at 105.50. Both carry equal weight, in our opinion.
- Upside is limited by the 107 handle on the H4 timeframe. Beneath the current H4 support, downside is also restricted by the nearby 106.50 boundary.
Given the current technicals, the team believes this market is best left on the back burner for the time being.
Data points to consider: FOMC members Dudley, Mester and Williams speaking at 3.15pm, 6.30pm and 8.40pm GMT, respectively.
Areas worthy of attention:
Supports: 106.50; 106.72; 105.50; 105.19-107.54.
Resistances: 108.26; 107 handle; weekly trendline resistance.
USD/CAD:
The USD/CAD experienced a choppy session on Thursday, ranging a little over 80 pips. Despite this, the pair ended the session making little headway, closing just above the 1.23 handle, which is seen holding form as support, at the time of writing.
As highlighted in Thursday’s morning report, weekly price is currently reflecting a strong bullish stance above the 2018 yearly opening level at 1.2579 and shows room to rally as far north as the weekly resistance at 1.2917. By the same token, daily movement also recently crossed above daily resistance at 1.2666 (now acting support) and shows room to advance up to a daily supply area at 1.2943-1.2885 (encases the noted weekly resistance level).
Potential trading zones:
With the bigger picture suggesting further upside, an intraday long from the 1.27 handle could be an option this morning. Should one manage to pin down a position from this angle, be prepared for possible selling pressure to enter the fray from 1.2750/1.2772 (H4 mid-level resistance/H4 Quasimodo resistance).
Data points to consider: FOMC members Dudley, Mester and Williams speaking at 3.15pm, 6.30pm and 8.40pm, respectively; Canadian inflation data at 1.30pm GMT.
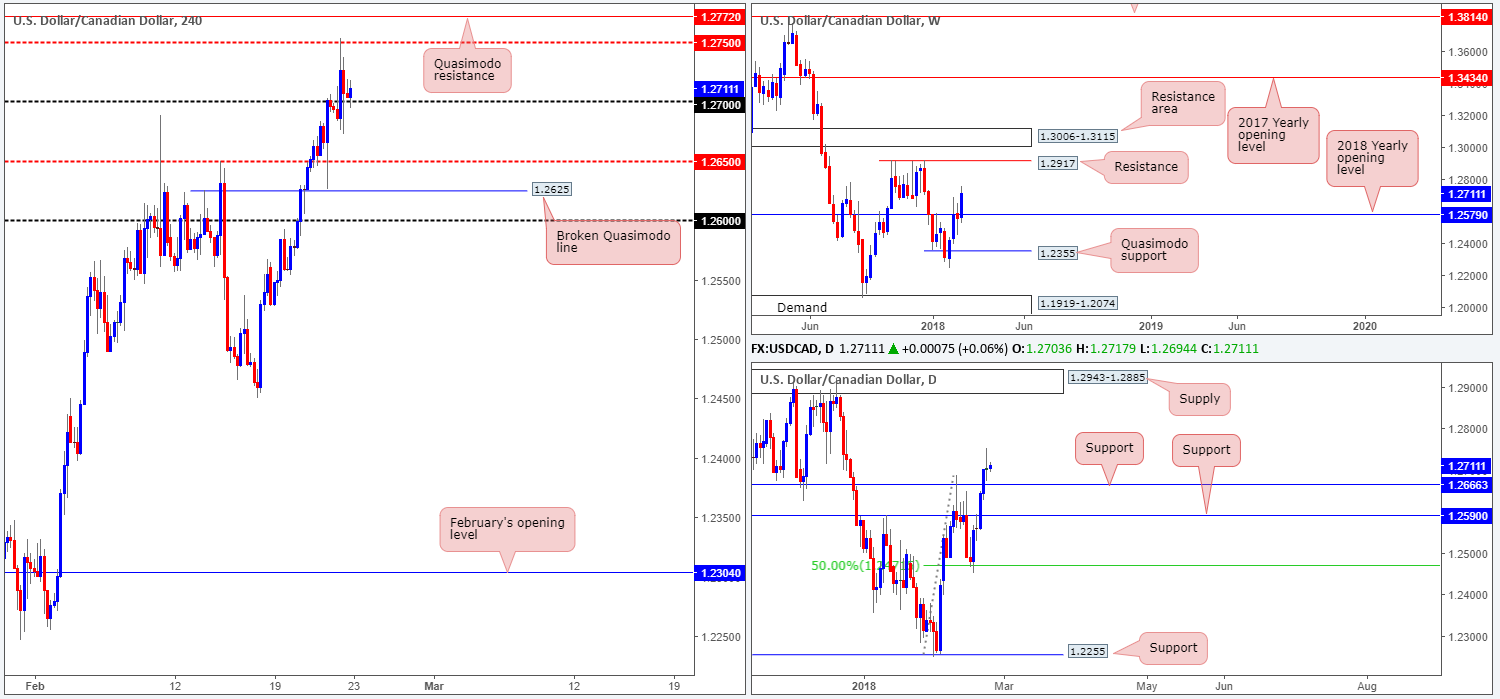
Areas worthy of attention:
Supports: 1.27 handle; 1.2666; 1.2579.
Resistances: 1.2750; 1.2772; 1.2917; 1.2943-1.2885.
USD/CHF:
On the back of a broad-based dollar decline, the USD/CHF market suffered as we transitioned into the London session on Thursday. Following a brief spell above the 0.94 handle the H4 candles descended lower, taking out H4 support at 0.9360 (now acting resistance) and concluding the day bottoming around the 0.9327ish neighborhood. Given the clear-cut daily bearish engulfing candle printed yesterday, it is likely that we’ll visit February’s opening line at 0.9313 sometime today, and quite possibly the 0.93 handle.
Meanwhile, higher-timeframe structure shows that weekly price remains trading between a major weekly resistance area coming in at 0.9443-0.9515 (this is also emphasized on the daily chart in the form of a daily resistance level plotted at 0.9444) and a weekly support band drawn in at 0.9163.
Potential trading zones:
With there not being much higher-timeframe structure in the frame at this time, our attention is drawn to possible intraday movement on the H4 timeframe.
Quite frankly, the only area that really stands out as a possibility this morning is seen between the 0.93 handle and Feb’s opening band (also contains a 50.0% support value at 0.9299 – green zone). To trade this area, we would recommend waiting for H4 price to show buyer intent before pressing the buy button, since psychological numbers are prone to fakeouts. A full or near-full-bodied H4 bull candle would, in our opinion, be enough to long this market, targeting H4 resistance at 0.9360.
Data points to consider: FOMC members Dudley, Mester and Williams speaking at 3.15pm, 6.30pm and 8.40pm GMT, respectively.
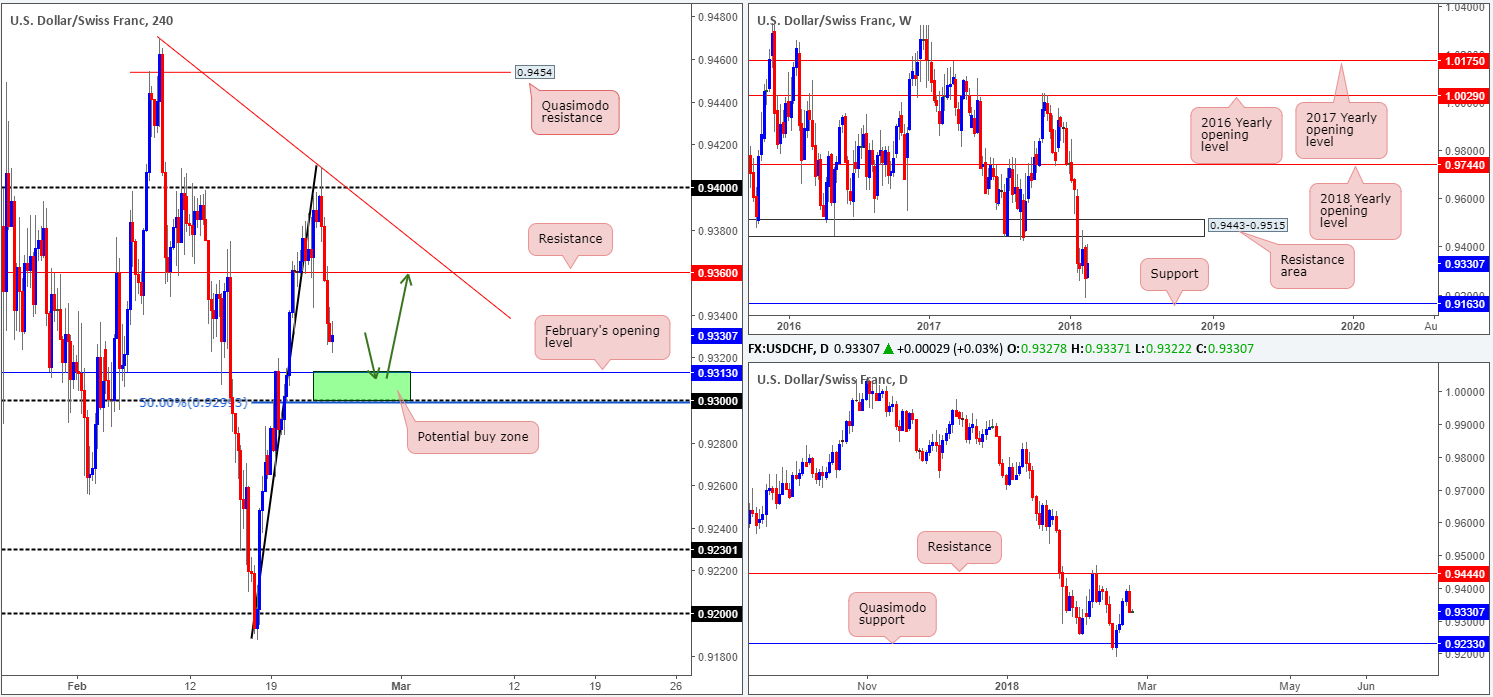
Areas worthy of attention:
Supports: 0.93/0.9313; 0.9163; 0.9233.
Resistances: 0.9360; 0.9444; 0.9443-0.9515.
DOW 30:
As can be seen from the charts this morning, US equities remain capped beneath a H4 resistance area at 25256-25394, which happens to house a 61.8% Fib resistance band at 25381 and is encased within a daily resistance area at 25256-25404. As far as we can see, traders remain fearful that inflation and rising interest rates will result in higher borrowing costs, thus offsetting the benefits of lower taxes.
Looking over to the weekly candles, we can see that price is beginning to show signs of bullish intent from the 2018 yearly opening level positioned at 24809. Continued bidding from this angle could lead to a move eventually being seen up to the weekly supply zone coming in at 26616-25974. A break below this line, nevertheless, will likely place the daily channel support extended from the low 17883 in the spotlight (next downside target on the daily scale).
Potential trading zones:
Despite the 2018 yearly opening level being in motion, we would be hesitant buyers in this market! Entering long when both H4 and daily action show limited upside potential is not something our team would label a high-probability setup! Unfortunately, the same goes for selling. Shorting into a weekly support band, although it has yet to prove its worth, is just not our cup of tea!
Data points to consider: FOMC members Dudley, Mester and Williams speaking at 3.15pm, 6.30pm and 8.40pm GMT, respectively.
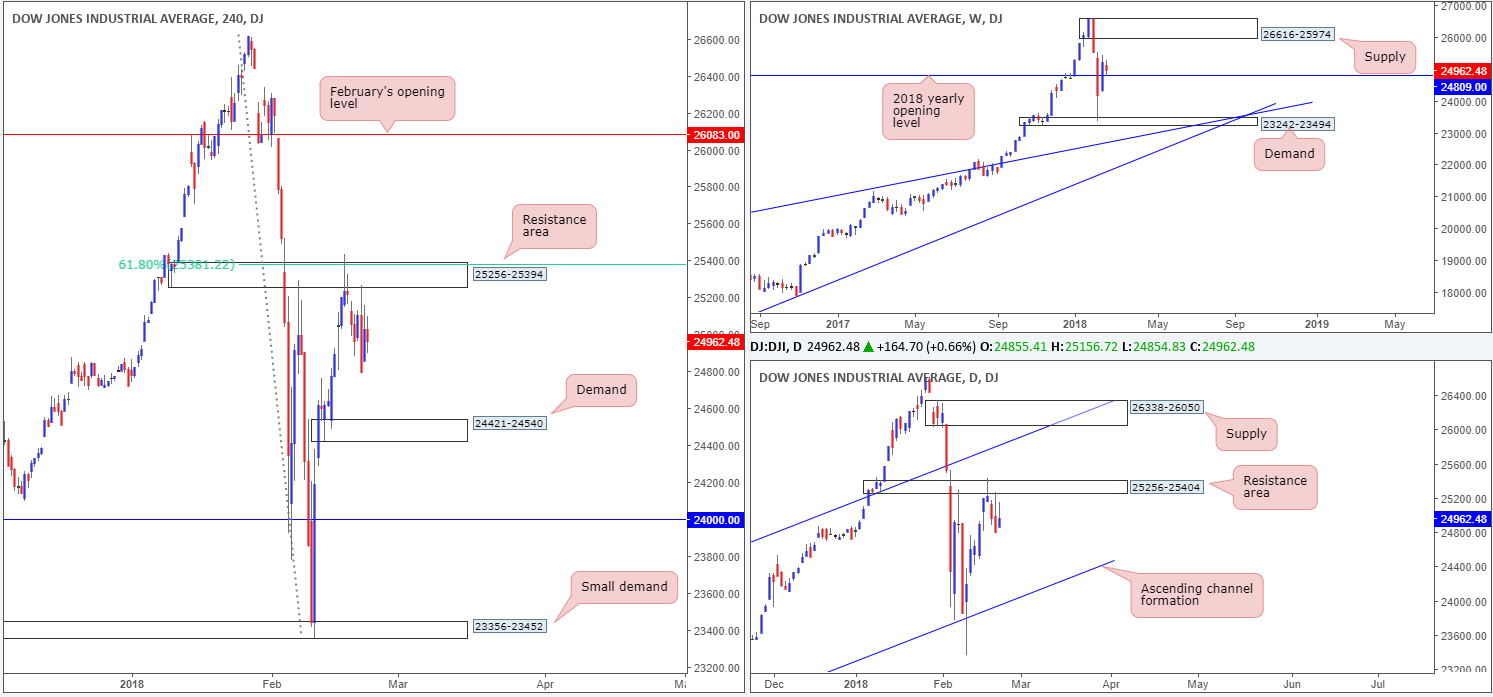
Areas worthy of attention:
Supports: 24421-24540; 23242-23494; 24809.
Resistances: 25256-25394; 25381; 26616-25974; 25256-25404.
GOLD:
As the US dollar took a dip on Thursday, it was of little surprise to see the gold market advance. In spite of this, though, H4 price is showing signs of bearish intent around a resistance level drawn from 1330.1, as we write. Assuming that this line holds ground, we do not see a whole lot stopping the H4 candles from driving as far south as the daily support level coming in at 1308.4. The green arrows marked on the H4 chart resemble consumption tails. Our rationale behind this is simply that unfilled buy orders were triggered prior to price lifting higher; therefore when price returns to this location, downside should theoretically be reasonably free. In addition to the above, 1330.1 is attractive since weekly price also shows room to drive as low as the 2018 yearly opening level at 1302.5, which converges with a weekly channel support extended from the low 1122.8.
The other key thing to note here is that although H4 action shows free downside to the noted daily support, daily movement also has a 38.2% daily Fib support painted at 1316.9 (along with the daily support, forms a blue support zone), so one should expect some buying pressure to be seen around this point.
Potential trading zones:
Should the H4 candles hold firm at current price in the shape of a full or near-full-bodied bearish formation, then a sell from here could be something to consider. As for take-profit targets, the first port of call, in our view, would be the blue daily support area.
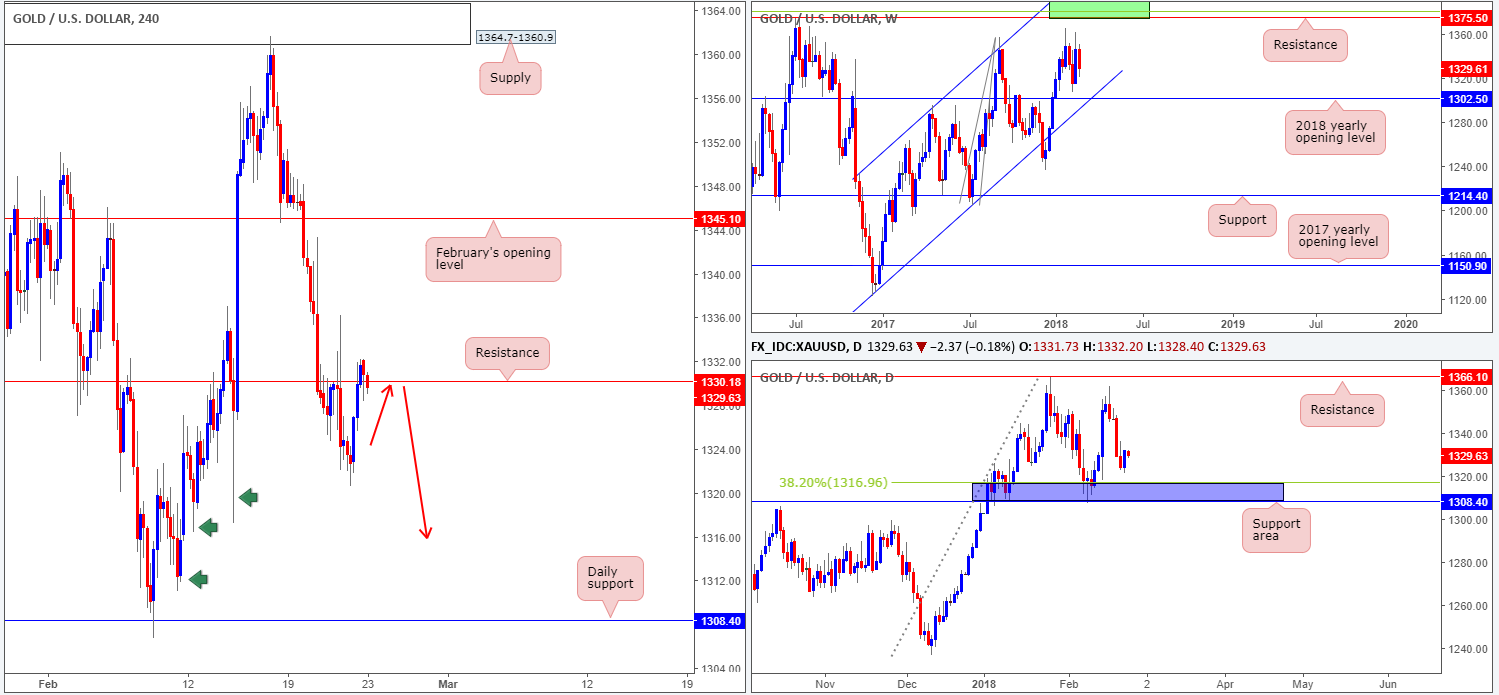
Areas worthy of attention:
Supports: 1308.4/1316.9.
Resistances: 1330.1.
This site has been designed for informational and educational purposes only and does not constitute an offer to sell nor a solicitation of an offer to buy any products which may be referenced upon the site. The services and information provided through this site are for personal, non-commercial, educational use and display. IC Markets does not provide personal trading advice through this site and does not represent that the products or services discussed are suitable for any trader. Traders are advised not to rely on any information contained in the site in the process of making a fully informed decision.
This site may include market analysis. All ideas, opinions, and/or forecasts, expressed or implied herein, information, charts or examples contained in the lessons, are for informational and educational purposes only and should not be construed as a recommendation to invest, trade, and/or speculate in the markets. Any trades, and/or speculations made in light of the ideas, opinions, and/or forecasts, expressed or implied herein, are committed at your own risk, financial or otherwise.
The use of the site is agreement that the site is for informational and educational purposes only and does not constitute advice in any form in the furtherance of any trade or trading decisions.
The accuracy, completeness and timeliness of the information contained on this site cannot be guaranteed. IC Markets does not warranty, guarantee or make any representations, or assume any liability with regard to financial results based on the use of the information in the site.
News, views, opinions, recommendations and other information obtained from sources outside of www.icmarkets.com.au, used in this site are believed to be reliable, but we cannot guarantee their accuracy or completeness. All such information is subject to change at any time without notice. IC Markets assumes no responsibility for the content of any linked site. The fact that such links may exist does not indicate approval or endorsement of any material contained on any linked site.
IC Markets is not liable for any harm caused by the transmission, through accessing the services or information on this site, of a computer virus, or other computer code or programming device that might be used to access, delete, damage, disable, disrupt or otherwise impede in any manner, the operation of the site or of any user’s software, hardware, data or property.


