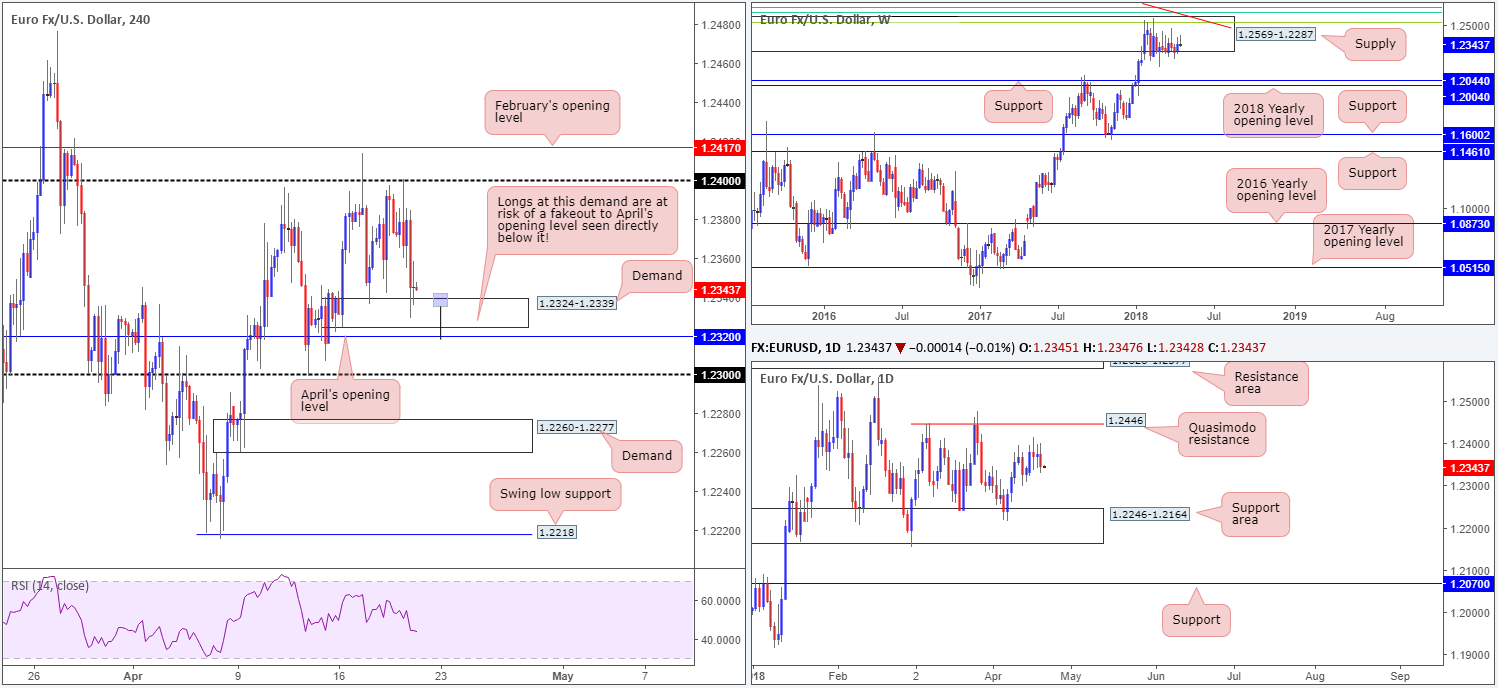
EUR/USD:
H4 demand at 1.2324-1.2339 elbowed its way into the spotlight once again on Thursday, following a to-the-pip retest at the underside of 1.24. US Treasury yields accelerated higher during US trade, bolstering the USD and thus pressuring the single currency lower. As you can see, we now have a clear range in motion on the H4 scale between the two aforementioned structures.
Following back-to-back daily indecision candles, the euro printed a nice-looking daily bearish engulfing candle yesterday. Follow-through selling from this point has the medium-term daily support area at 1.2246-1.2164 to target. This area, as highlighted in previous reports, has capped downside activity since late January, effectively preventing weekly price from pressing lower from a major-league weekly supply at 1.2569-1.2287.
Potential trading zones:
Intraday traders are likely honing in on the current H4 demand base for potential longs today. Caution is warranted in regard to stop placement, though. Directly beneath this area sits April’s opening level at 1.2320. This has ‘fakeout to me’ written all over it! In addition to this, let’s also remember that the recent daily bearish engulfing candle could influence price movement today, potentially probing much lower than 1.2320.
A fakeout to April’s opening level in the shape of a H4 bullish pin-bar formation, nevertheless (as drawn on the chart), would, in our technical view, still be a worthy intraday long, targeting 1.24. However, constant monitoring of the position is recommended!
Data points to consider today: German Buba President Weidmann speaks; FOMC member Williams also takes to the stage.
GBP/USD:
It has been quite a week for the British pound!
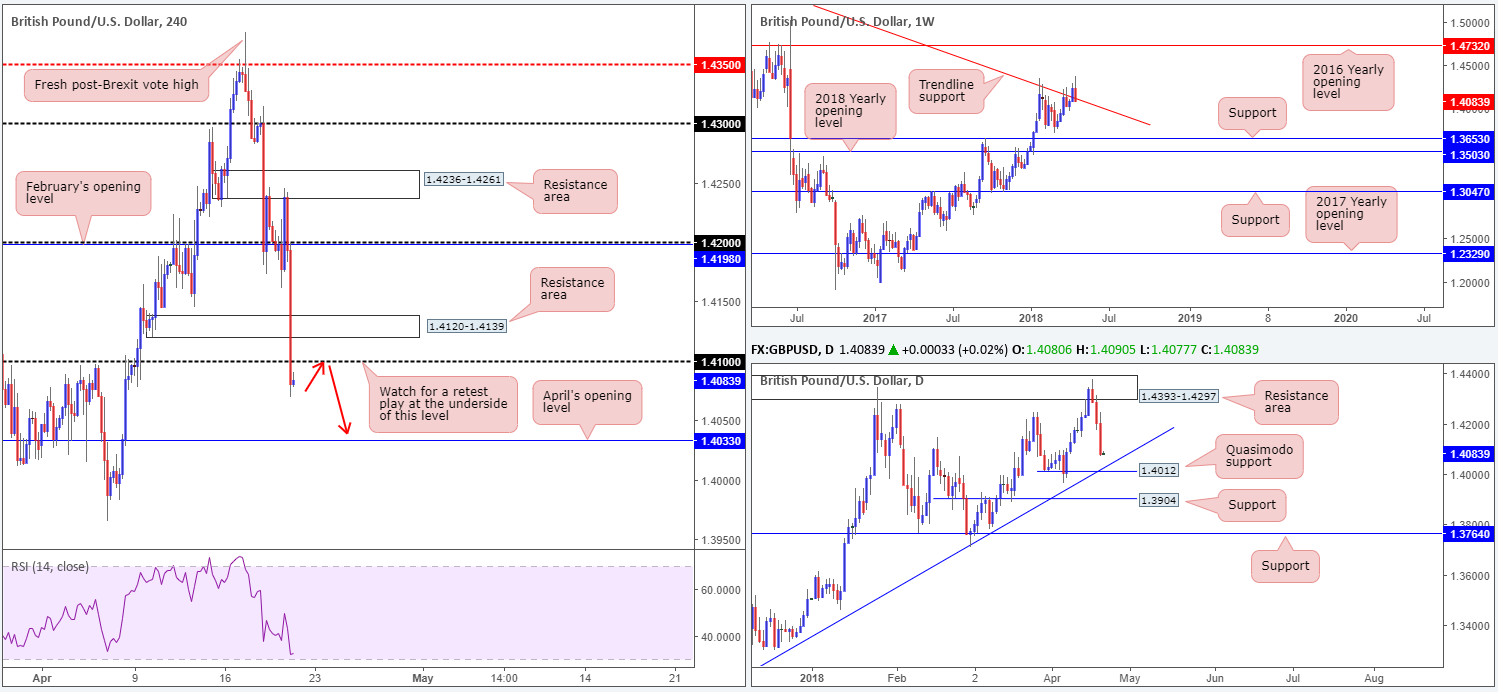
Cable initially spiked to a low of 1.4161 on the back of disappointing retail sales amid the early hours of London morning trade on Thursday. The move, however, was short lived as price managed to reclaim 1.42. It was comments from BoE’s Governor Carney that put a downward bias into sterling, with some interpreting his comments as a suggestion that the May hike was not a dead-cert. Multiple H4 tech supports were wiped out in one fell swoop, with the H4 candles ending the day sub 1.41!
In the shape of three near-full-bodied daily bearish candles, daily price is now seen trading within shouting distance of support plotted at 1.4012: a Quasimodo support that intersects nicely with a daily trend line support taken from the low 1.3061. Also interesting is weekly price recently poked its way back beneath the long-term weekly trend line resistance taken from the high 1.5930.
Potential trading zones:
A potential retest play at the underside of 1.41 is a possible option today. To avoid being stopped out on a fakeout above 1.41 (a common occurrence around psychological numbers), consider waiting and seeing if H4 price can form a full or near-full-bodied bearish candle on the retest. To our way of seeing things, this would be a clear sell signal, targeting April’s opening level on the H4 timeframe at 1.4033 as the initial take-profit zone, followed then by the daily Quasimodo support mentioned above at 1.4012.
Data points to consider today: MPC member Saunders speaks; FOMC member Williams also takes to the stage.
AUD/USD:
Speculators began scooping up the USD amid Thursday’s trade as risk appetite shriveled.
In the early hours, however, the commodity currency suffered a hit following a disappointing employment reading. It appeared to shake off the loss relatively quickly, though, breaking back above 0.78 and touching highs of 0.7812. The upside move, nevertheless, was a short-lived one as the unit shortly after tumbled lower in lock-step with other risk assets.
For those who read Wednesday’s report you may recall the desk highlighted additional shorts from the H4 resistance area at 0.7813/0.78 (61.8% H4 Fib resistance/round number). We continued to favor this zone as the area houses the 2018 yearly opening level seen on the weekly timeframe at 0.7801. H4 price even printed a near-full-bodied bearish candle before dropping sharply lower! Well done to any of our readers who managed to jump aboard here.
Moving forward, we can see H4 price shows room to potentially extend losses today, targeting the 0.77 handle/H4 demand area seen marked with a green arrow at 0.7961-0.7706. Across on the daily timeframe, price action marginally crossed below daily support at 0.7732, placing daily demand at 0.7626-0.7665 in the spotlight. Weekly price, on the other hand, shows a stellar reaction forming off of 0.7801: the 2018 yearly opening level mentioned above. Continued selling from here has the long-term weekly channel support extended from the low 0.6827 to target.
Potential trading zones:
To take advantage of any additional downside left in this market, a retest of the recently broken H4 mid-level support at 0.7750 could be something to watch for today, targeting 0.77ish as the initial take-profit zone. We would, however, advise waiting for H4 price to show bearish intent prior to pulling the trigger off of 0.7750 as a fakeout up to March’s opening level at 0.7763 is a real possibility.
Data points to consider today: FOMC member Williams takes to the stage.

USD/JPY:
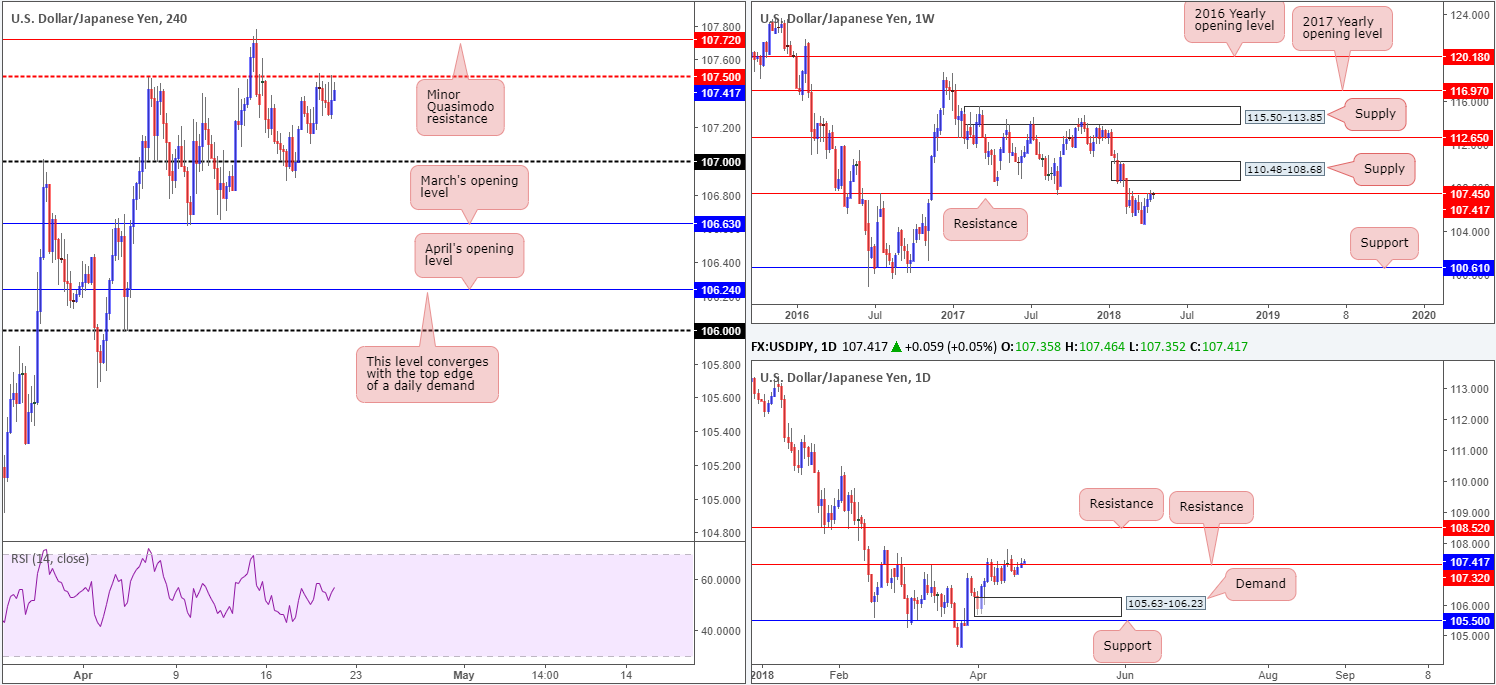
Over the course of Thursday’s session, movement was somewhat restricted to a tight range beneath a H4 mid-level resistance pegged at 107.50. Given the current uptrend on the H4 timeframe, traders likely have their crosshairs fixed on a new higher high forming. However, the beautiful thing about multi-timeframe analysis is that it shows the OVERALL picture!
Check out the weekly timeframe. Candle action is seen interacting with a notable resistance at 107.45. This level, as you can see, boasts a reasonably robust history and therefore could eventually force price action lower. In the event price reaches for higher levels, nonetheless, the next port of call can be seen in the shape of a weekly supply zone at 110.48-108.68. In conjunction with weekly flows, daily action is also seen jostling with a nearby resistance at 107.32. A violation of this line will likely place daily resistance at 108.52 in the spotlight (seen just south of the noted weekly supply), whereas a rejection to the downside has daily demand at 105.63-106.23 to target.
Potential trading zones:
While H4 shows potential to press higher in terms of its current trend, both weekly and daily price show immediate structure at hand. Therefore, entering long in this market is considered a chancy move, according to the technicals.
Before short positions can be considered, we would recommend waiting for at least the 107 handle on the H4 timeframe to be taken out. That way, the next downside target, apart from March’s opening level at 106.63, can be set at April’s opening level at 106.24, which happens to coincide beautifully with the top edge of the aforementioned daily demand zone.
Data points to consider today: FOMC member Williams takes to the stage.
USD/CAD:
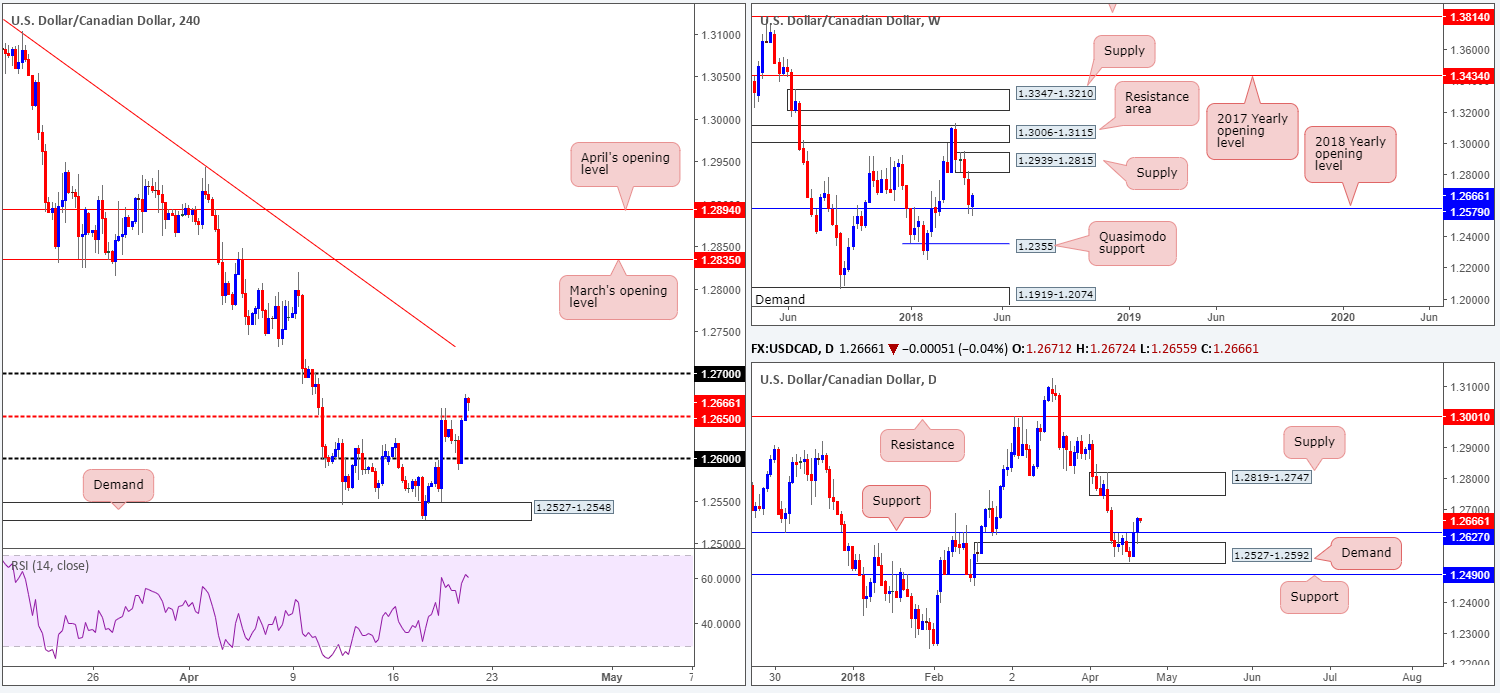
The USD/CAD firmly retested the 1.26 handle on the H4 timeframe during Thursday’s movement, and thereafter extended Wednesday’s BoC-induced gains and clocked fresh highs beyond the H4 mid-level resistance at 1.2650. With upside on the H4 timeframe now likely eyeing 1.27, let’s step over to the higher timeframes for a look at the overall picture.
Weekly price is seen firmly rejecting the 2018 yearly opening level priced in at 1.2579. With room seen for the unit to press as high as weekly supply seen at 1.2939-1.2815, further buying in this market could be in store. The story on the daily timeframe shows price action extended its bounce from daily demand at 1.2527-1.2592 and reclaimed daily resistance at 1.2627. To our way of seeing things, a move towards daily supply priced in at 1.2819-1.2747 (glued to the underside of the noted weekly supply) may be seen.
Potential trading zones:
With all three timeframes showing favored upside, the H4 mid-level base plotted at 1.2650 could be an ideal spot look for a retest play, targeting 1.27 as the initial take-profit zone. However, the ultimate upside target for longs would be best suited to the underside of the daily supply zone mentioned above at 1.2747. That’s a near-100-pip move from 1.2650 should it play out.
Data points to consider today: FOMC member Williams takes to the stage; Big day for the Canadian dollar in terms of inflation readings!
USD/CHF:
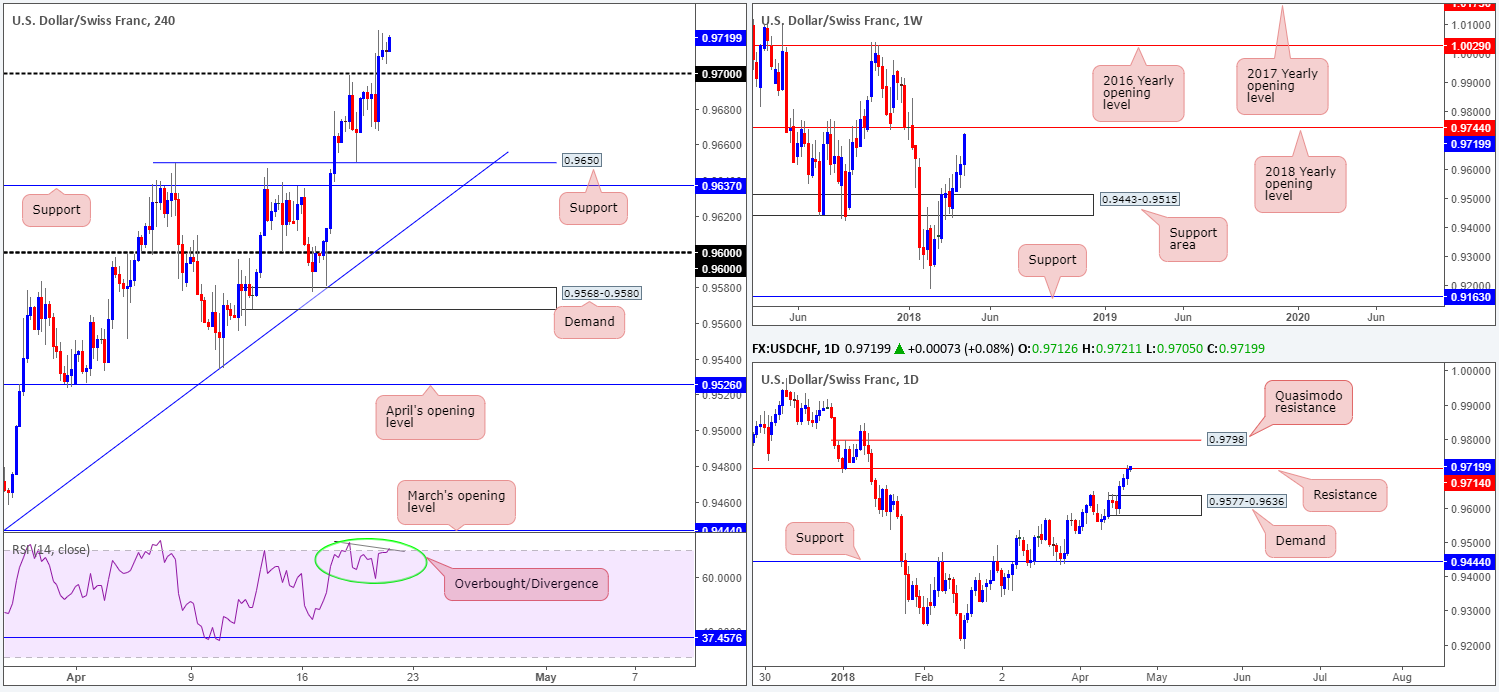
The US dollar continues to outperform against its Swiss counterpart, registering its third consecutive daily close higher on Thursday. This, as shown on the H4 timeframe, has firmly positioned the unit north of the 0.97 handle, with the H4 mid-level resistance at 0.9750 now in the spotlight (not seen on the screen). What’s also interesting is the H4 RSI indicator is displaying bearish divergence in overbought territory.
Casting our lines a little further ahead, weekly price is seen trading within touching distance of the 2018 yearly opening level found at 0.9744. Daily movement, on the other hand, has already checked in with significant daily resistance priced in at 0.9714.
Potential trading zones:
Given daily resistance at 0.9714 currently in play, and nearby weekly resistance at 0.9744, a rotation to the downside may be upon us in the near future. As mentioned in yesterday’s report, the team has stated the safer short is at the weekly level (effectively shorts from the H4 mid-level resistance at 0.9750). That way, you help avoid getting stopped out on a fakeout above the 0.9714 daily resistance on the daily timeframe. A reasonably sized H4 full or near-full-bodied bearish candle printed from 0.9750 would, technically speaking, be an ideal sell signal to get short this market.
Data points to consider today: FOMC member Williams takes to the stage.
DOW 30:
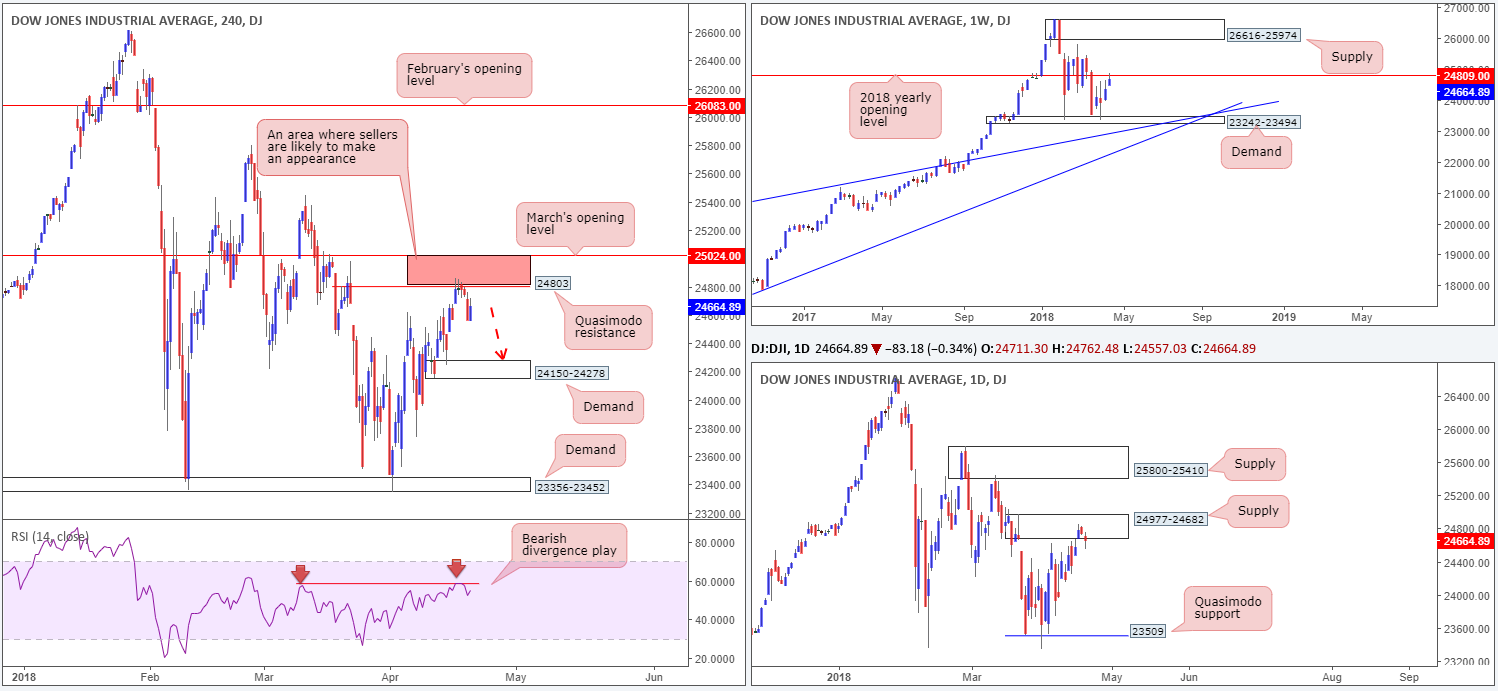
As anticipated, US equities retreated nicely from the H4 resistance area marked in red at 25024/24803 (March’s opening level and a H4 Quasimodo resistance). Why we liked this zone was simply down to the H4 RSI indicator displaying bearish divergence, as well as having strong connections to higher timeframe structures. Housed within the current H4 resistance area is the 2018 yearly opening level seen on the weekly timeframe at 24809. In conjunction with weekly movement, daily action is seen trading within the walls of a daily supply zone priced in at 24977-24682.
Potential trading zones:
According to market structure, further downside could be upon us. We believe the H4 candles are likely to retest H4 demand brought in at 24150-24278. Beyond this area, the team has noted to also keep an eyeball on the H4 demand at 23356-23452 as the next downside target, which happens to be positioned just beneath a daily Quasimodo support at 23509.
Data points to consider today: FOMC member Williams takes to the stage.
GOLD:
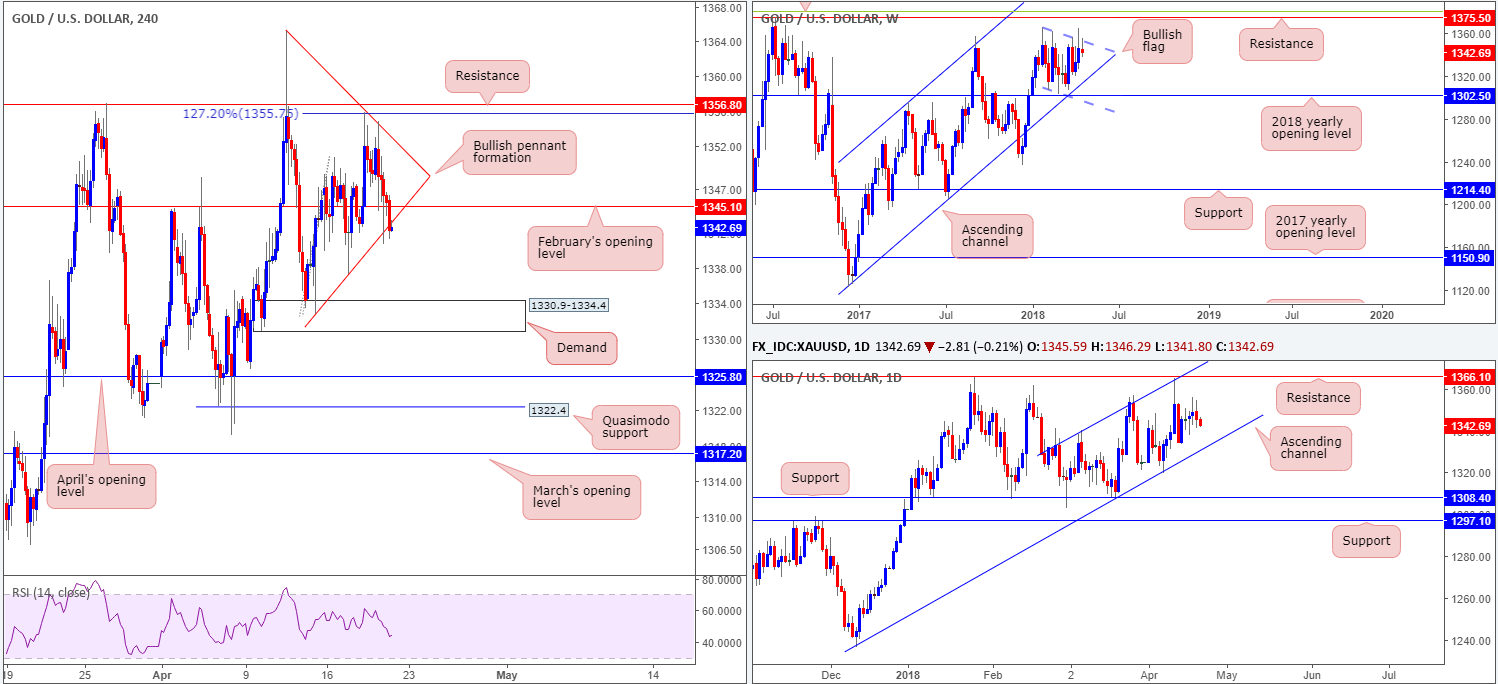
Beginning with a look at the weekly timeframe this morning, the unit remains encased within a weekly bullish flag (1366.0/1307.2). More specifically, though, weekly price is seen fading the top edge of this formation, which could eventually lead to a move back down to weekly channel support etched from a low of 1122.8.
As things stand on the daily timeframe, the yellow metal has spent over a month compressing within an ascending channel (1236.6/1340.5). Therefore, on this scale we still see potential for the market to jolt either way within this formation.
Across on the H4 timeframe, bullion faded a 127.2% H4 Fib ext. point at 1355.7 in recent trade, consequently pressuring the unit below February’s opening level at 1345.1 and into the lower edge of a H4 bullish pennant formation (1332.7/1365.2). A break beyond this line would highlight H4 demand placed at 1330.9-1334.4, followed closely by April’s opening level at 1325.8.
Potential trading zones:
Intraday action could offer potential shorting opportunities on a break below the current H4 bullish pennant pattern, targeting H4 demand priced in at 1330.9-1334.4. The move is also bolstered by the fact that weekly price is seen fading the top edge of a weekly bullish flag, and daily price showing room to press as far south as channel support taken from the low 1236.6.
This site has been designed for informational and educational purposes only and does not constitute an offer to sell nor a solicitation of an offer to buy any products which may be referenced upon the site. The services and information provided through this site are for personal, non-commercial, educational use and display. IC Markets does not provide personal trading advice through this site and does not represent that the products or services discussed are suitable for any trader. Traders are advised not to rely on any information contained in the site in the process of making a fully informed decision.
This site may include market analysis. All ideas, opinions, and/or forecasts, expressed or implied herein, information, charts or examples contained in the lessons, are for informational and educational purposes only and should not be construed as a recommendation to invest, trade, and/or speculate in the markets. Any trades, and/or speculations made in light of the ideas, opinions, and/or forecasts, expressed or implied herein, are committed at your own risk, financial or otherwise.
The use of the site is agreement that the site is for informational and educational purposes only and does not constitute advice in any form in the furtherance of any trade or trading decisions.
The accuracy, completeness and timeliness of the information contained on this site cannot be guaranteed. IC Markets does not warranty, guarantee or make any representations, or assume any liability with regard to financial results based on the use of the information in the site.
News, views, opinions, recommendations and other information obtained from sources outside of www.icmarkets.com.au, used in this site are believed to be reliable, but we cannot guarantee their accuracy or completeness. All such information is subject to change at any time without notice. IC Markets assumes no responsibility for the content of any linked site. The fact that such links may exist does not indicate approval or endorsement of any material contained on any linked site.
IC Markets is not liable for any harm caused by the transmission, through accessing the services or information on this site, of a computer virus, or other computer code or programming device that might be used to access, delete, damage, disable, disrupt or otherwise impede in any manner, the operation of the site or of any user’s software, hardware, data or property.