Friday 16th June: Technical outlook and review.
Waiting for lower timeframe confirmation is our main tool to confirm strength within higher timeframe zones, and has really been the key to our trading success. It takes a little time to understand the subtle nuances, however, as each trade is never the same, but once you master the rhythm so to speak, you will be saved from countless unnecessary losing trades. The following is a list of what we look for:
· A break/retest of supply or demand dependent on which way you’re trading.
· A trendline break/retest.
· Buying/selling tails/wicks – essentially we look for a cluster of very obvious spikes off of lower timeframe support and resistance levels within the higher timeframe zone.
· Candlestick patterns. We tend to stick with pin bars and engulfing bars as these have proven to be the most effective.
We typically search for lower-timeframe confirmation between the M15 and H1 timeframes, since most of our higher-timeframe areas begin with the H4. Stops are usually placed 1-3 pips beyond confirming structures.
EUR/USD:
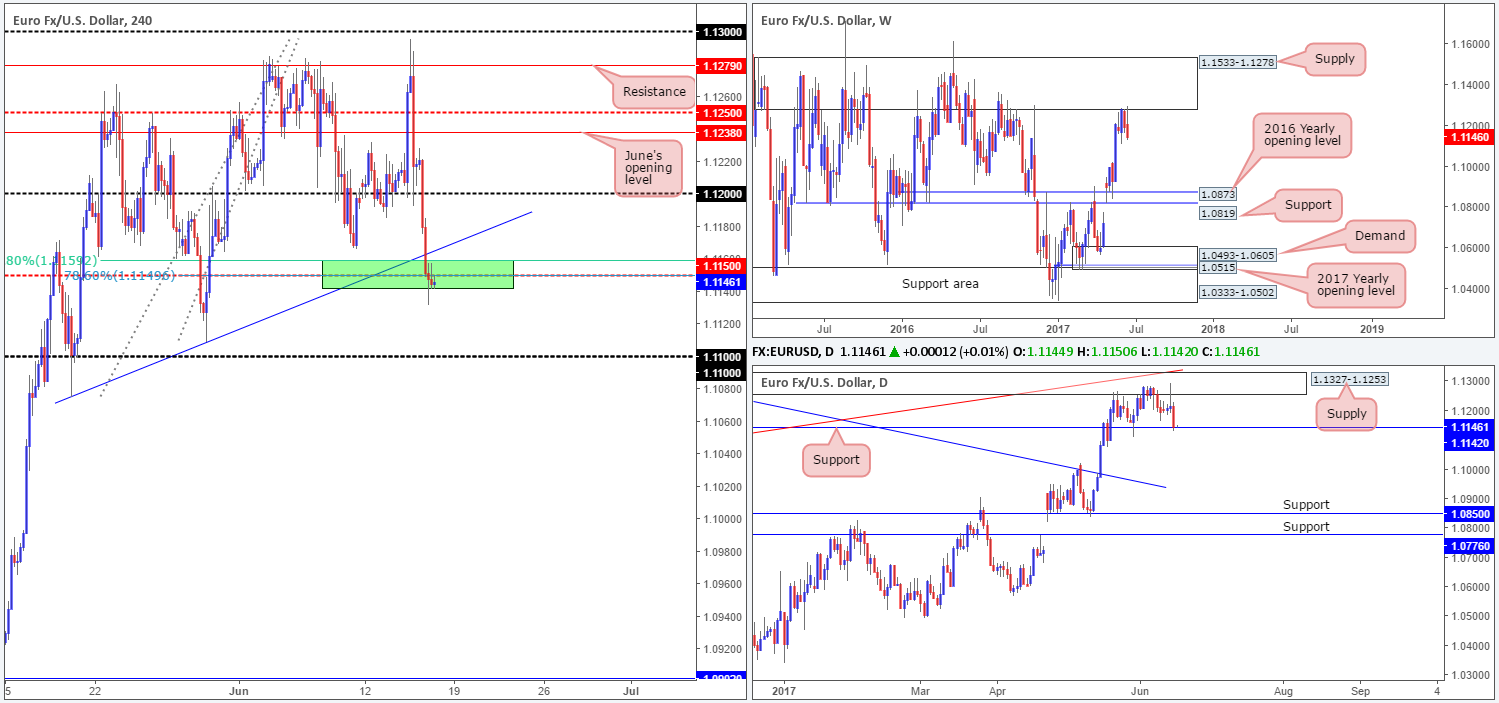
Across the board yesterday, we saw the US dollar advance for a second consecutive day, consequently forcing the dollar index to cross swords with H4 resistance at 97.47. As a result of this, the EUR also ran through the 1.12 handle and ended the day closing marginally below the H4 mid-level support at 1.1150.
For those who read Thursday’s report you may recall that we showed interest in buying from 1.1150 should a reasonably sized H4 bull candle (preferably a full-bodied candle) take shape. This is due to the following converging structures:
· A H4 trendline support etched from the low 1.1075.
· A H4 61.8% Fib support at 1.1159 drawn from the low 1.1074.
· A H4 78.6% retracement level pegged at 1.1149 penciled in from the low 1.1109.
· A daily support level seen at 1.1142.
As you can see though, H4 price has yet to print any noteworthy bullish intent, so we’re still watching this area as we write. Ideally, we’d like to see H4 price pop back above the aforementioned H4 trendline here.
Our suggestions: Basically, the reason for requiring additional H4 confluence around the 1.1150 neighborhood is due to the weekly sellers showing strength from the underside of a major supply coming in at 1.1533-1.1278!
Data points to consider: EUR Final CPI y/y at 10am. US Housing data at 1.30pm, US Prelim UoM consumer sentiment at 3pm, FOMC member Kaplan speaks at 5.45pm GMT+1.
Levels to watch/live orders:
· Buys: 1.1150 region ([waiting for a reasonably sized H4 bull candle – preferably a full-bodied candle – to form before pulling the trigger is advised] stop loss: ideally beyond the candle’s tail).
· Sells: Flat (stop loss: N/A).
GBP/USD:
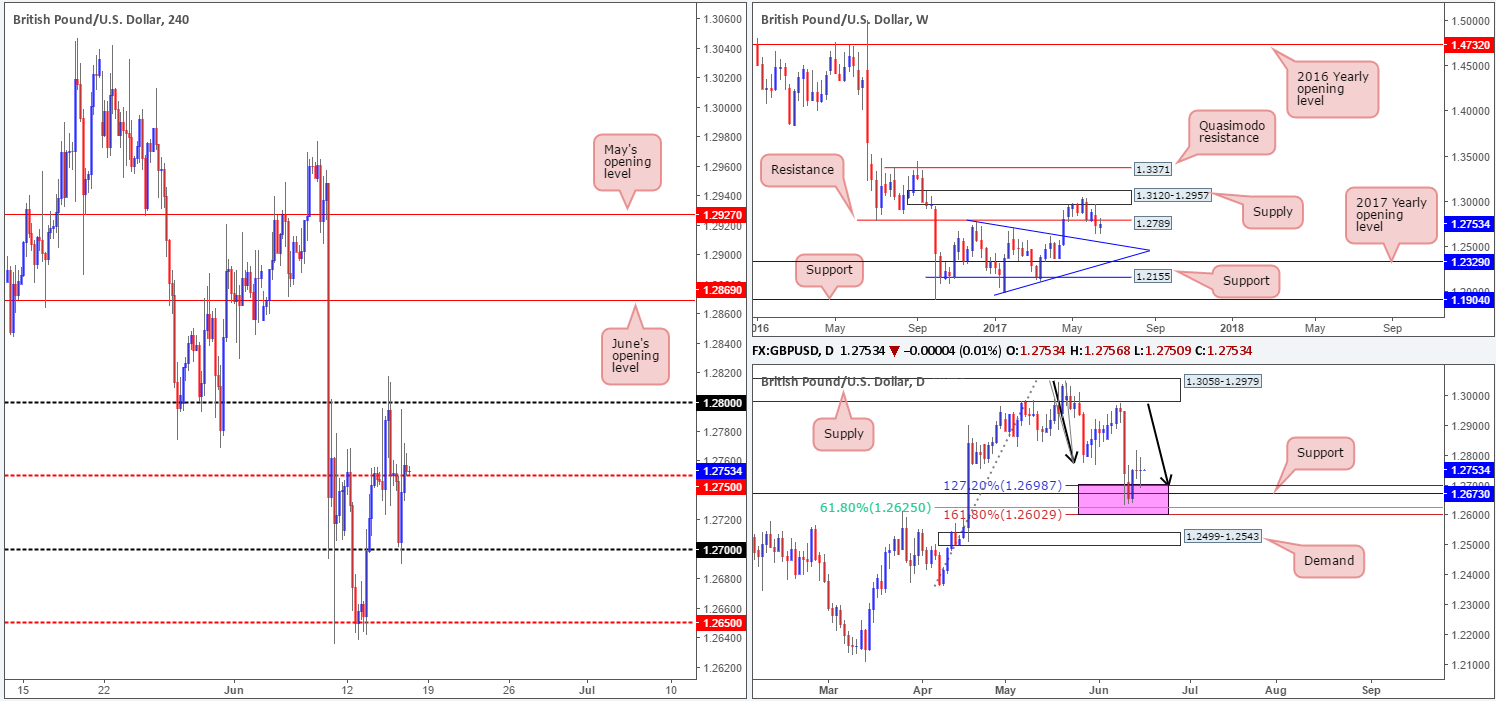
In spite of the GBP/USD ranging over 100 pips yesterday, the pair, once again, ended the day with little change. Looking over to the daily chart, this caused the unit to form a clear-cut indecision candle. Indecision is not really something one want’s to see when price recently bounced from, what we’d consider, a daily buy zone: 1.2602/1.2698 (a daily area marked in pink). This zone is comprised of a daily support level coming in at 1.2673, a daily 61.8% Fib support at 1.2625 (taken from the low 1.2365) and a daily AB=CD (black arrows) 127.2/161.8% ext. completion point seen at 1.2602/1.2698 (drawn from the high 1.3047).
While the H4 candles appear to be trying to establish a support around the mid-level number 1.2750, let’s keep in mind that weekly price recently tagged the underside of resistance pegged at 1.2789. With this level having provided both support and resistance since mid-2016, this is not a barrier one should overlook.
Our suggestions: A difference of opinion is clearly being seen on the higher timeframes (see above). And, as we said in Thursday’s report, judging direction can be tricky in situations like this. For that reason, our team has concluded that remaining on the sidelines for the time being is probably the best position to adopt.
Data points to consider: US Housing data at 1.30pm, US Prelim UoM consumer sentiment at 3pm, FOMC member Kaplan speaks at 5.45pm GMT+1.
Levels to watch/live orders:
· Buys: Flat (stop loss: N/A).
· Sells: Flat (stop loss: N/A).
AUD/USD:
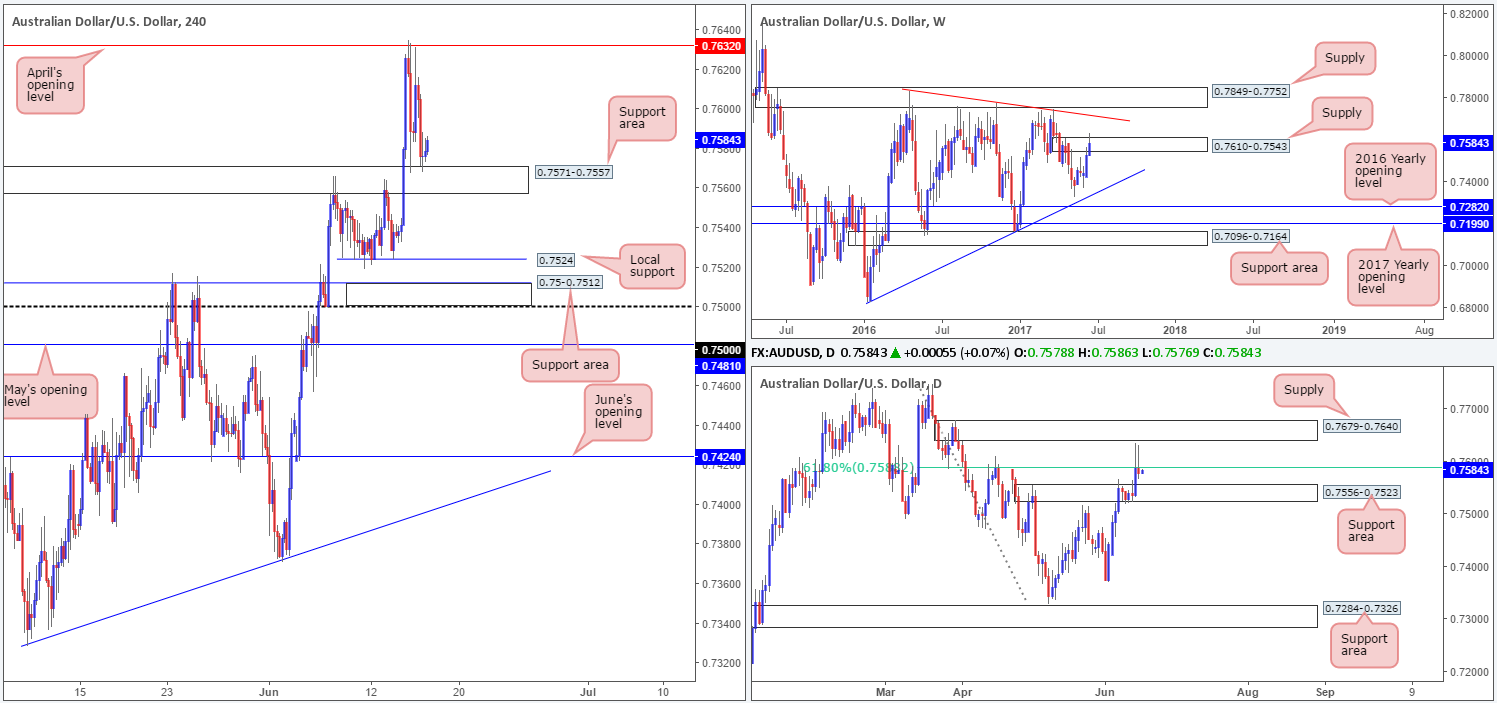
H4 action, as you can see, appears to be chiseling out a consolidation between April’s opening level at 0.7632 and the H4 support area coming in at 0.7571-0.7557. With no top-tier Aussie data on the docket today, the pair could potentially remain within this range into the week’s end. Technically speaking, however, we could eventually see the commodity currency turn lower.
Our reasoning lies within the higher-timeframe structure. On the weekly timeframe, the unit recently pierced above supply coming in at 0.7610-0.7543, likely filling a huge amount of buy stops in the process. Looking down to the daily candles, nonetheless, price managed to hold below the 61.8% Fib resistance at 0.7588 taken from the high 0.7747 for a second consecutive day, despite chalking in yet another aggressive whipsaw wick that almost tagged the underside of supply seen at 0.7679-0.7640.
Our suggestions: Traders may have also noticed that directly below the daily Fib level sits a daily support area coming in at 0.7556-0.7523. Therefore, although the higher-timeframes indicate that the bears may still have a hand in this fight, downside potential could be limited. And so, even if H4 price closes below the current H4 support area, there is little space for price to run as the top edge of the said daily support zone sits just 1 pip below this area! Given that, we’ll remain flat today and look to reassess structure going into Monday’s open.
Data points to consider: US Housing data at 1.30pm, US Prelim UoM consumer sentiment at 3pm, FOMC member Kaplan speaks at 5.45pm GMT+1.
Levels to watch/live orders:
· Buys: Flat (stop loss: N/A).
· Sells: Flat (stop loss: N/A).
USD/JPY:
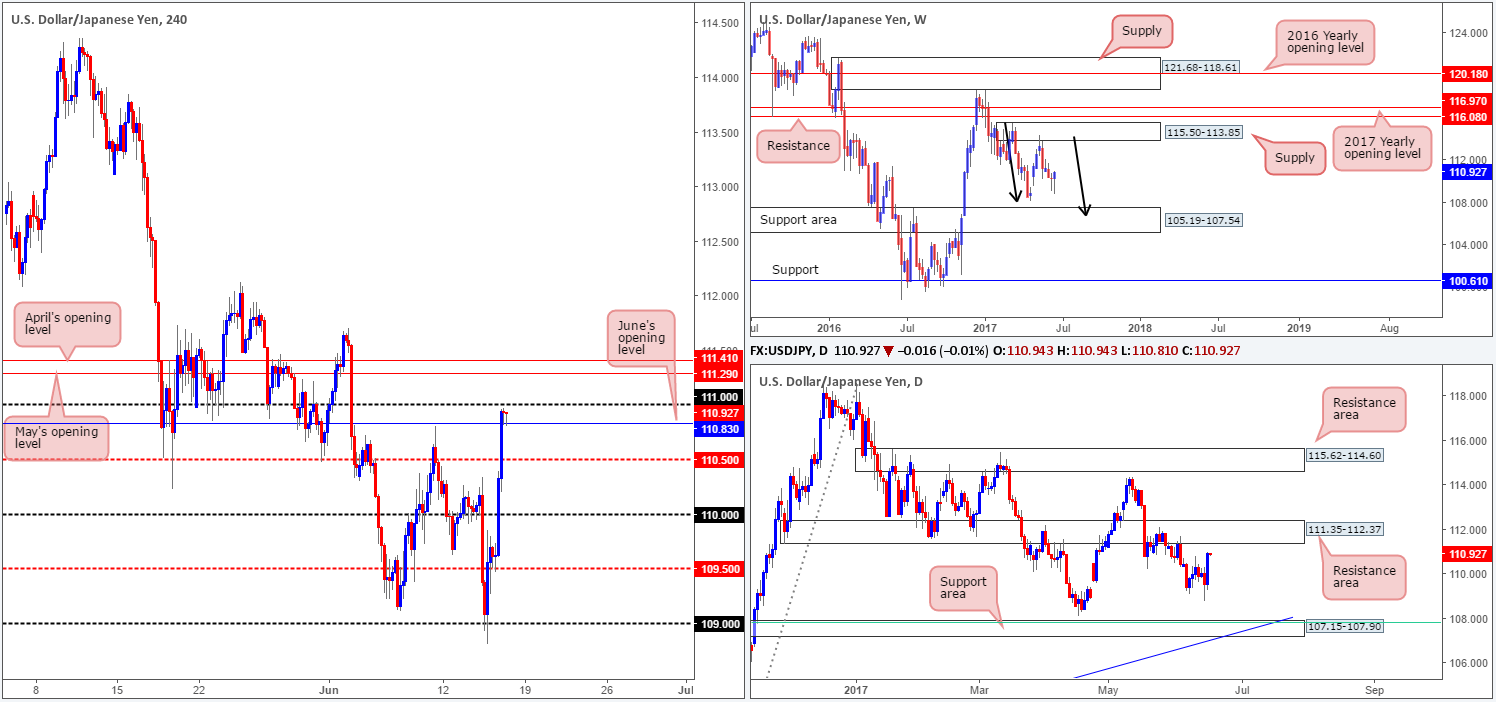
Weekly bears continue to remain in a relatively strong position after pushing aggressively lower from supply registered at 115.50-113.85. We know there’s a fair bit of ground to cover here, but this move could possibly result in further downside taking shape in the form of a weekly AB=CD correction (see black arrows) that terminates within a weekly support area marked at 105.19-107.54 (stretches all the way back to early 2014). Down on the daily chart, we can see that price is within striking distance of a resistance area drawn from 111.35-112.37. This base has been in play since the end of November 2016, so a bounce, at the very least, is expected to take form here.
Looking across to the H4 chart, the mid-level barrier 109.50 managed to hold firm yesterday and attracted fresh buyers into the market just ahead of London’s lunchtime. Consequent to this, a number of resistances were taken out with H4 price now seen trading between the 111 handle and June’s opening level at 110.83.
Our suggestions: Based on the above notes, our team has their eye on April/May’s opening levels seen above current price at 111.41/111.29. This is simply because these levels are collectively positioned nicely around the underside of the said daily resistance area! Given that 111.41/111.29 is rather small, nonetheless, we would advise waiting for lower-timeframe confirmation (see the top of this report) before pulling the trigger. This will help avoid any fakeout seen here.
Data points to consider: US Housing data at 1.30pm, US Prelim UoM consumer sentiment at 3pm, FOMC member Kaplan speaks at 5.45pm. BoJ Monetary policy statement and press conference at 7.30am GMT+1.
Levels to watch/live orders:
· Buys: Flat (stop loss: N/A).
· Sells: 111.41/111.29 ([waiting for lower-timeframe confirming action to form before pulling the trigger is advised] stop loss: dependent on where one confirms this area).
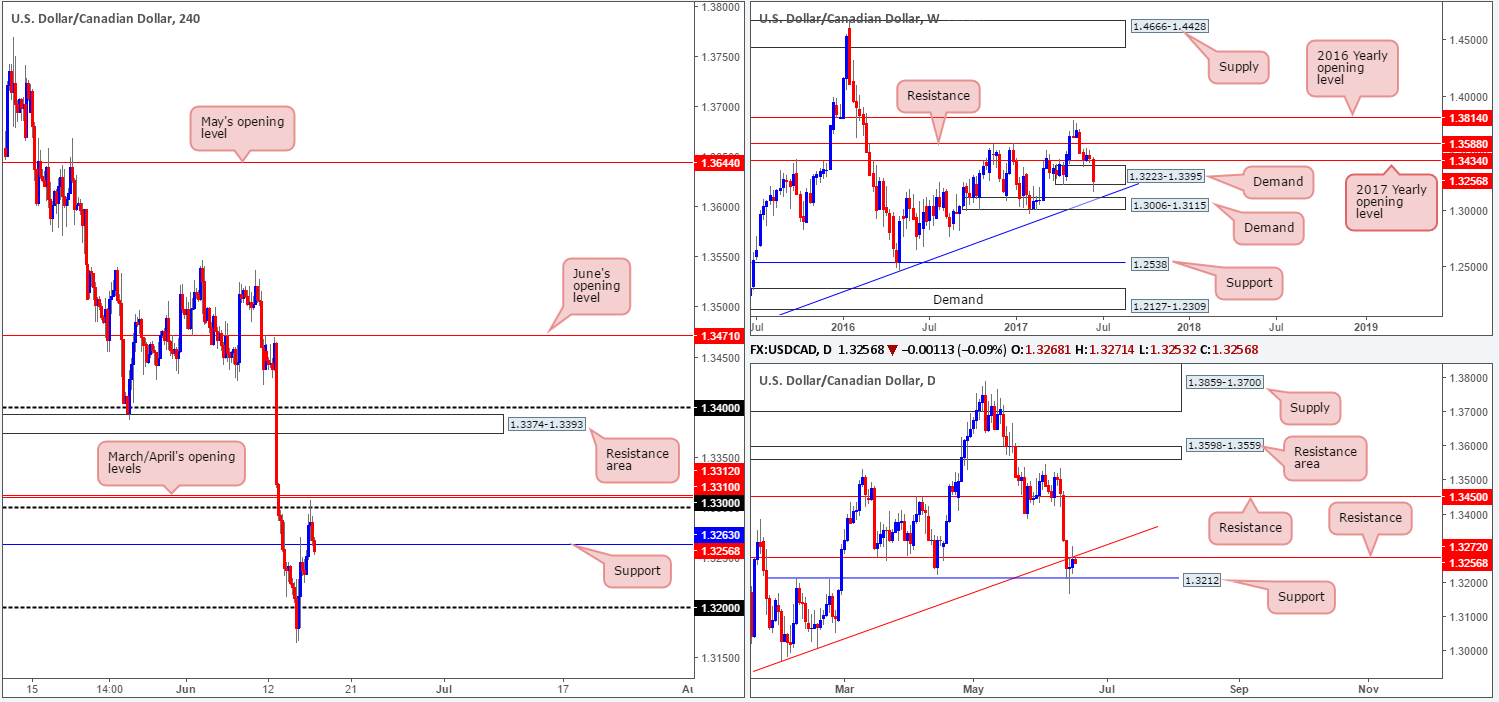
USD/CAD:
Although the USD/CAD bounced from daily support at 1.3212 on Wednesday, the bulls have struggled to muster enough strength to breach the daily resistance at 1.3272, which happens to converge with a daily trendline resistance extended from the low 1.2968. On a more positive note, weekly action remains trading around the lower edge of demand at 1.3223-1.3395, despite a whipsaw below this base taking place earlier on in the week.
A closer look at price action on the H4 chart shows that the unit recently whipsawed above the 1.33 handle, and came within a cat’s whisker of clipping March/April’s opening levels at 1.3312/1.3310. Managing to hold firm from here, the loonie is currently trading back below support registered at 1.3263, which could now potentially act as resistance going forward.
Our suggestions: Given the uncertainty surrounding the weekly demand area, and daily price showing that the bears may have the upper hand at the moment, we may consider shorting should a H4 close print below the current H4 support level, targeting the 1.32 neighborhood.
A H4 close below 1.3263 followed up with a retest and a reasonably sized bearish candle (preferably a full-bodied candle) would, in our opinion, be enough evidence to validate the short.
Data points to consider: US Housing data at 1.30pm, US Prelim UoM consumer sentiment at 3pm, FOMC member Kaplan speaks at 5.45pm GMT+1.
Levels to watch/live orders:
· Buys: Flat (Stop loss: N/A).
- Sells: Watch for H4 price to engulf 1.3263 and then look to trade any retest seen thereafter ([waiting for a reasonably sized H4 bearish candle to form before pulling the trigger is advised] stop loss: ideally beyond the candle’s wick).
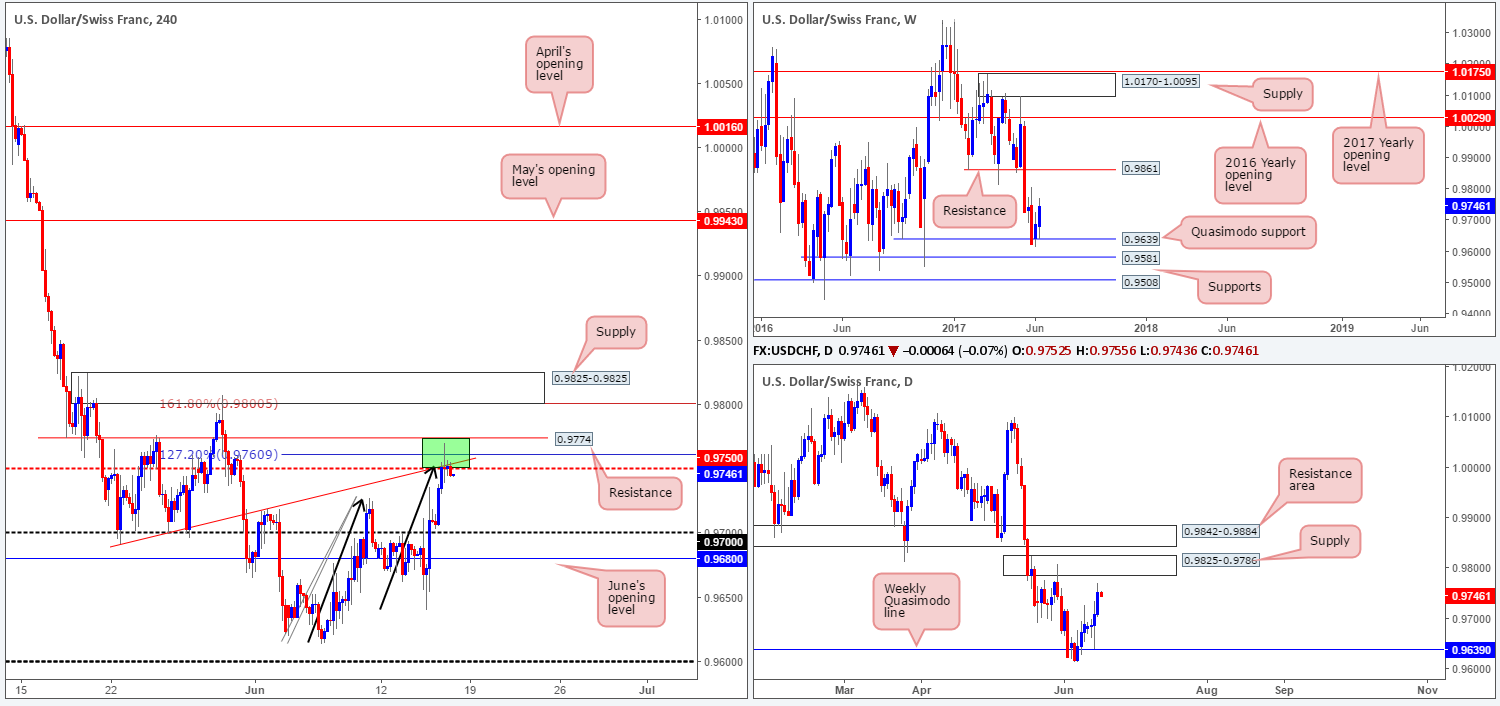
USD/CHF:
While the H4 green area at 0.9774/0.9750 could potentially hold prices lower today, there’s also a chance that H4 price may extend up to supply coming in at 0.9825-0.9801.
0.9774/0.9750 is comprised of a H4 resistance level at 0.9774, a H4 AB=CD 127.2% ext. at 0.9760 taken from the low 0.9613, a H4 trendline resistance etched from the low 0.9691 and a H4 mid-level resistance drawn from 0.9750. The H4 supply above, however, houses a H4 AB=CD 161.8% ext. at 0.98 taken from the low 0.9613 and the round number 0.98.
The interesting thing here is the lower (green) H4 area has no higher-timeframe convergence, whereas the H4 supply positioned above is located around the upper edge of daily supply marked at 0.9825-0.9786.
Our suggestions: In light of the above notes, our desk has decided to hold fire and wait and see if H4 price can extend up to supply seen at 0.9825-0.9801. Should price strike this area today, we would, dependent on the time of day, look to sell from here at market, with stops sited at 0.9827, targeting 0.9750 as an initial take-profit zone.
Data points to consider: US Housing data at 1.30pm, US Prelim UoM consumer sentiment at 3pm, FOMC member Kaplan speaks at 5.45pm GMT+1.
Levels to watch/live orders:
· Buys: Flat (stop loss: N/A).
· Sells: 0.98 (stop loss: 0.9827).
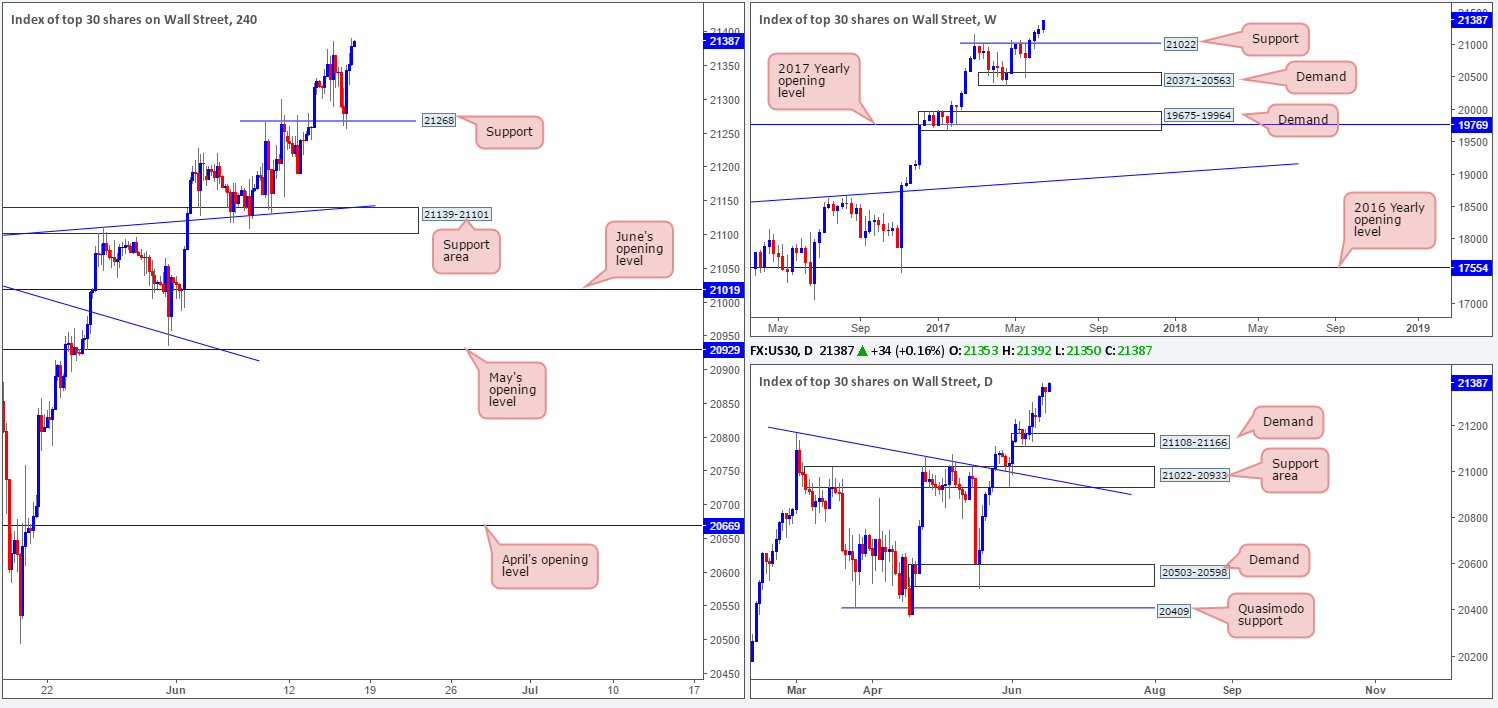
DOW 30:
As can be seen from the H4 chart, US equities retested 21268 as support and recently clocked a fresh record high of 21392.
For those who have been following our reports over the past few days you may recall that our desk had recently taken a small long position at 21164 and initially placed stops below the H4 support area (21139-21101) at 21097. The position is still active, but we have liquidated 50% of the trade around the 21234 neighborhood.
Fortunately, the index has continued to push higher, as we are now looking to trail this market with the remainder of our position. The stop-loss order has been moved to 21247, a few points below the current H4 support, putting our overall gain into respectable numbers.
In Thursday’s report, we also noted to watch for possible long opportunities from 21268 should a reasonably sized H4 bull candle take shape from here. As you can see, this did occur, so well done to any of our readers who jumped on board here!
Our suggestions: Personally, we are looking for price to continue rallying into the week’s end, as we intend on trailing this trend long term.
Data points to consider: US Housing data at 1.30pm, US Prelim UoM consumer sentiment at 3pm, FOMC member Kaplan speaks at 5.45pm GMT+1.
Levels to watch/live orders:
· Buys: 21164 ([live] stop loss: 21247).
· Sells: Flat (stop loss: N/A).
GOLD:
Gold prices continued to decline in value yesterday as the dollar remained in a bullish stance. As can be seen from the weekly timeframe, the bears continue to hold this market lower after connecting with an area comprised of two weekly Fibonacci extensions 161.8/127.2% at 1313.7/1285.2 taken from the low 1188.1 (green zone). From this scale, there’s room for the precious metal to continue pumping lower until we reach the demand base coming in at 1194.8-1229.1.
Daily price is still seen teasing the demand base coming in at 1247.7-1258.8, but looks vulnerable. Pressure from weekly sellers could see this area consumed, which in turn would likely bring the candles down to the channel support taken from the low 1180.4 (intersects with the above said weekly demand base).
Over on the H4 candles, the unit broke below the trendline support etched from the low 1249.3 and retested the barrier as resistance. The next level of interest below is April’s opening level at 1248.0.
Our suggestions: Buying from within the current daily demand or from April’s opening level is not something we’d feel comfortable with given the position of weekly price at the moment. And likewise, selling, although you’d be trading in line with weekly flow, is not advisable given the daily demand and April’s monthly opening level in view.
With that being the case, for us personally, we’re going to continue taking the side of caution and remain on the sidelines for the time being.

Levels to watch/live orders:
· Buys: Flat (stop loss: N/A).
· Sells: Flat (stop loss: N/A).


