Waiting for lower timeframe confirmation is our main tool to confirm strength within higher timeframe zones, and has really been the key to our trading success. It takes a little time to understand the subtle nuances, however, as each trade is never the same, but once you master the rhythm so to speak, you will be saved from countless unnecessary losing trades. The following is a list of what we look for:
- A break/retest of supply or demand dependent on which way you’re trading.
- A trendline break/retest.
- Buying/selling tails/wicks – essentially we look for a cluster of very obvious spikes off of lower timeframe support and resistance levels within the higher timeframe zone.
We typically search for lower-timeframe confirmation between the M15 and H1 timeframes, since most of our higher-timeframe areas begin with the H4. Stops are usually placed 1-3 pips beyond confirming structures.
EUR/USD:
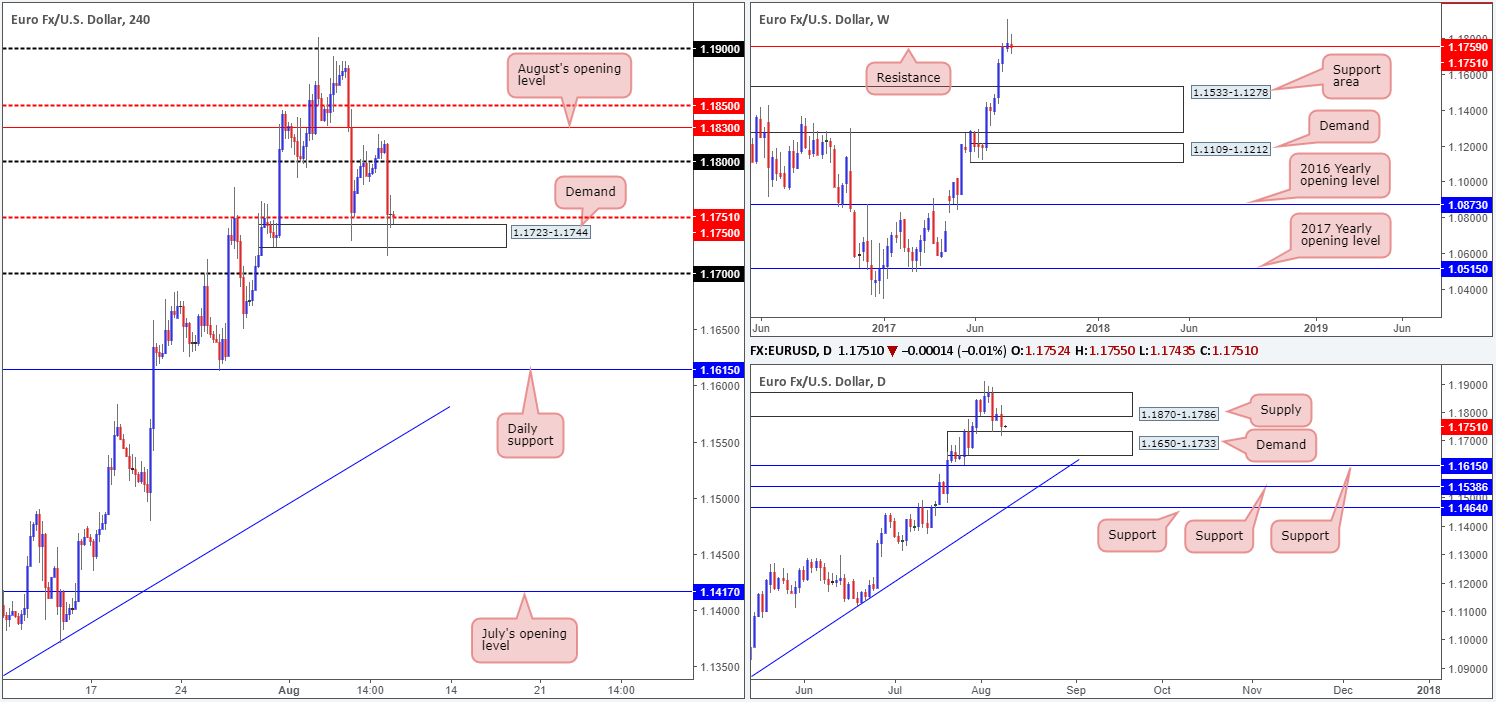
During the course of Tuesday’s sessions, the H4 candles briefly rose above the 1.18 handle and touched a high of 1.1823. As you can see though, price failed to generate much follow through beyond this point thanks largely to a strong US JOLTS report.
The unit ended the day aggressively whipsawing through both the mid-level support at 1.1750 and neighboring demand coming in at 1.1723-1.1744, likely triggering a truckload of sell stops in the process and potentially opening up the path south to the 1.17 neighborhood.
What yesterday’s move also accomplished was a marginal break below weekly resistance at 1.1759. Considering that last week’s action printed a strong-looking weekly selling wick, this move has likely sparked interest among the candlestick community. At the same time, however, one may want to take into account that daily flow recently reconnected with demand pegged at 1.1650-1.1733.
Our suggestions: With H4 price yet to close below 1.1750 and the daily candles seen trading from demand, we’re reluctant to sell this market at this time. Unfortunately, buying is also a challenge at the moment, given the nearby daily supply at 1.1870-1.1786.
With that in mind, our team has concluded that remaining flat is the better path to take for now.
Data points to consider: No high-impacting news events scheduled on the docket today.
Levels to watch/live orders:
- Buys: Flat (stop loss: N/A).
- Sells: Flat (stop loss: N/A).
GBP/USD:
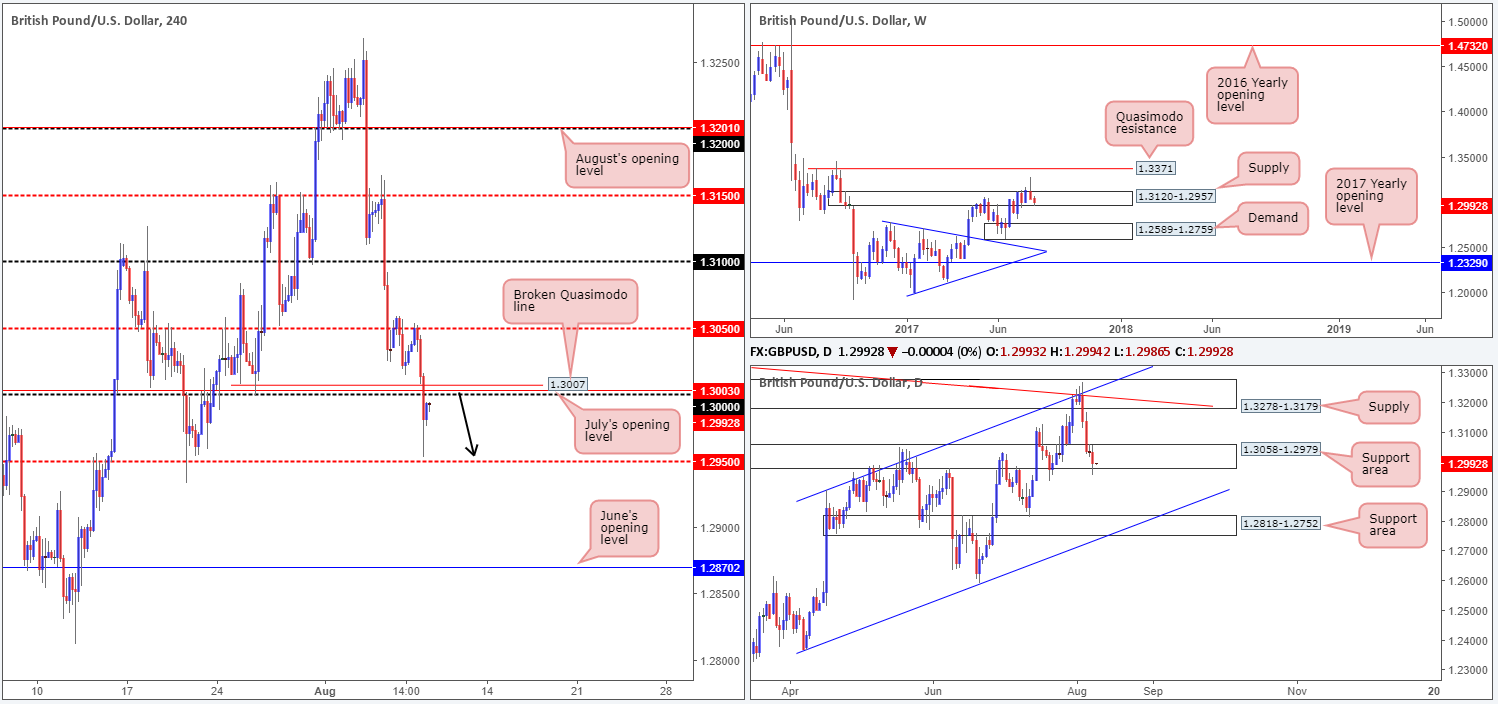
In recent trading, we saw the GBP/USD cross below the large psychological band 1.30 and come within touching distance of connecting with the H4 mid-level support at 1.2950. Right now, however, the H4 candles look poised to retest 1.30 as resistance. There are several features about this number that deserves mention. Fusing closely with this number is July’s opening level at 1.3003 and a H4 broken Quasimodo line at 1.3007. Also of particular interest is the recent break below the daily support area marked at 1.3058-1.2979, and weekly price seen trading from supply coming in at 1.3120-1.2957.
Our suggestions: If you’re thinking of selling from the 1.30 neighborhood today, stops can be placed around the 1.3015ish range, above a small M30 supply (1.3012-1.3003) that is positioned closely around the above noted H4 resistances. Should the trade come to fruition, the initial area of concern would be 1.2950, which if achieved would already provide over three times one’s risk.
Data points to consider: No high-impacting news events scheduled on the docket today.
Levels to watch/live orders:
- Buys: Flat (stop loss: N/A).
- Sells: 1.30 region (stop loss: 1.3015).
AUD/USD:
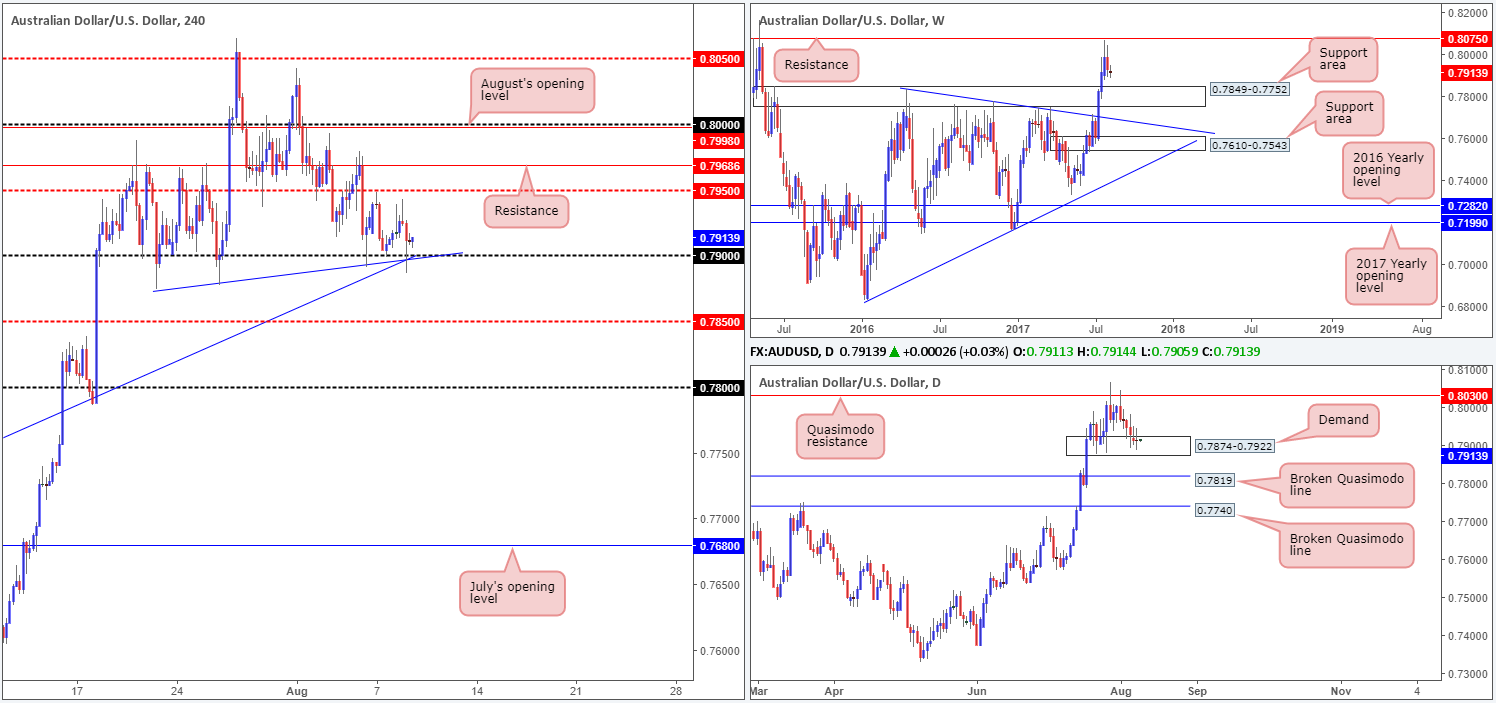
The 0.79 handle, as you can see, continues to provide a floor of support in this market, managing to withstand several bearish attacks over the past few weeks. Despite 0.79 fusing with two H4 trendline supports (0.7874/0.7635) and being positioned within daily demand at 0.7874-0.7922, the reactions from this psychological band appear to be weakening. This – coupled with weekly price showing space for the market to trade as far down as a support area coming in at 0.7849-0.7752, we believe that 0.79 is vulnerable.
Our suggestions: On account of the above notes, our team is now watching for H4 price to close below 0.79. A close lower followed by a retest and a H4 bearish candle, preferably in the shape of a full, or near-full-bodied candle, would, in our humble opinion, be enough evidence to suggest a short. The first take-profit zone would be the H4 mid-level support at 0.7850 (largely because this denotes the top edge of the noted weekly support area), followed closely by a daily broken Quasimodo line at 0.7819.
Data points to consider: Chinese inflation figures at 2.30am GMT+1.
Levels to watch/live orders:
- Buys: Flat (stop loss: N/A).
- Sells: Watch for H4 price to engulf 0.79 and then look to trade any retest seen thereafter ([waiting for a H4 bearish candle (preferably a full, or near-full-bodied candle) to form following the retest is advised] stop loss: ideally beyond the candle’s wick).
USD/JPY:
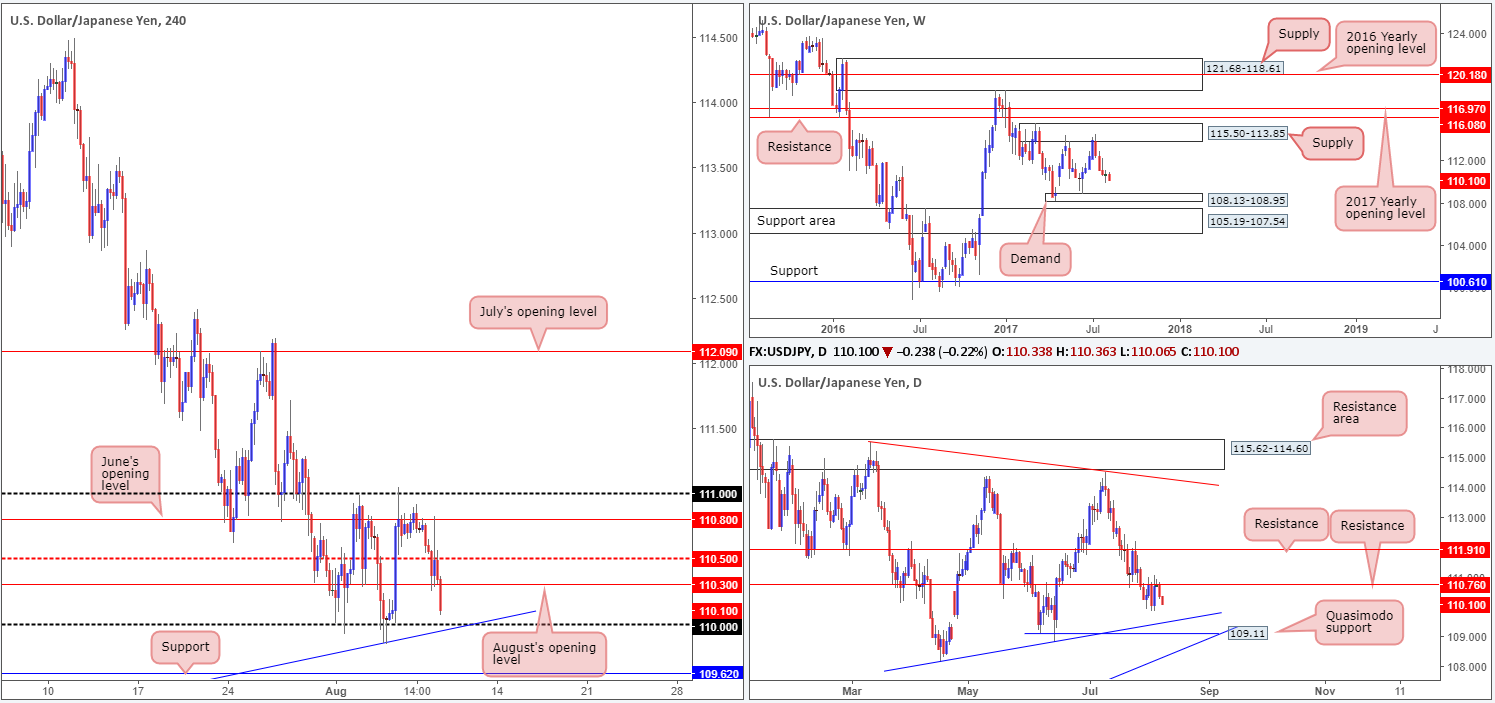
Using a top-down approach this morning, we can see that weekly price continues to trade towards a small demand pegged at 108.13-108.95. In conjunction with the weekly timeframe, daily price recently drove lower from a resistance level penciled in at 110.76. This level, as you can see, has a strong history and therefore could continue to hold the unit lower and clear the pathway south down to a Quasimodo support at 109.11 (converges closely with a trendline support taken from the low 108.13).
Across on the H4 chart, August’s opening level at 110.30 was recently engulfed, with price now seen trading within striking distance of the 110 handle. While this number fuses with a H4 trendline support etched from the low 108.80, we’re reluctant to buy here due our notes on higher-timeframe structure.
Our suggestions: At the time of writing, we do not see a lot to hang our hat on at the moment. Buying would place one against potential higher-timeframe sellers, and selling would involve shorting into 110 and its converging trendline!
Data points to consider: No high-impacting news events scheduled on the docket today.

Levels to watch/live orders:
- Buys: Flat (stop loss: N/A).
- Sells: Flat (stop loss: N/A).
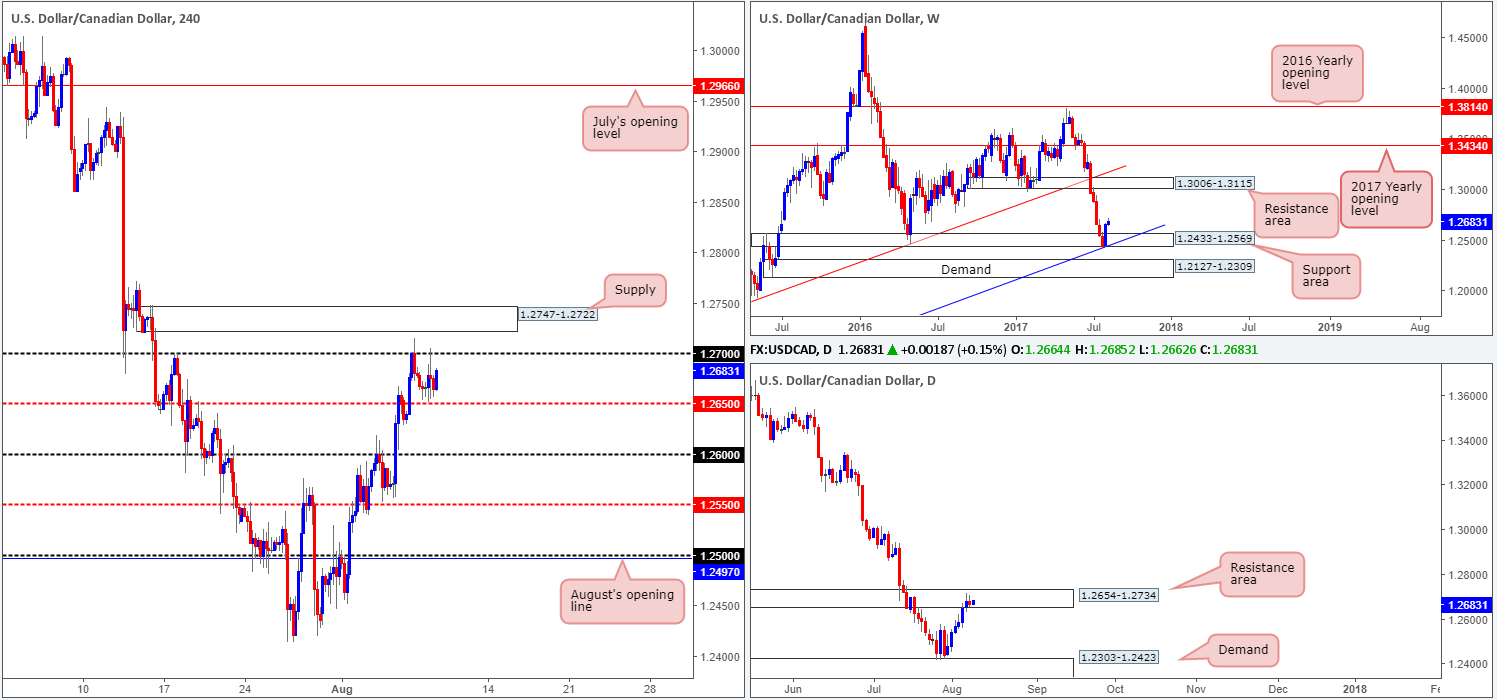
USD/CAD:
Near term, H4 price is seen trading from a somewhat neutral standpoint amid the 1.27 handle and the mid-level support band at 1.2650. Loitering directly above 1.27 is a strong-looking supply area coming in at 1.2747-1.2722, whereas below 1.2650 the 1.26 handle is likely going to be the next hurdle in the firing range.
With daily price seen trading within the walls of a resistance area at 1.2654-1.2734, shorting this market would, on the face of it, likely be the better move. The H4 supply, in our opinion, would be a tasty zone to sell from since not only is located within the said daily resistance area, but also the stops placed above 1.27 would likely provide enough liquidity for the big boys to sell in to. There’s one cautionary point to consider here, however, and that is weekly price seen trading strongly from a support area at 1.2433-1.2569.
Our suggestions: To become buyers in this market, we would still prefer to see a clear break (close) above the current daily resistance area. Despite what the weekly timeframe suggests, buying into the current daily structure is a risk we’re just not willing to take here. We would, however, consider selling this market from the current H4 supply following a close back below 1.27, given the current trend and daily resistance area. A move below 1.27 from the H4 supply, for us, would confirm lower prices down to at least the 1.26 neighborhood.
Data points to consider: Crude oil inventories at 3.30pm GMT+1.
Levels to watch/live orders:
- Buys: Flat (stop loss: N/A).
- Sells: 1.2747-1.2722 ([tradable following a close below 1.27] stop loss: ideally beyond the H4 candle’s wick).
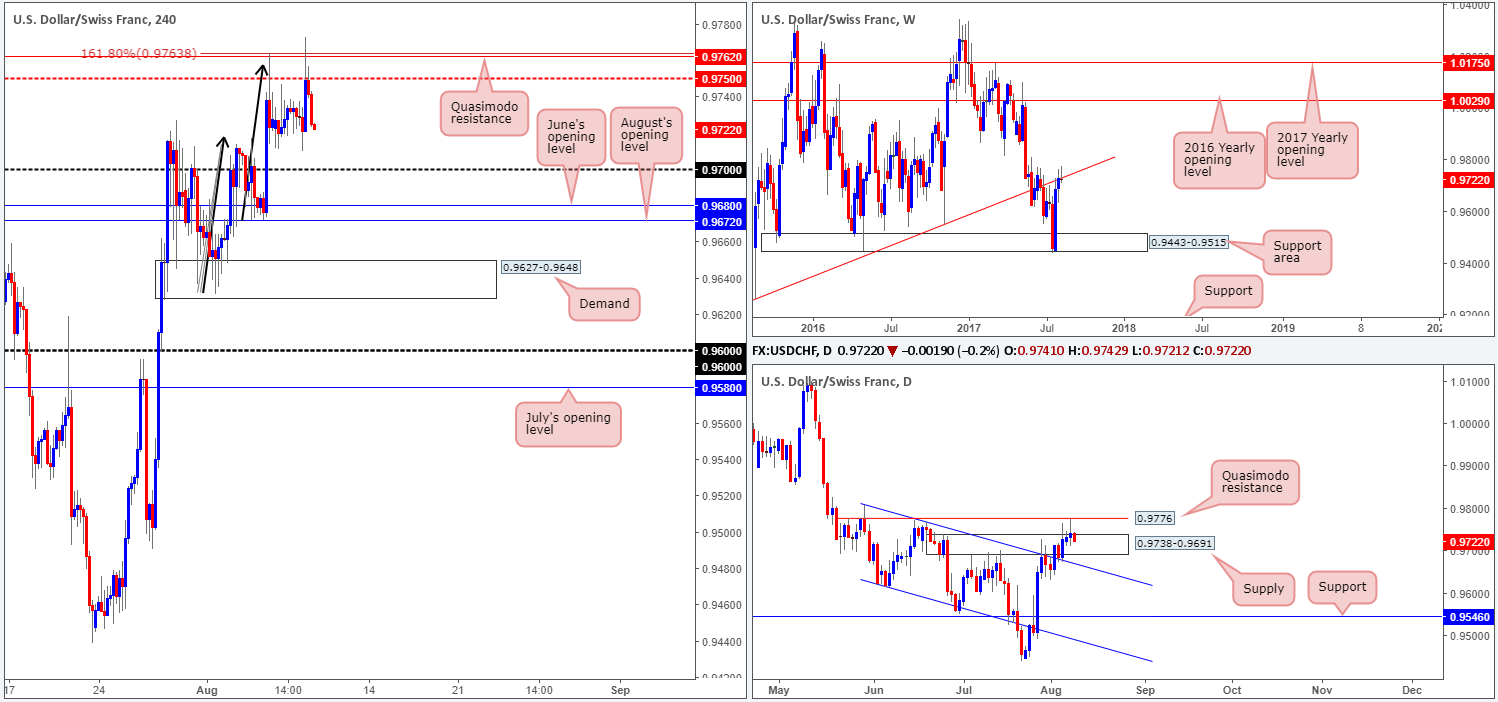
USD/CHF:
Overnight in the US session, the US dollar rallied to a high of 0.9772 fueled by an upbeat US JOLTS report. However, it was not long after this did we see the bears make an appearance. Technically speaking, the move lower should have not really come as much of a surprise. On the H4 chart, we were dealing with a Quasimodo resistance level at 0.9762 and also an AB=CD (black arrows) 161.8% Fib ext. at 0.9763. Also noteworthy is weekly price trading from a major weekly trendline resistance extended from the low 0.9257, and the recent near-touch of a daily Quasimodo resistance at 0.9776 that has sent price back into the walls of a daily supply at 0.9738-0.9691.
Our suggestions: To our way of seeing things, H4 action is likely going to continue pressing lower today until we reach the 0.97 handle. As of current price, we do not see any logical setup to take advantage of this move unless the unit retests the 0.9763/0.9750 region before challenging 0.97.
Data points to consider: No high-impacting news events scheduled on the docket today.
Levels to watch/live orders:
- Buys: Flat (stop loss: N/A).
- Sells: 0.9763/0.9750 ([waiting for a H4 bearish candle to form, preferably either a full, or near-full-bodied candle, is advised] stop loss: ideally beyond the candle’s wick).
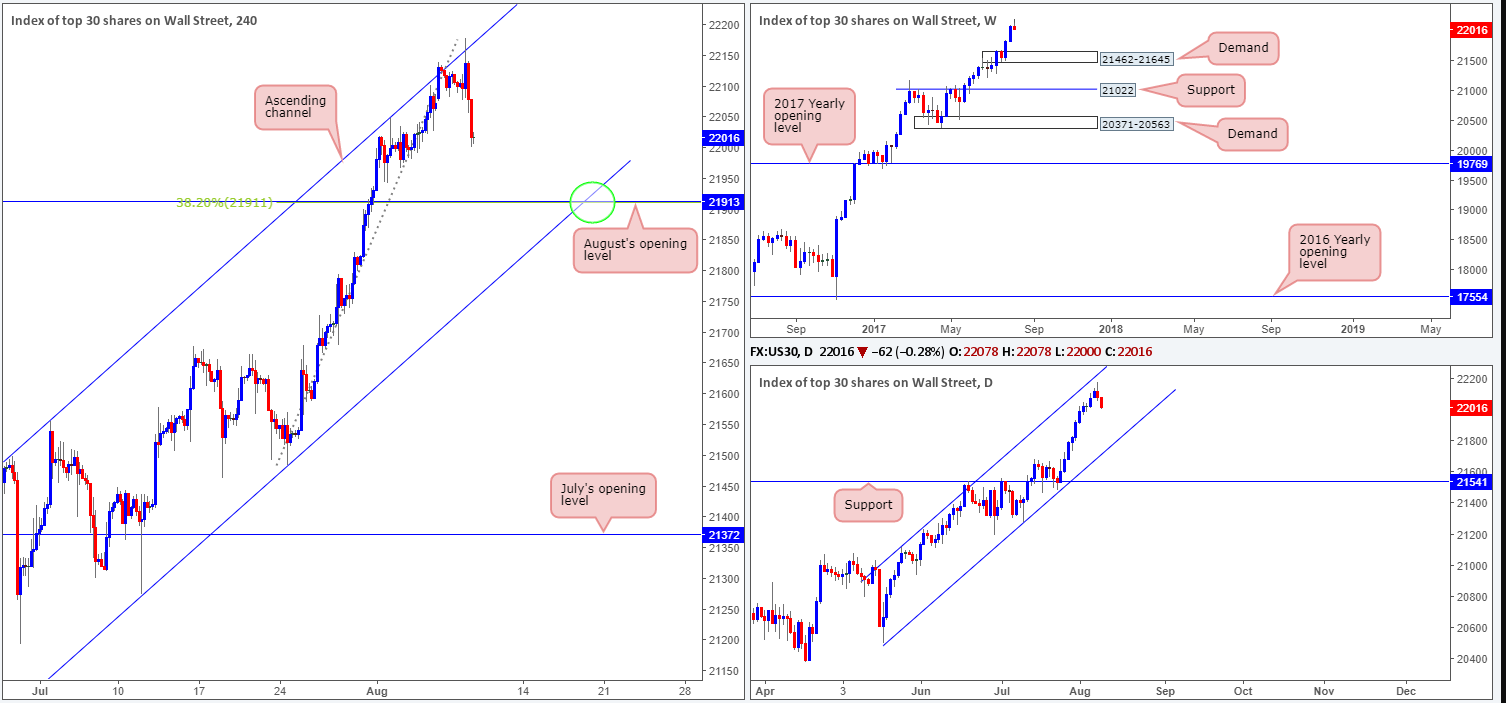
DOW 30:
During the early hours of yesterday’s US segment, H4 action once again challenged the ascending channel resistance drawn from a high of 21556. Currently, we do not see much in the way of support until August’s opening level at 21913, so further selling could be on the cards today. As 21913 fuses almost perfectly with a H4 38.2% Fib support at 21911 (taken from the low 21484), we feel a bounce from this neighborhood could be seen.
Our suggestions: With this market currently entrenched within an incredibly strong uptrend which shows little sign of decelerating, a buy from the 21913 vicinity is of interest to our desk.
Just to be clear though, we would only consider a buy if one of the following two things happened:
- H4 price tests 21913 once the market is in line with the neighboring channel support extended from the low 21273 (green circle).
- The unit chalks up a H4 AB=CD approach.
To avoid any fakeout through 21913, nonetheless, we would also strongly recommend waiting for H4 price to chalk up a bullish candle in the shape of a full, or near-full-bodied candle. This, of course, will not guarantee a winning trade, but what it will do is show buyer intent from a high-probability buy zone.
Data points to consider: No high-impacting news events scheduled on the docket today.
Levels to watch/live orders:
- Buys: 21913 region ([waiting for a H4 bullish candle to form, preferably either a full, or near-full-bodied candle, is advised] stop loss: ideally beyond the candle’s tail).
- Sells: Flat (stop loss: N/A).
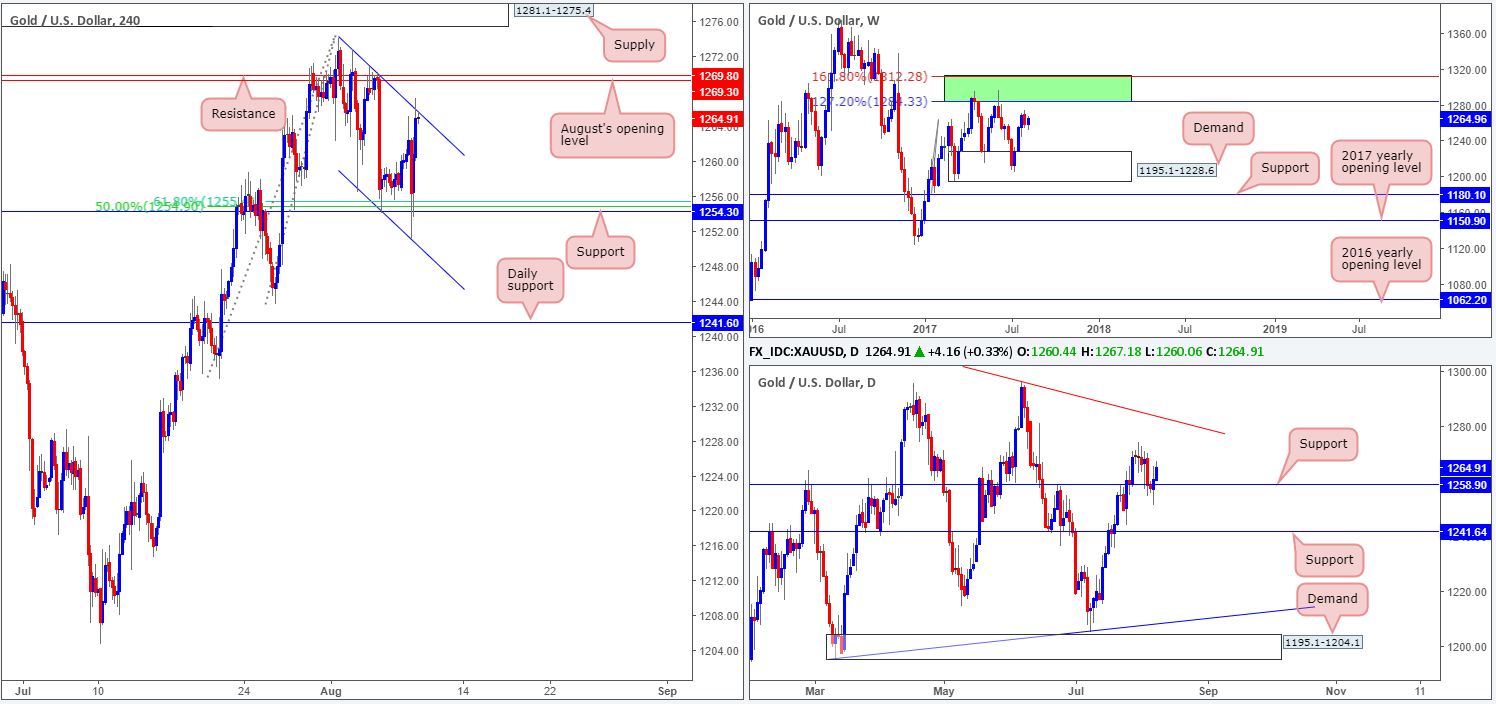
GOLD:
As can be seen from looking at the H4 chart this morning, price remains trading within a descending channel (1274.1/1256.5). The support at 1254.3, which unties with a 61.8% Fib support at 1255.3 drawn from the low 1243.6 and a 50.0% support value at 1254.9 extended from the low 1235.1, along with daily support at 1258.9, likely helped lift the metal north yesterday.
With the H4 candles now seen testing the upper edge of the current descending channel, is shorting this unit the way to go? Personally, we don’t have a lot of faith in the sell side of this market right now, mainly due to August’s opening level sited just above current price at 1269.8 (as well as a H4 resistance at 1269.3), and the fact that weekly price shows room for the metal to extend up to the green weekly resistance zone comprised of two Fibonacci extensions 161.8/127.2% at 1312.2/1284.3 taken from the low 1188.1.
Our suggestions: Unfortunately, neither a long nor short seems attractive at the moment. Selling is not an option for us given the reasons stated above, and buying into the H4 channel resistance line and nearby H4 resistances (even though we believe they will eventually give way) is not something our team would feel comfortable participating in.
Levels to watch/live orders:
- Buys: Flat (stop loss: N/A).
- Sells: Flat (stop loss: N/A).


