
A note on lower timeframe confirming price action…
Waiting for lower timeframe confirmation is our main tool to confirm strength within higher timeframe zones, and has really been the key to our trading success. It takes a little time to understand the subtle nuances, however, as each trade is never the same, but once you master the rhythm so to speak, you will be saved from countless unnecessary losing trades. The following is a list of what we look for:
- A break/retest of supply or demand dependent on which way you’re trading.
- A trendline break/retest.
- Buying/selling tails – essentially we look for a cluster of very obvious spikes off of lower timeframe support and resistance levels within the higher timeframe zone.
- Candlestick patterns. We tend to only stick with pin bars and engulfing bars as these have proven to be the most effective.
EUR/USD:
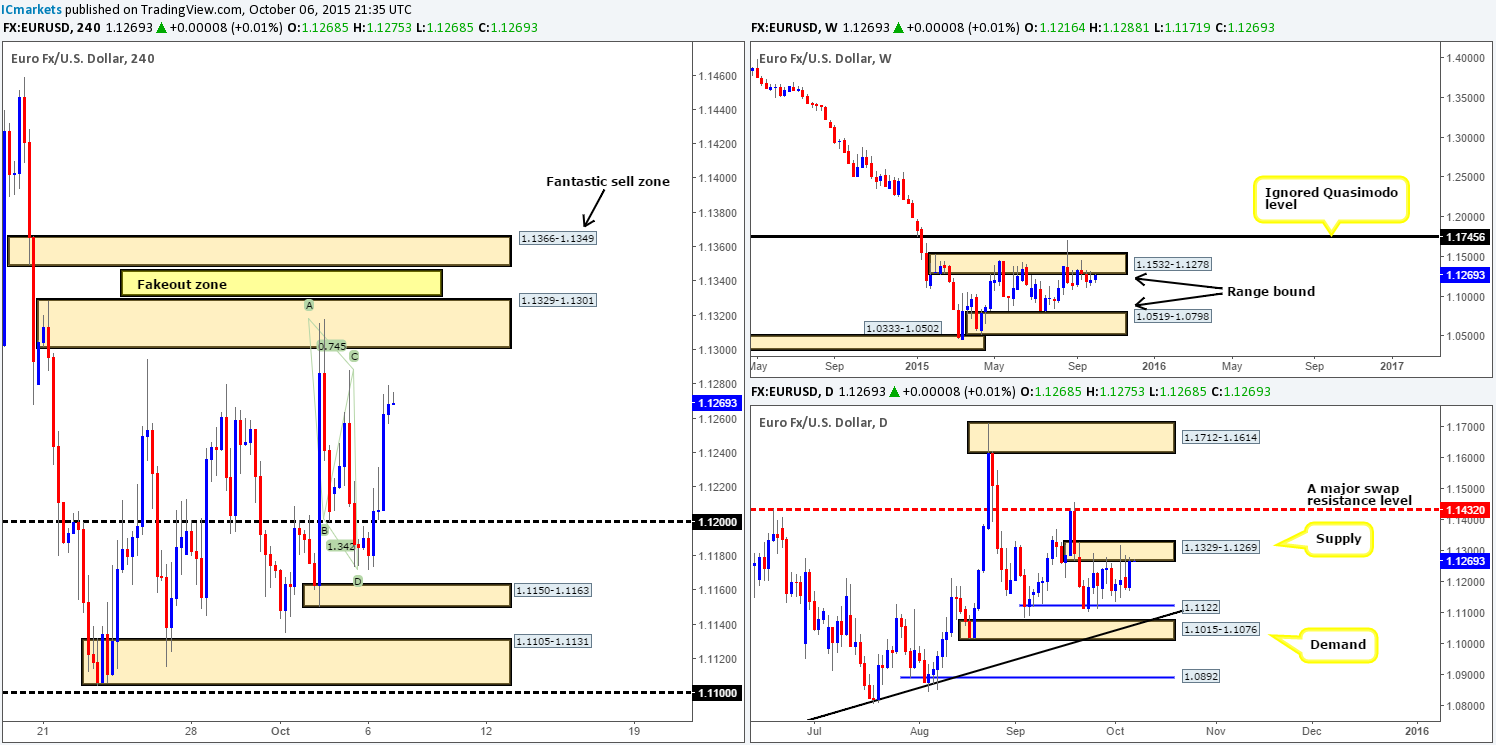
Well, we did not expect price to react so beautifully to the AB=CD bullish pattern at 1.1171 yesterday! In fact, we were not expecting it to trade above 1.1200, yet, the EUR rallied a little over 100 pips reaching highs of 1.1279 on the day.
Consequent to the above, daily supply at 1.1329-1.1269 is once again seeing some action, as is the weekly supply drawn from 1.1532-1.1278. Looking to the 4hr chart, however, we do not see any noteworthy resistances yet in play until supply at 1.1329-1.1301. With that, our team believes that price could potentially continue to advance today until reaching the above said supply zone.
Therefore, assuming that our analysis is correct and the EUR does indeed continue to advance, would we deem this 4hr supply zone a stable platform in which to look for shorts? This is certainly a viable base to sell from judging by the stern reaction seen previously on the 02/10/15 at 1.1381. However, traders need to be careful here. The previous touch could be the every reason why this area may fail, since a ton of offers/supply was likely consumed, thus potentially adding fuel to fake higher to supply sitting just above at 1.1366-1.1349.
As a matter of a fact, barring any news spikes, we have so much more confidence that the 1.1366-1.1349 area above will be the more higher-probability zone to trade from. We have placed a pending sell order at 1.13465 with a stop set above at 1.13717.
Levels to watch/live orders:
- Buys: Flat (Stop loss: N/A).
- Sells: 1.13465 (Stop loss: 1.13717).
GBP/USD:
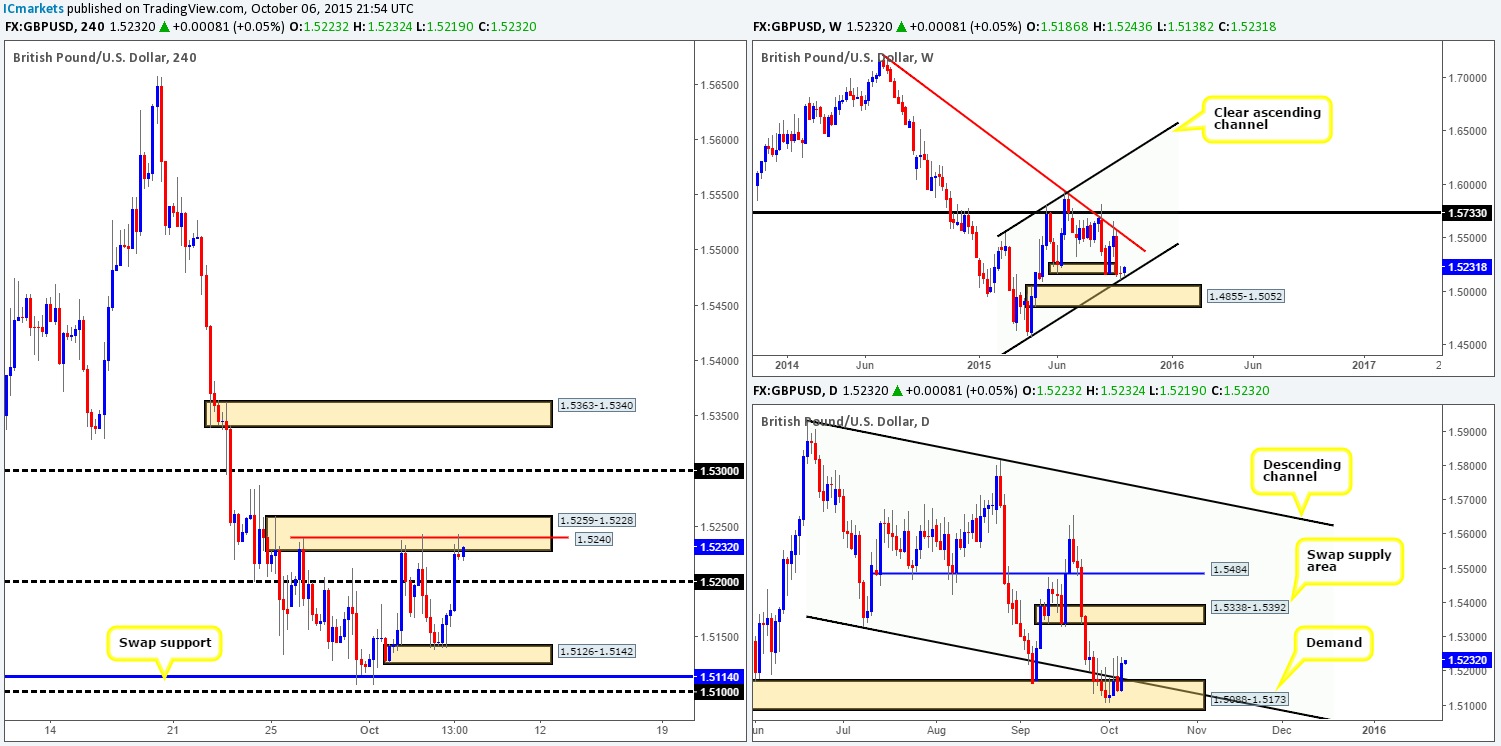
For those who read our previous report on Cable: http://www.icmarkets.com/blog/tuesday-6th-october-daily-technical-outlook-and-review/, you may recall us mentioning to keep an eye out for possible (confirmed) buys at demand formed from Friday’s NFP at 1.5126-1.5142. As shown on the chart, the market rallied a very cool 100 pips off the back of this zone, consequently surpassing psychological resistance 1.5200 and once again crossing swords with supply at 1.5259-1.5228.
In view of price currently trading at a well-respected supply zone right now, where does our team stand in the bigger picture? Up on the weekly timeframe, we can see that trade reacted splendidly from channel support (1.4564), while down on the daily timeframe price closed above the underside of a channel support-turned resistance (1.5329). This, at least in our book, suggests that selling from the 4hr supply zone mentioned above might not be the way to go today as the most we see price declining to from here is the 1.5200 figure.
That being the case, today’s spotlight will firmly be focused on 1.5240. Should a convincing close be seen above this barrier, this will, in effect, be our cue to begin watching for price to retest this level and look for confirmed longs into this market, targeting 1.5300 and possibly supply at 1.5363-1.5340.
Levels to watch/ live orders:
- Buys: Watch for offers at 1.5240 to be consumed and then look to enter on any retest seen at this number (confirmation required).
- Sells: Flat (Stop loss: N/A).
AUD/USD:
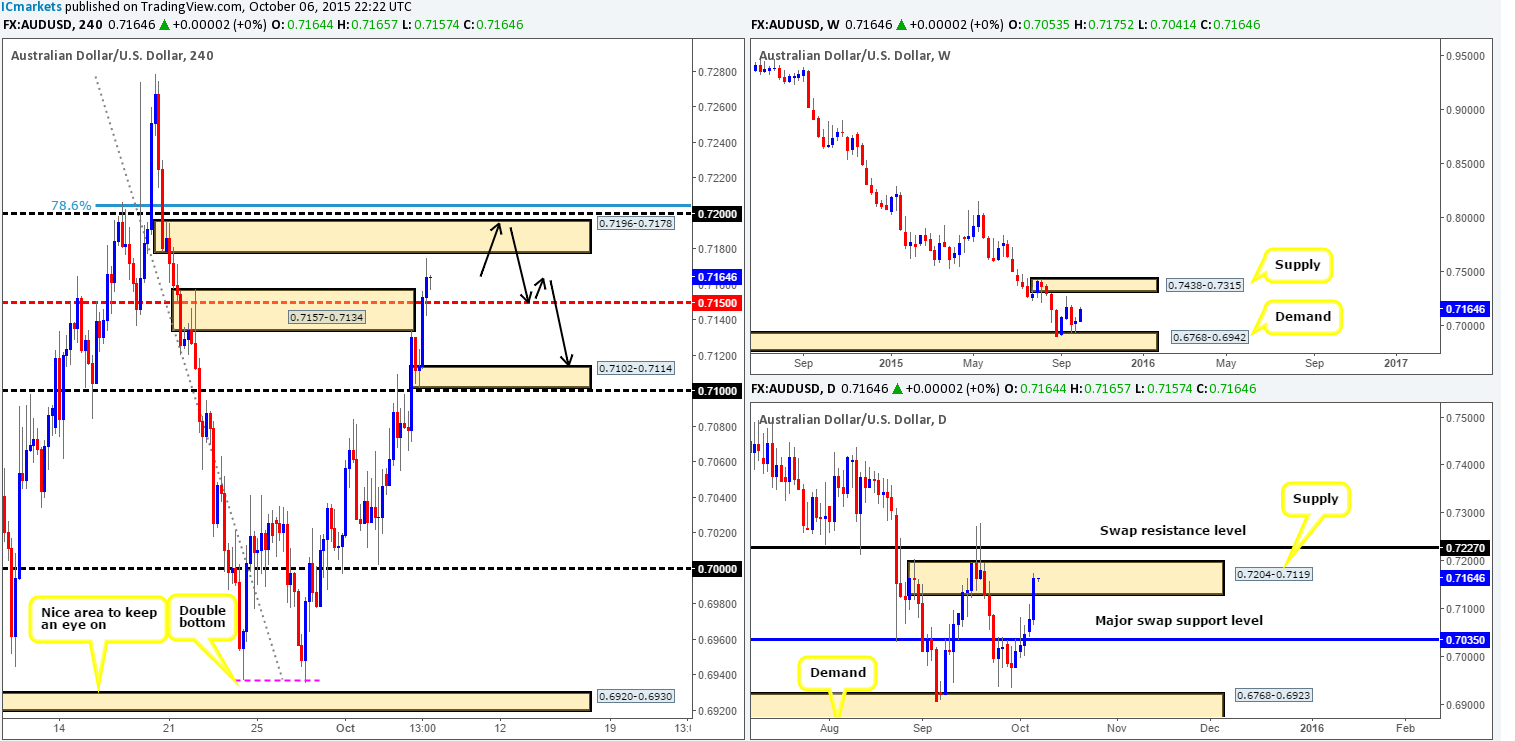
Following on from Tuesday’s report: http://www.icmarkets.com/blog/tuesday-6th-october-daily-technical-outlook-and-review/, we can see that price did indeed close above psychological resistance 0.7100 and came very close to retesting it as support, before breaking above mid-level resistance 0.7150 and reaching highs of 0.7175 on the day. Unfortunately, we could not pin-point an entry at the 0.7100 handle so we missed this move altogether! Well done to any of our readers who managed to lock in some green pips here!
Due to price now trading mid-way between a small supply at 0.7196-0.7178 and mid-level support 0.7150, where do we see this market headed today? Well, we see the above said supply zone holding price lower and potentially pushing this market down to demand taken from 0.7102-0.7114 due to the following reasons:
- Positioned within daily supply at 0.7204-0.7119.
- The 4hr supply itself is fresh.
- Psychological resistance looming just above at 0.7200.
- 78.6% deep Fibonacci resistance level at 0.7204.
- However, before we go placing pending orders below this zone, traders should be prepared to see a small fake higher to connect with 0.7200 before any decline in value is seen. This is the reason why we have opted to actually not place orders at this area and only trade here should lower timeframe confirmation be present!
Levels to watch/ live orders:
- Buys: Flat (Stop loss: N/A).
- Sells: 0.7196-0.7178 [Tentative – confirmation required] (Stop loss: dependent on where one confirms this area).
USD/JPY:
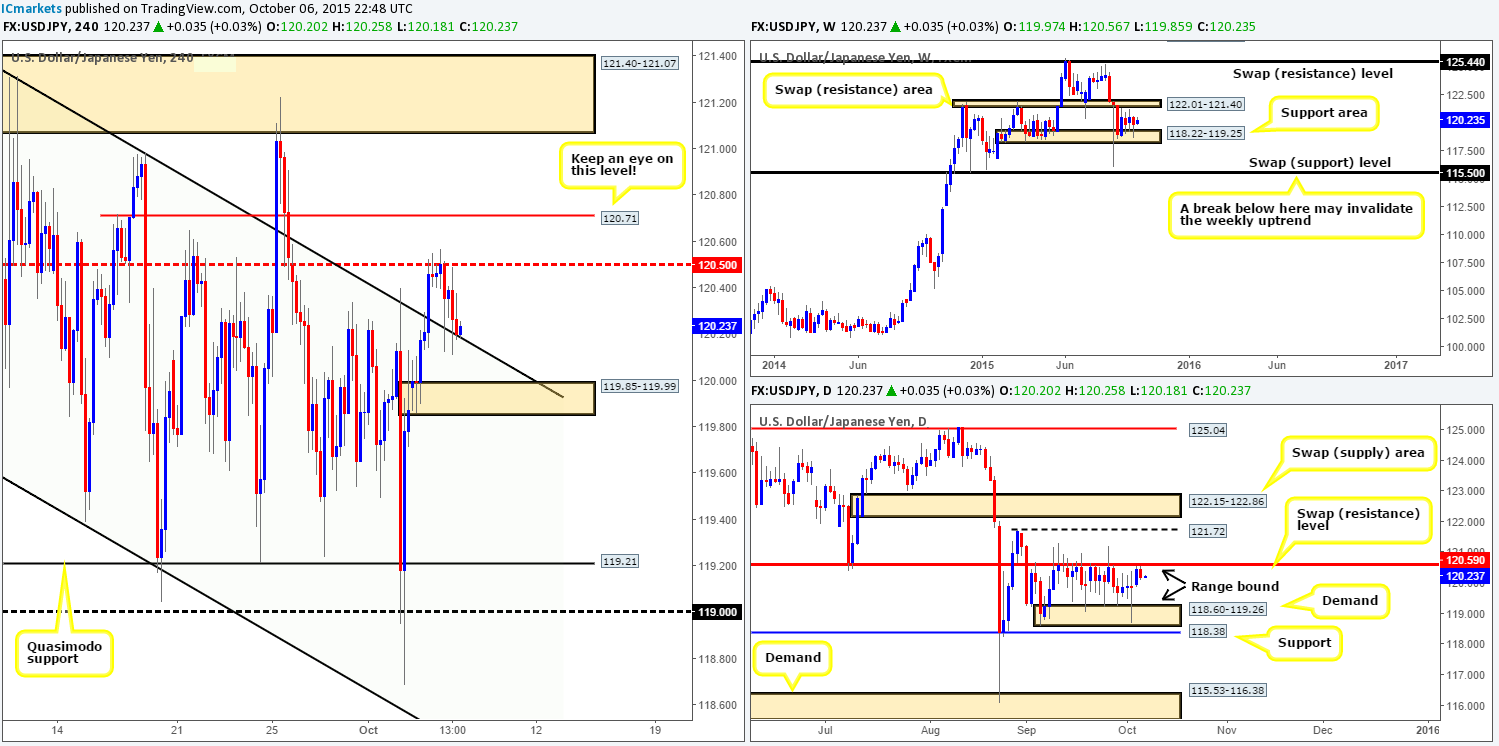
The USD/JPY pair, as you can see, rebounded wonderfully from the mid-level resistance 120.50, and as a result sent prices down to retest the top-side of the recently broken channel resistance-turned support (121.31). We do hope some of our readers managed to lock in some profit from this move as it has been a noted level to watch for the past few days.
Although this market is currently trading around a potential support structure right now, we would not feel comfortable buying here. Not only has price just recently bounced from a daily swap (resistance) level at 120.59 (upper range limit), there is also very little in the way of defined support backing a bounce on the weekly timeframe – price is currently mid-range! Even the 4hr demand seen below current price at 119.85-119.99 is not considered a valid buy zone in our opinion. Sure, it may bounce price, but a full-out reversal from here is doubtful. Right now, the only levels we’d consider buying/selling from are as follows:
Buys:
- The 4hr Quasimodo support level at 119.21. This barrier lines up perfectly with not only daily demand at 118.60-119.26 (lower range limit), but also with a weekly support area at 118.22-119.25.
Sells:
- Although 120.50 has already seen action, we’d still consider this a valid level since it ties in beautifully with the upper limit of the daily range, 120.59.
- 120.71. This level is practically a hidden left shoulder. Since these levels usually see a bounce and considering the fact that it sits just above the daily 120.59 level, we think it deserves its place on this list.
Levels to watch/ live orders:
- Buys: 119.21 [Tentative – confirmation required] (Stop loss: dependent on where one confirms this level).
- Sells: 120.50 [Tentative – confirmation required] (Stop loss: dependent on where one confirms this level) 120.71 [Tentative – confirmation required] (Stop loss: dependent on where one confirms this level).
USD/CAD:
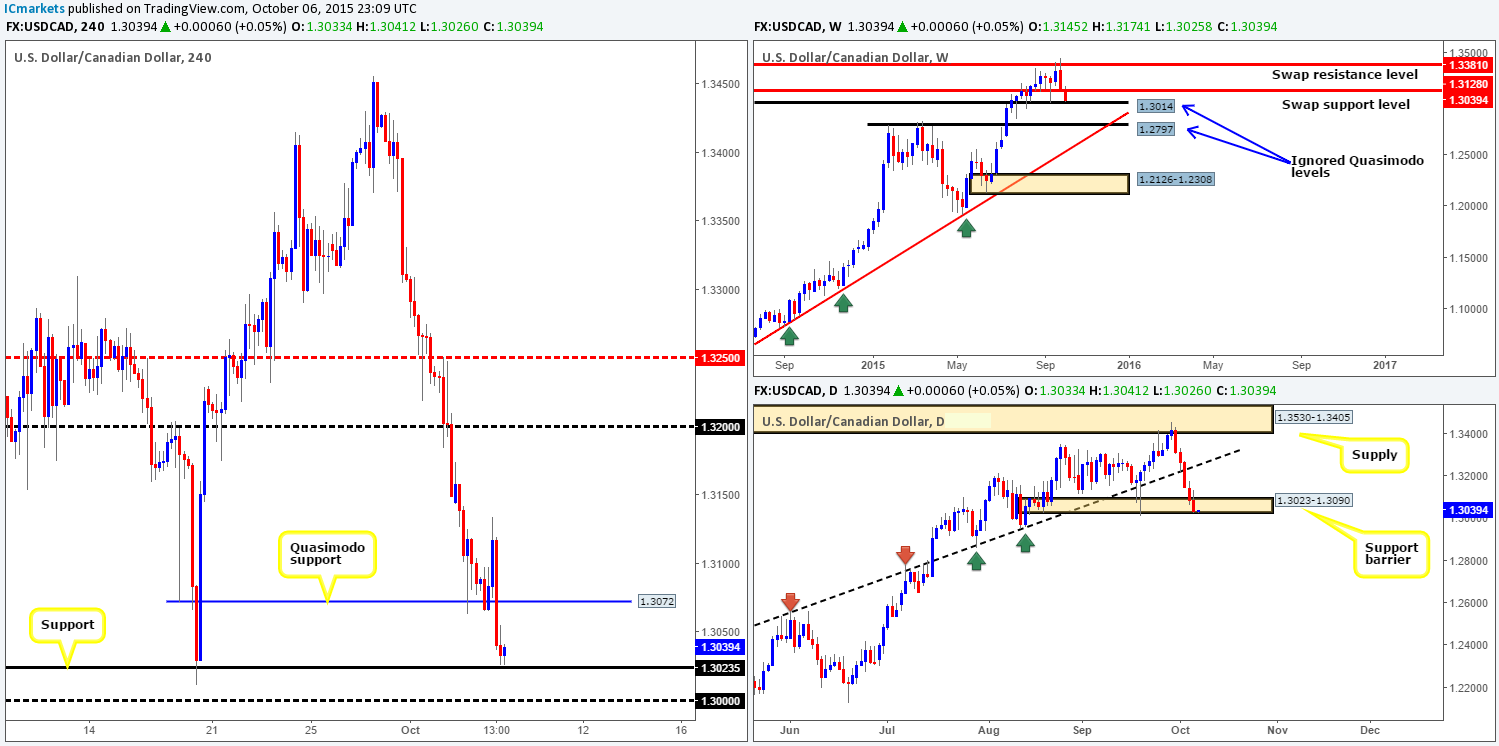
Although this pair did indeed find some active bids residing at the Quasimodo support level 1.3072 during trade yesterday, the market eventually continued on its way south down to just above support at 1.3023.
In that price is now trading from support on the 4hr timeframe, a certain harmony is being seen in this market at the moment. All three of the timeframes we follow show price at supportive structures. Weekly action is currently kissing the top-side of an ignored Quasimodo level at 1.3014, whereas, the daily chart shows the buyers and sellers battling for position deep within a support area coming in at 1.3023-1.3090.
Therefore, our objective today is simple. Watch for lower timeframe buying confirmation around 4hr support at 1.3023, targeting 1.3072 first and foremost. Despite having pretty cool higher timeframe confluence here, we still require lower timeframe confirming price action to buy this market. The reason for why comes from the large psychological support 1.3000. This could act as a magnet to price and see 1.3023 breached, so do trade cautiously here guys!
Levels to watch/ live orders:
- Buys: 1.3023 [Tentative – confirmation required since a fakeout here is possible] (Stop loss: dependent on where one confirms this level).
- Sells: Flat (Stop loss: N/A).
USD/CHF:
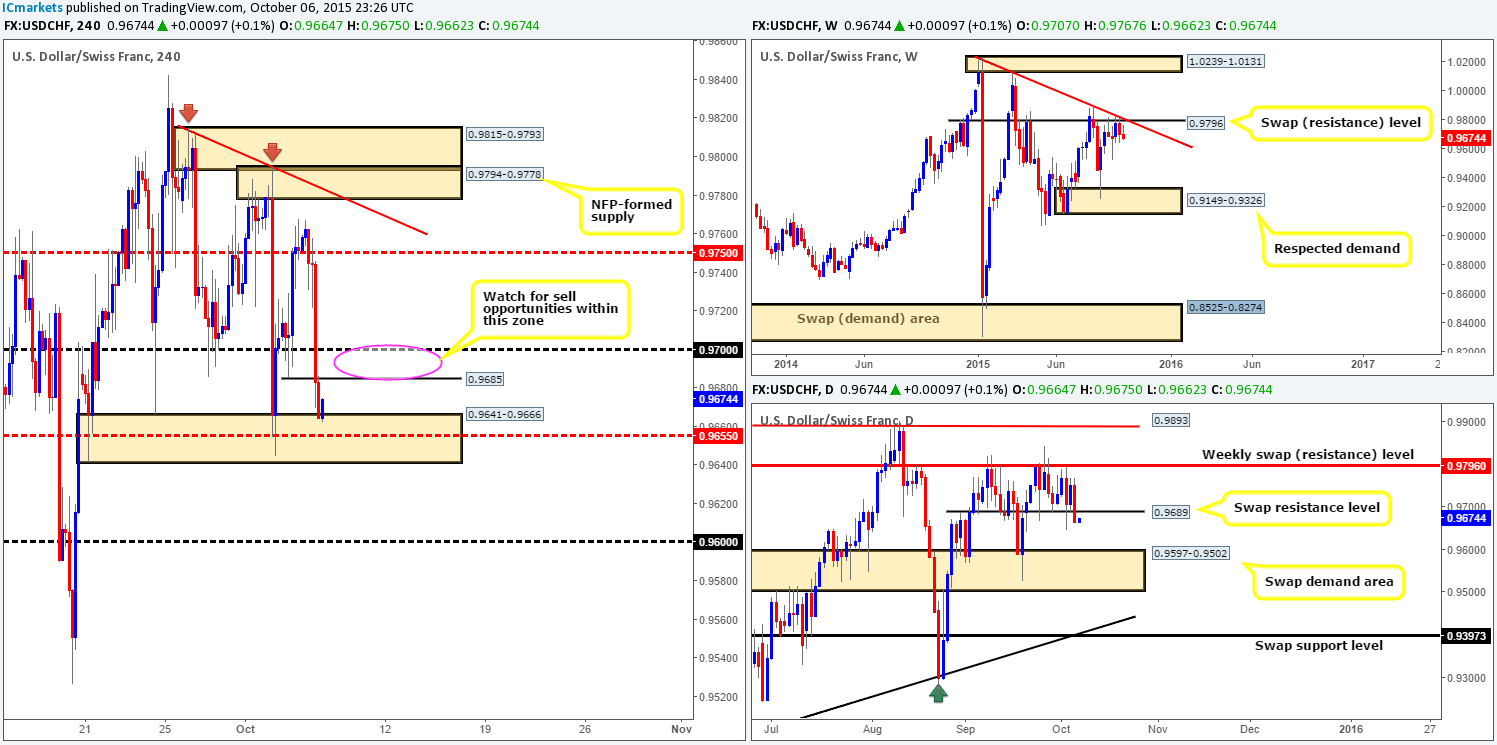
Working our way from the top this morning, the weekly chart shows the sellers continue to hold firm below the swap resistance level at 0.9796, with room seen to continue much lower. Meanwhile, on the daily scale, price recently closed below the swap support level at 0.9689, and likely cleared the path for further downside towards a swap demand area drawn from 0.9597-0.9502.
As bearish as both the weekly and daily timeframes appear at the moment, the 4hr chart shows price trading from demand at 0.9641-0.9666 thanks to yesterday’s 100-pip decline in value. However, given the current higher timeframe structure, the most we see price rallying to from this demand is 0.9685/0.9700. In fact, we believe that this makes for a perfect sell zone considering that 0.9689 marks the aforementioned daily swap (resistance) level. Waiting for lower timeframe confirmation is highly recommended here though traders, simply because price may, as it does regularly, fake/spike above 0.9700 to collect stops before spiraling lower.
Levels to watch/ live orders:
- Buys: Flat (Stop loss: N/A).
- Sells: 0.9685/0.9700 [Tentative – confirmation required] (Stop loss: dependent on where one confirms this area).
DOW 30:
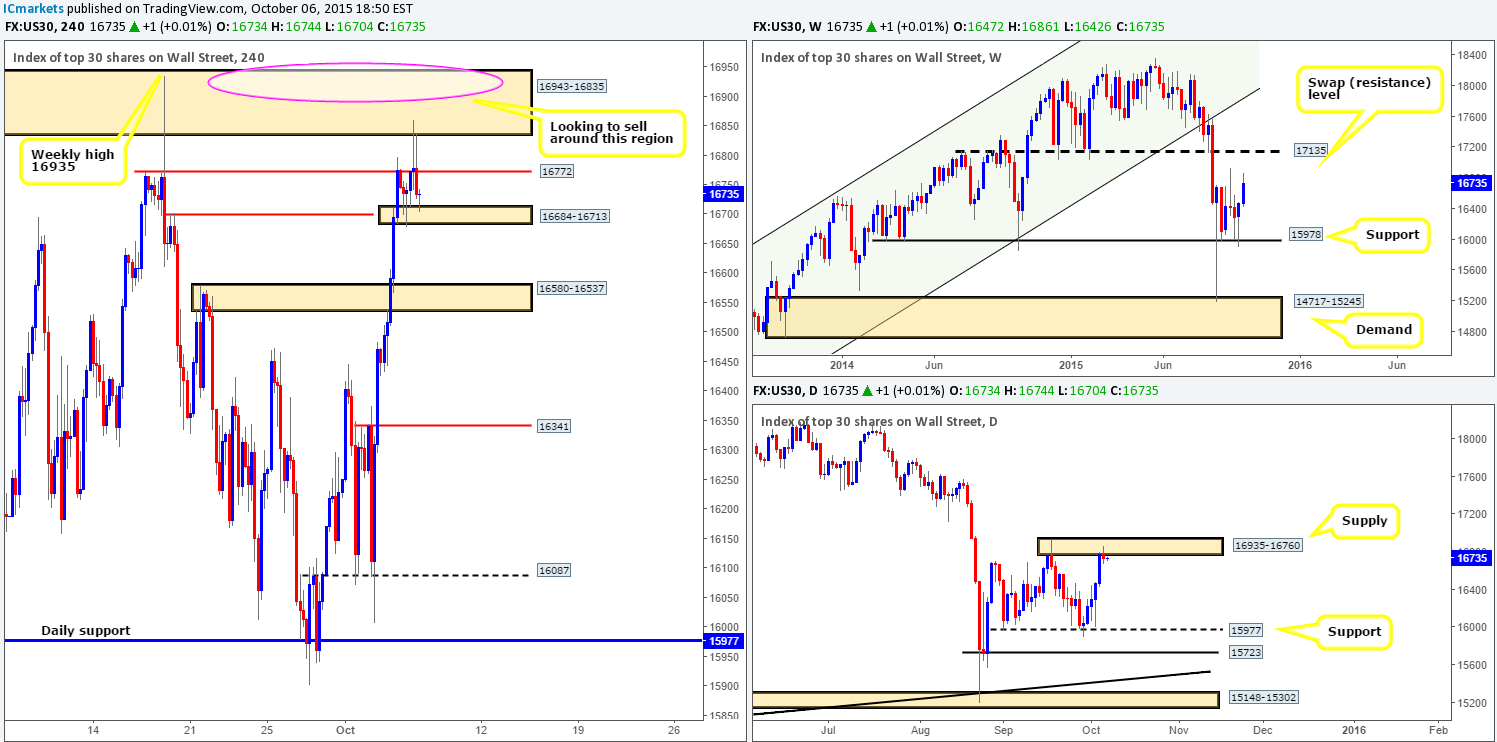
Recent action on the DOW shows that during the early hours of yesterday’s trade, price did indeed sell-off from the Quasimodo resistance at 16772 and shake hands with demand at 16684-16713. It was mid-way through the London session did we see this market fake above this Quasimodo resistance to connect with supply sitting at 16943-16835, which, as you can see, once again sent price back down to demand.
Ultimately, we were planning to short the above said supply zone, but we were aiming to get in higher within this area near the weekly high 16935 (the pink circle). Granted, we may have missed the first boat leaving this supply, we might, however, get a second chance to jump in the action later on if current demand holds firm. The reason we like the current supply area so much, other than the very obvious weekly high, is the fact that this zone sits within a clear daily supply area drawn from 16935-16760.
In the event that the current demand gives way, nonetheless, then there’s not much in the way of support until the swap demand area coming in at 16580-16537. On the condition that price retests the demand as supply following a break lower, we may, dependent on how the lower timeframes respond, take short in this market, targeting 16591.
Levels to watch/ live orders:
- Buys: Flat (Stop loss: N/A).
- Sells: 16943-16835, preferably near the weekly high16935 [Tentative – confirmation required] (Stop loss: dependent on where one confirms this area) Watch for bids at 16684-16713 to be consumed and then look to enter on any retest seen at this area (confirmation required).
XAU/USD: (Gold)
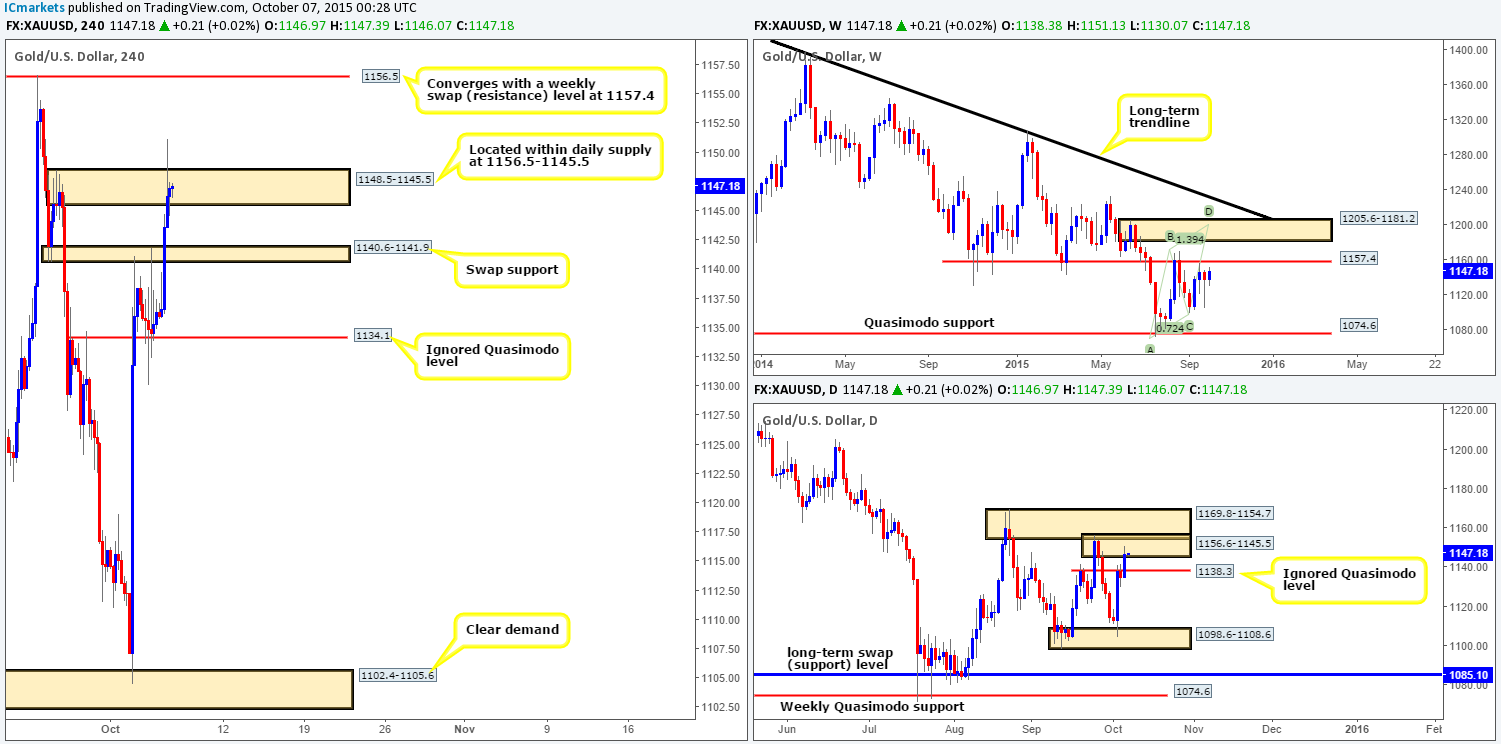
The rebound from the ignored Quasimodo level at 1134.1 saw Gold extend higher during the course of yesterday’s sessions, breaking through the swap resistance area at 1140.6-1141.9, and aggressively faking above supply at 1148.5-1145.5. As per our previous report (http://www.icmarkets.com/blog/tuesday-6th-october-daily-technical-outlook-and-review/), we were looking to short the current supply. Fortunately for us, however, price advanced too quickly for the lower timeframes to paint a tradable sell setup.
The spike above the current supply zone has likely consumed the majority of offers within this region, thus, in our opinion, price could potentially do one of two things today:
- Continue north targeting resistance drawn from 1156.5, which, as can be seen from the chart, also converges with a weekly swap (resistance) level at 1157.4. Should we see a definitive close above this zone today and a successful retest, there could be a potential long from here as long as lower timeframe buying confirmation is seen. Nevertheless, in buying this market here, you would effectively be entering long into daily supply at 1156.6-1145.5, hence the need for confirmation!
- A sell-off could take place from current prices using the liquidity (buy stops) just taken out to sell into back down to the recently broken swap resistance (now support) area at 1140.6-1141.9. Although price is currently residing within daily supply mentioned above, we still require lower timeframe confirmation to trade a move south, since the weekly level at 1157.4 may be where higher timeframe traders are targeting at the moment.
Levels to watch/ live orders:
- Buys: Watch for a close above 1148.5-1145.5 and then look to enter on any retest seen at this number (confirmation required)
- Sells: 1148.5-1145.5 [Tentative – confirmation required] (Stop loss: dependent on where one confirms this area).


