
Key risk events today:
EU Economic Forecasts; US ADP Non-Farm Employment Change.
(Previous analysis as well as outside sources – italics).
EUR/USD:
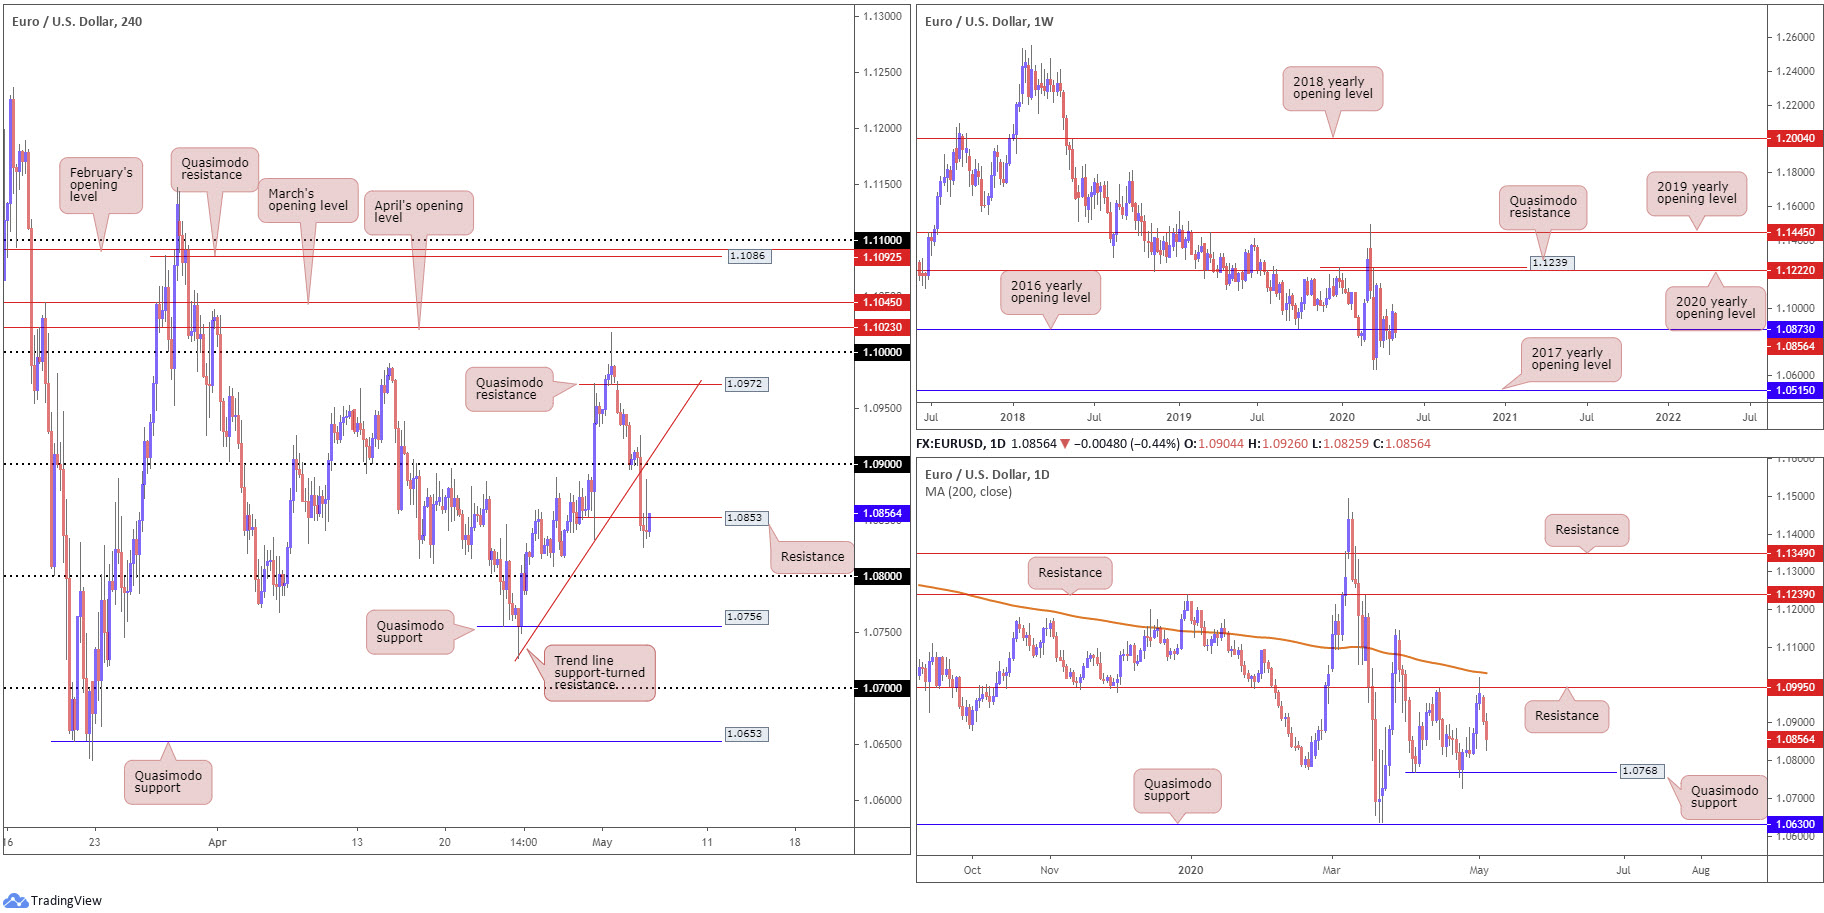
EUR/USD found itself under significant pressure Tuesday following the German Constitutional Court’s ruling on the ECB purchase programme. 1.09 ceded ground on the H4 timeframe, as did trend line support, taken from the low 1.0727, and eventually a Quasimodo support at 1.0853. The aforementioned levels may now serve as resistance going forward, with 1.08 in the firing range as support.
Analysis on the higher timeframes has weekly price trading around its 2016 yearly opening level at 1.0873. This has been a level of interest on the weekly chart for a while now. The story on the daily timeframe reveals price action faded resistance at 1.0995 Friday and has since been starved of support, with Tuesday clocking lows at 1.0825 and highlighting possible support at a Quasimodo formation from 1.0768.
Areas of consideration:
1.0853 could hold ground today as resistance which may be enough to tempt sellers into the market for a run towards 1.08. This is further bolstered on the fact we have room to press for lower levels on the daily timeframe. However, weekly price could still make a stand off 1.0873.
1.08 as a support is open to whipsaws to H4 Quasimodo support at 1.0756 and daily Quasimodo support at 1.0768.
GBP/USD:
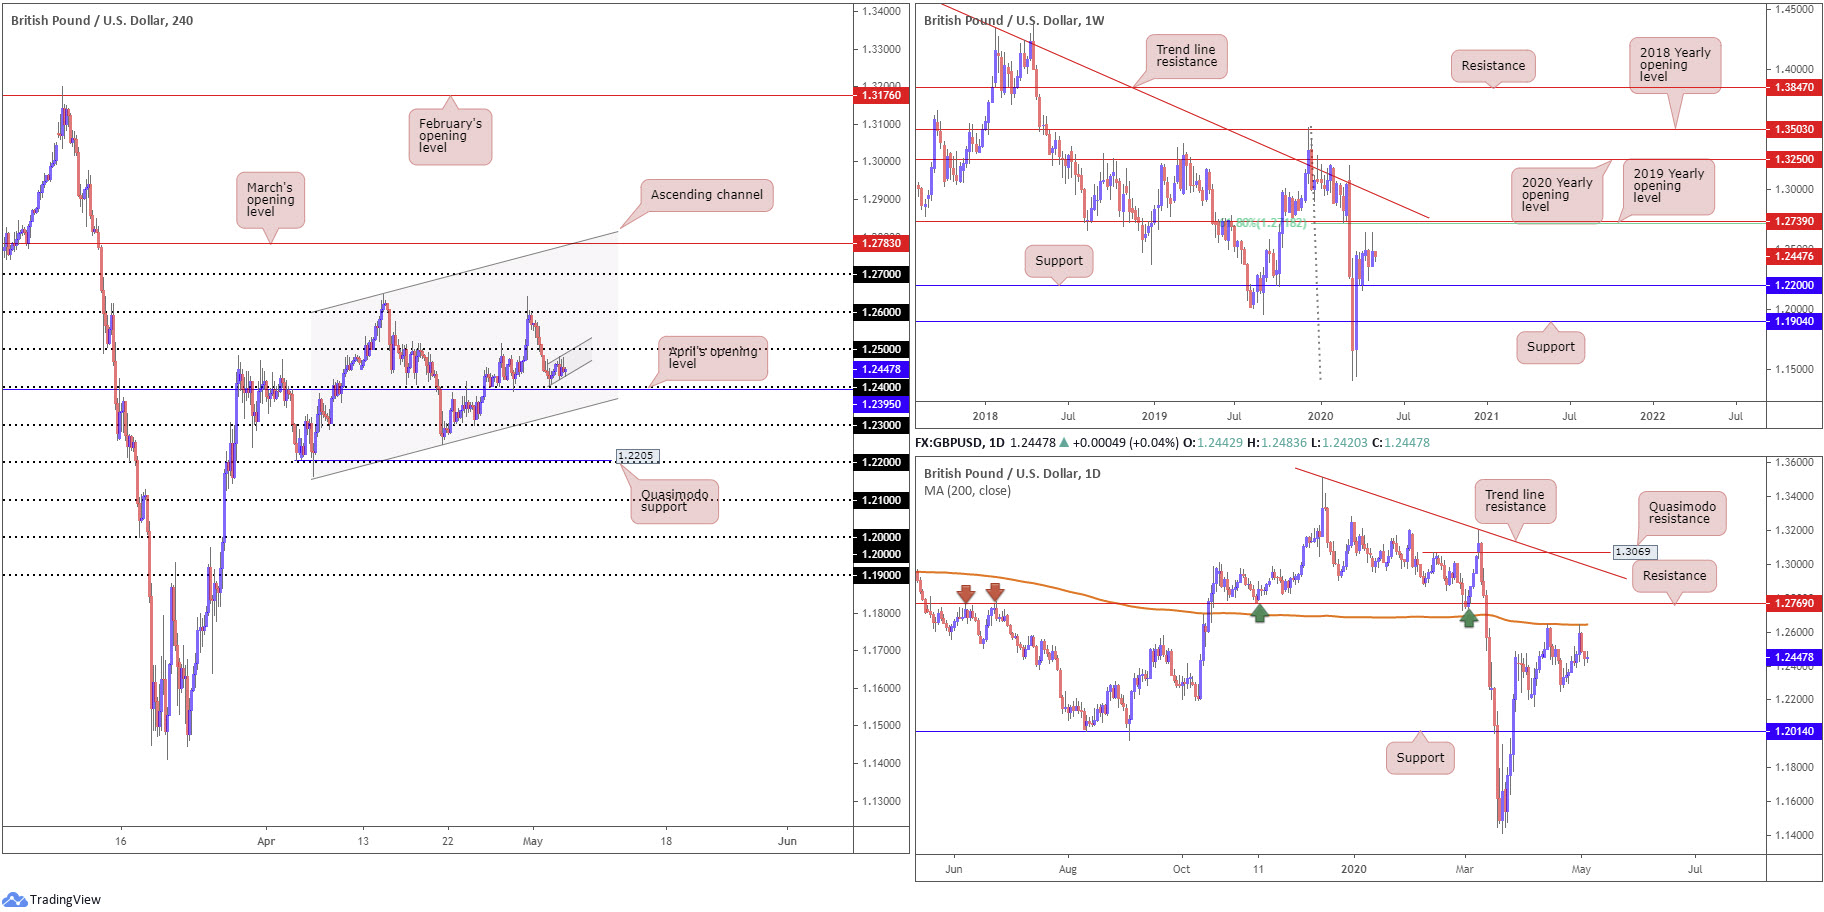
Sterling maintained a non-committal stance Tuesday, pretty much directionless around 1.2483/1.2420. As a result of this, much of the following points put forward in Tuesday’s analysis remain valid going forward.
The H4 candles put in a bottom ahead of 1.24 and April’s opening level at 1.2395. Sub 1.24 we can see channel support, extended from the low 1.2163, with a break highlighting 1.23 as potential support.
From the weekly timeframe, support at 1.2200 remains a pivotal base, holding price action higher since the beginning of April. Scope to explore higher ground is also visible until reaching the 2019 yearly opening level at 1.2739, which aligns closely with a 61.8% Fibonacci retracement ratio at 1.2718. A break of the aforementioned levels reveals a long-standing trend line resistance, taken from the high 1.5930. In addition to the above, we can also see the pair pulling back from historic lows at 1.1409, therefore sellers could eventually make a run for fresh lows. Note the primary trend remains facing south in this market.
The 200-day SMA (orange – 1.2644) remains a dominant fixture on the daily timeframe, providing resistance on two occasions in April. Friday, as evident from the chart, finished in the shape of a bearish inside day, snapping a two-day bullish phase and underlining the 1.2247 April 21 low as possible support. Directly north of the SMA value, traders may also want to acknowledge notable resistance coming in from 1.2769. Traders will also note Tuesday wrapped up in the form of a doji indecision candle.
Areas of consideration:
1.24 on the H4 timeframe may generate buyer interest, knowing it merges closely with April’s opening level at 1.2395. However, the possibility of a whipsaw being seen through the said round number to H4 channel support is certainly there, given the likelihood of sell-stops sited beneath 1.24.
1.25 also stands as possible resistance, though according to our chart studies we do not see much reinforcing the level.
In terms of chart patterns, the H4 timeframe may be in the process of chalking up a bearish flag between 1.2405/1.2475, which could be tradeable on a break below its lower boundary.
AUD/USD:
The Australian dollar gathered impetus on the back of a pick-up in risk sentiment Tuesday, boosted by the Reserve Bank of Australia leaving interest rates unchanged at 0.25% along with confirmation of no further easing by the central bank.
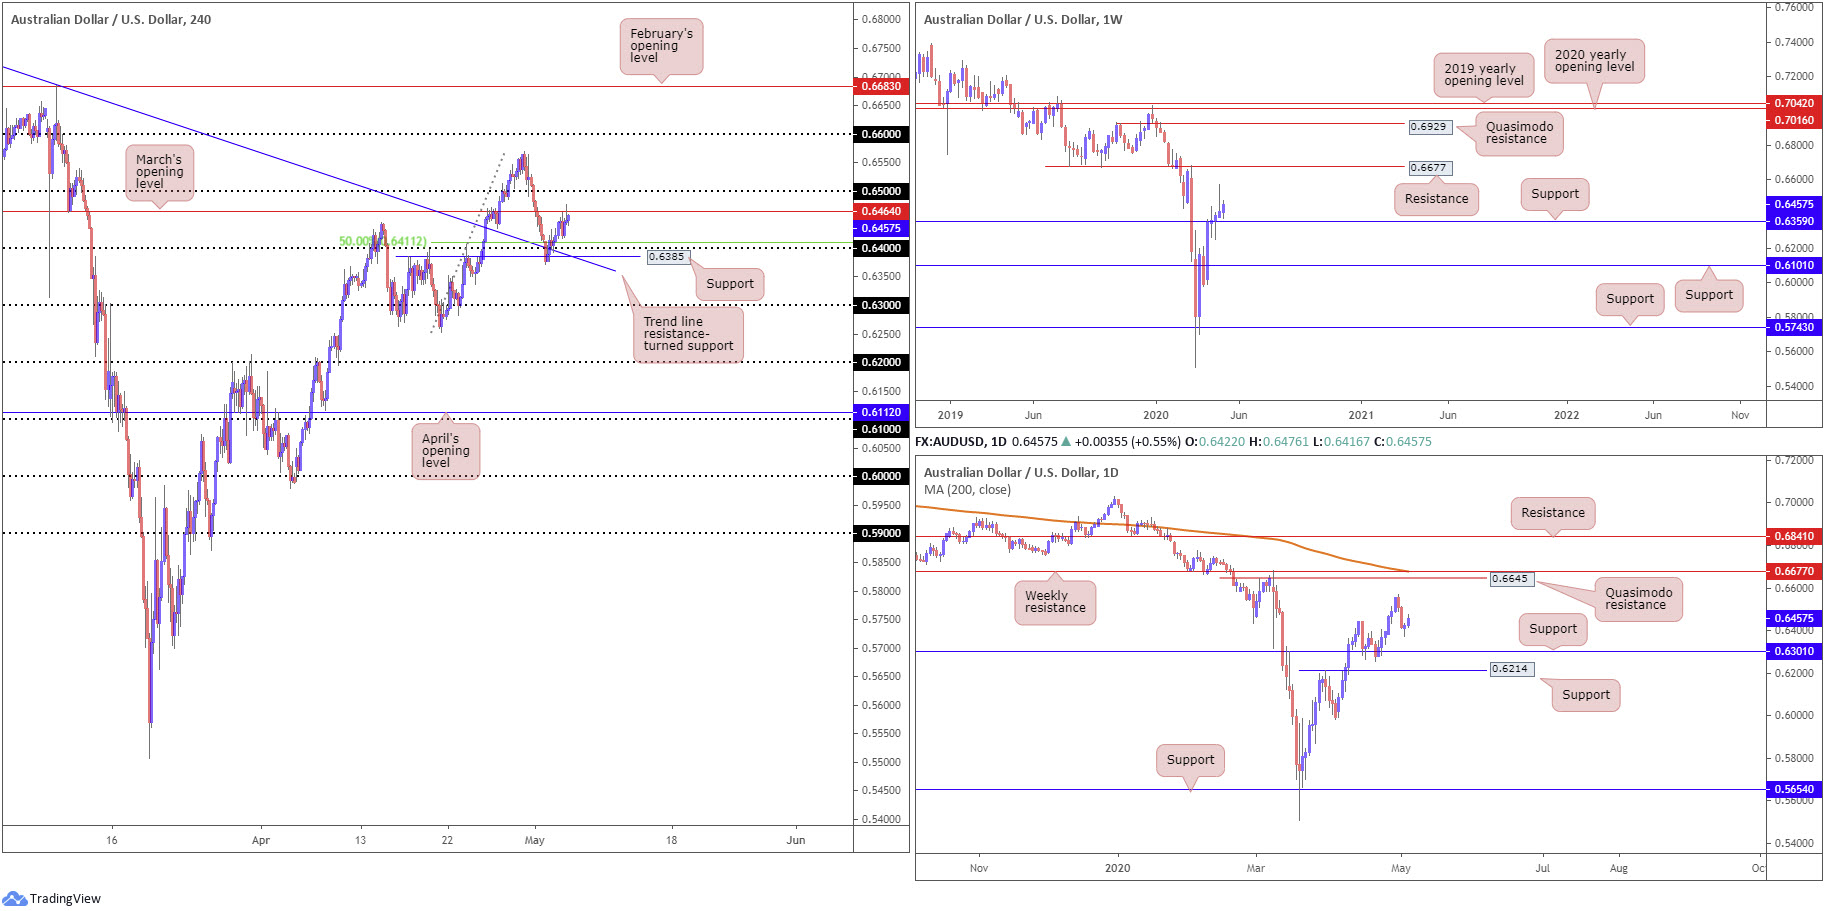
Monday ended by way of a hammer candlestick formation on the daily timeframe, tapping into liquidity around the 0.64 handle on the H4 timeframe. Recent analysis on the H4 timeframe noted:
Although a key figure by and of itself, 0.64 also comes together with a notable trend line resistance-turned support, taken from the high 0.7031, a Quasimodo resistance-turned support at 0.6385 and a 50.0% retracement value at 0.6411. Sub 0.64, limited support exists until crossing swords with the 0.63 handle, which also represents daily support at 0.6301.
As evident from the H4 chart, 0.64 remains in the mix, with resistance making an appearance by way of March’s opening level at 0.6464. A break of here will likely see the 0.65 handle attempt an offer of resistance.
The story on the weekly timeframe has price circling above support at 0.6359, following last week’s shooting star candlestick configuration. Although the candlestick signal is a mark of seller intent, price is likely to find difficulty attracting sellers this week due to noted support. With that being the case, pencilling in resistance at 0.6677 may be an idea in the event we pop higher.
From the daily timeframe, support at 0.6301 may eventually come under fire, with support at 0.6214 also perhaps entering the mix. With respect to resistance, aside from the April 30 high at 0.6569, a Quasimodo formation at 0.6645 is in sight, parked just ahead of the weekly resistance level mentioned above at 0.6677 and the 200-day SMA (orange – 0.6678).
Areas of consideration:
With 0.64 holding firm, buyers from this region have likely reduced risk to breakeven and maybe even banked partial profits upon contact with March’s opening level at 0.6464. 0.65 rests as the next upside target. However, do bear in mind the higher timeframes suggest scope to reach beyond 0.65, possibly reaching 0.6569 as a minimum. As a result of this, analysis indicates additional buying opportunity may exist north of 0.65 in the event we break this figure to the upside.
USD/JPY:
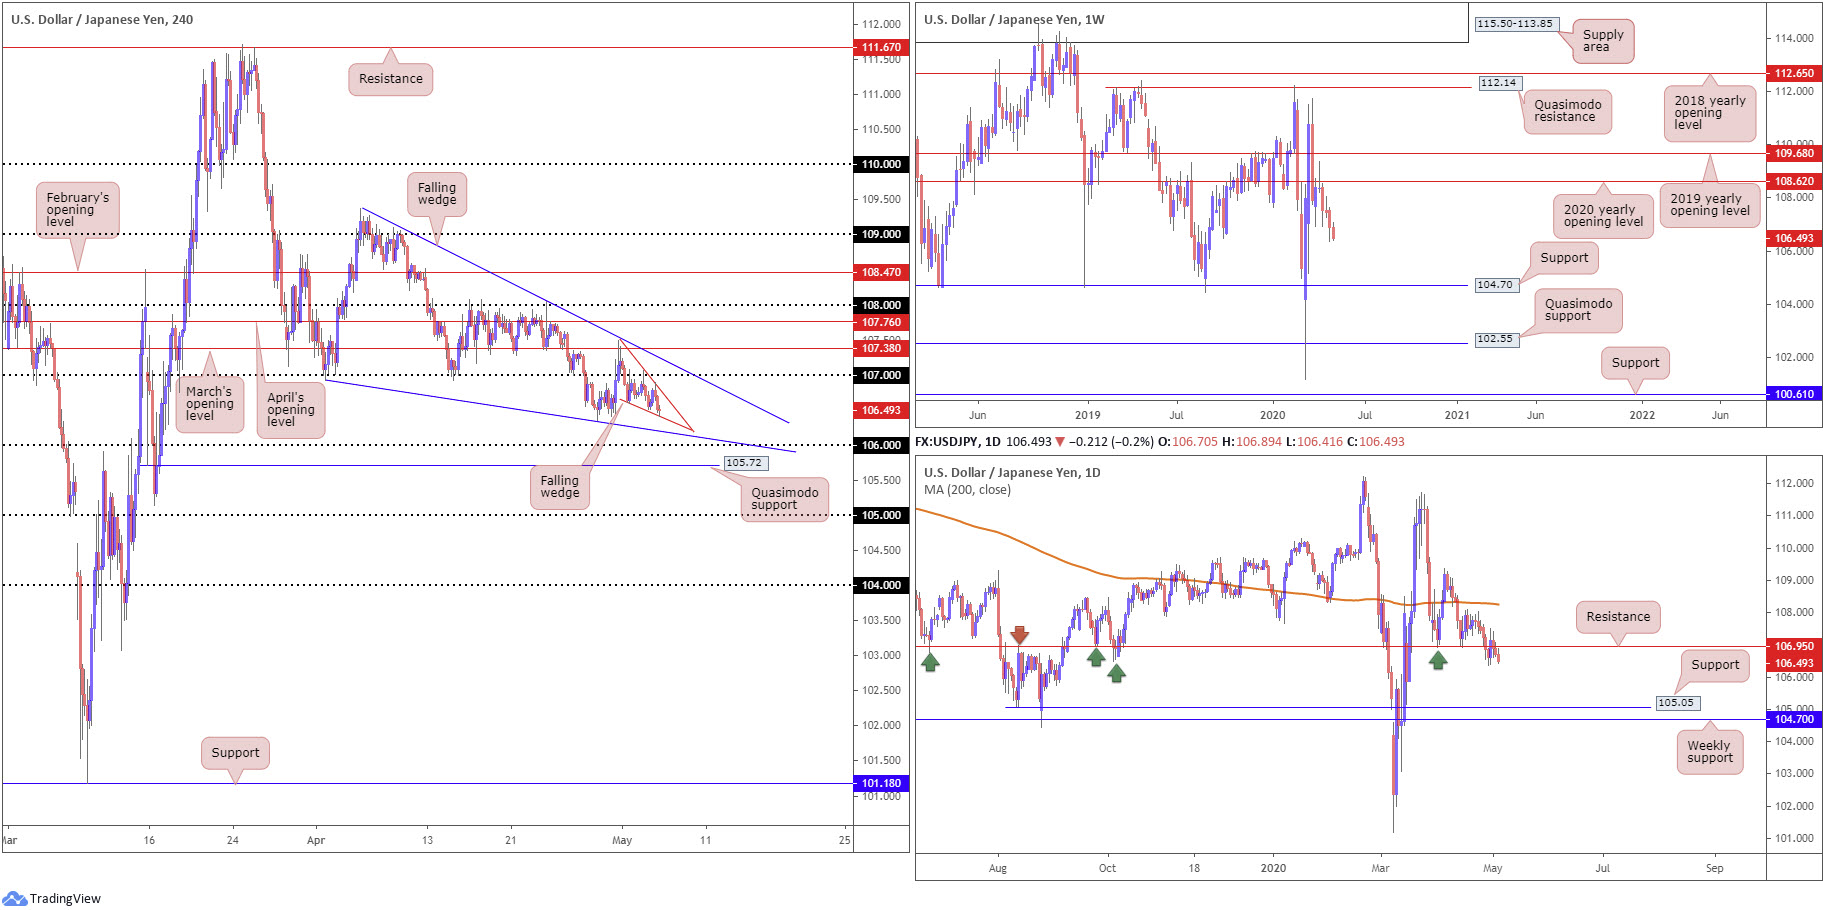
The US dollar extended downside against the Japanese yen Tuesday, relinquishing additional ground sub 107 on the H4 timeframe. This has formed a small local falling wedge pattern between 107.49/106.60 (red) which, interestingly, is also forming within a larger falling wedge configuration between 109.38/106.92 (blue).107 is clear resistance on the H4 scale right now, with the 106 handle also representing possible support, closely shadowed by Quasimodo support priced in at 105.72.
The weekly timeframe continues to emphasise a bearish tone south of the 2020 yearly opening level at 108.62. Last week, as you can see, extended losses to lows of 106.35, with support not expected to emerge until reaching 104.70.
Resistance at 106.95 maintains a presence on the daily timeframe.106.95 boasts notable history (arrows), therefore moves south of the base could see an approach form to support at 105.05. Additional resistance is not seen on this timeframe until reaching the 200-day SMA (orange – 108.25).
Areas of consideration:
Outlook unchanged given Tuesday’s lacklustre performance.
While price could potentially continue compressing within the local H4 falling wedge pattern, a fakeout through orders at 106 to Quasimodo support at 105.72 is a scenario worth underlining. A whipsaw through 106 followed up with a H4 close north of the round number could signal buyers want to take things higher. However, this would unfortunately entail going up against daily sellers from resistance at 106.95 and weekly directional flow.
In terms of resistance on the H4 scale, keep eyes on the 107 handle and March’s opening level at 107.38. Daily resistance at 106.95, as you’re probably aware, reinforces 107.
USD/CAD:
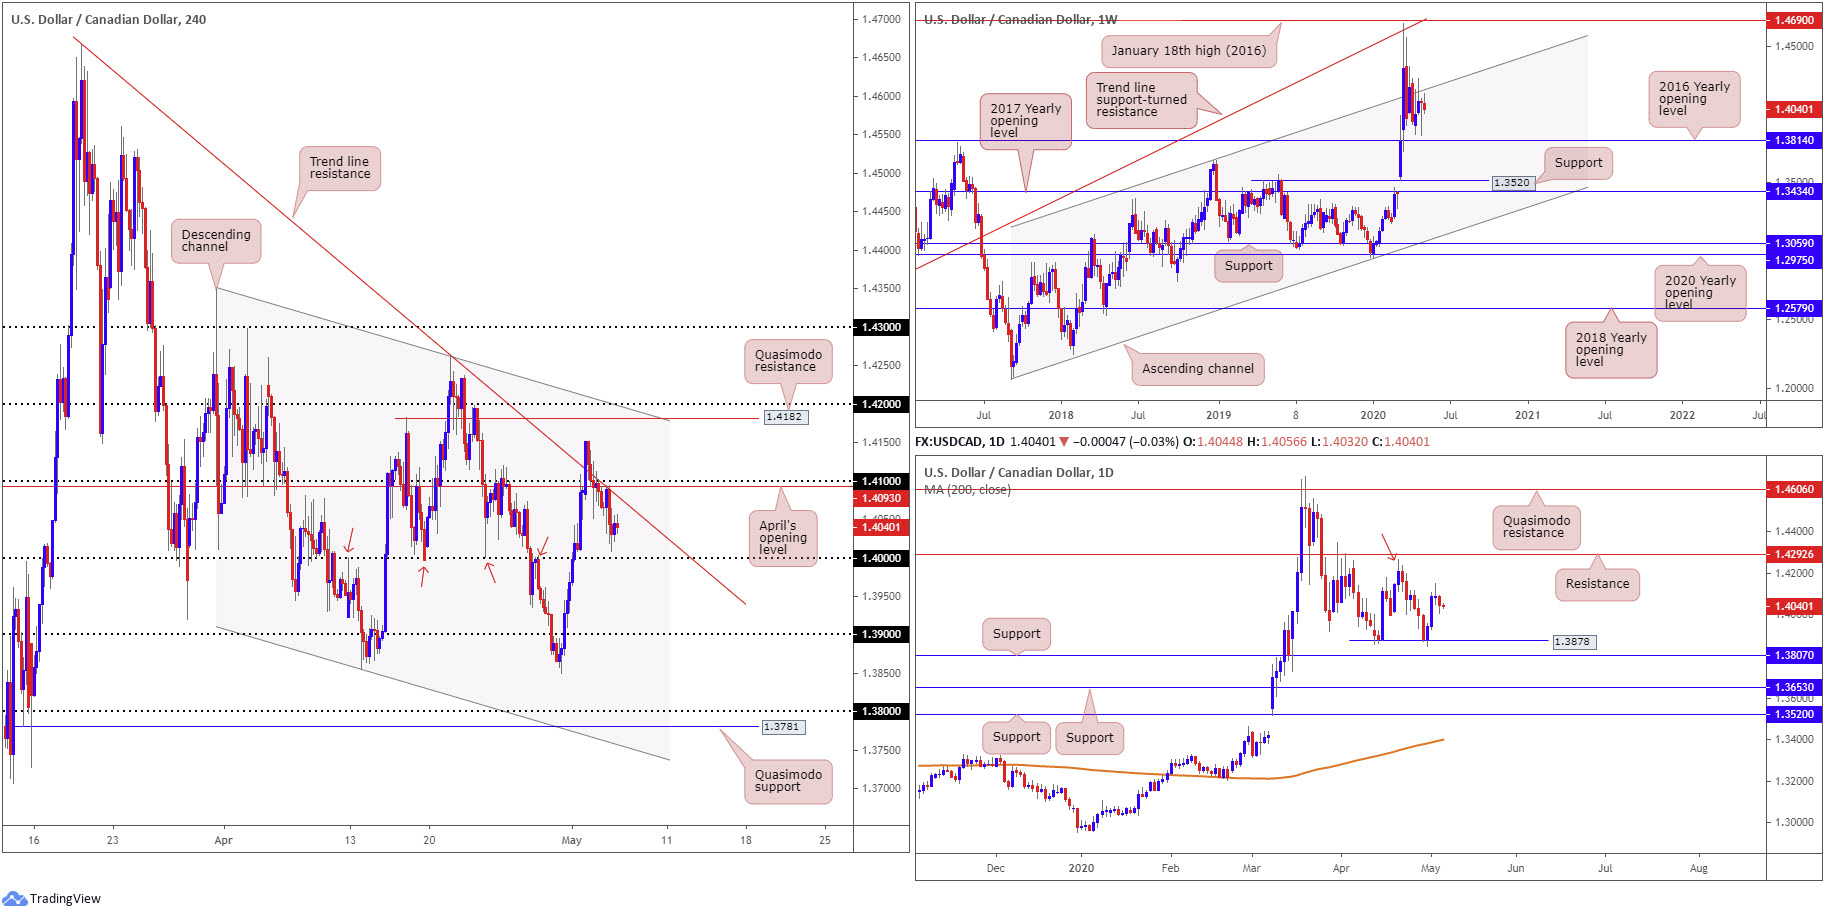
Early Europe Tuesday observed USD/CAD cross swords with April’s opening level at 1.4093 and H4 trend line resistance, taken from the high 1.4667, and turn to lows at 1.4007.
WTI prices rallied sharply, firming above $26.00/bbl. The US dollar index also extended recovery gains, scoring highs at 99.97.
The key figure 1.40 is likely on the radar for many traders as we head into Asia Pac hours Wednesday, having seen the base adopt reasonably strong support/resistance since early April (red arrows). A break of the said figure could potentially confirm downside to 1.39.
Further out on the weekly timeframe, price action is modestly bending beneath a long-term channel resistance, etched from the high 1.3661. To the downside, the 2016 yearly opening level at 1.3814 denotes support on this scale.
Thanks to an end-of-week advance in the form of a near-full-bodied bullish candle, a daily double-bottom support may form at 1.3878. However, traditional interpretation would have the peak at 1.4265 engulfed (red arrow) before confirming the formation. This would also entail overturning resistance at 1.4292. Space below 1.3878 offers little room for manoeuvre with support positioned at 1.3807. Monday, however, as you can see, finished by way of a shooting star candlestick configuration, with Tuesday making a play for lower levels.
Areas of consideration:
1.40, albeit boasting limited confluence, is a key level of support.
However, smothering 1.40 is also a possibility today, which would, technically speaking, potentially establish a basis for further selling to 1.39.
Should we rotate higher today, nonetheless, breaking the H4 trend line resistance and 1.41 handle, H4 Quasimodo resistance at 1.4182, channel resistance, extended from the high 1.4349, and the round number 1.42 could be a resistance area worthy of attention. Not only does it come with H4 confluence, the noted weekly channel resistance intersects with the H4 levels.
USD/CHF:
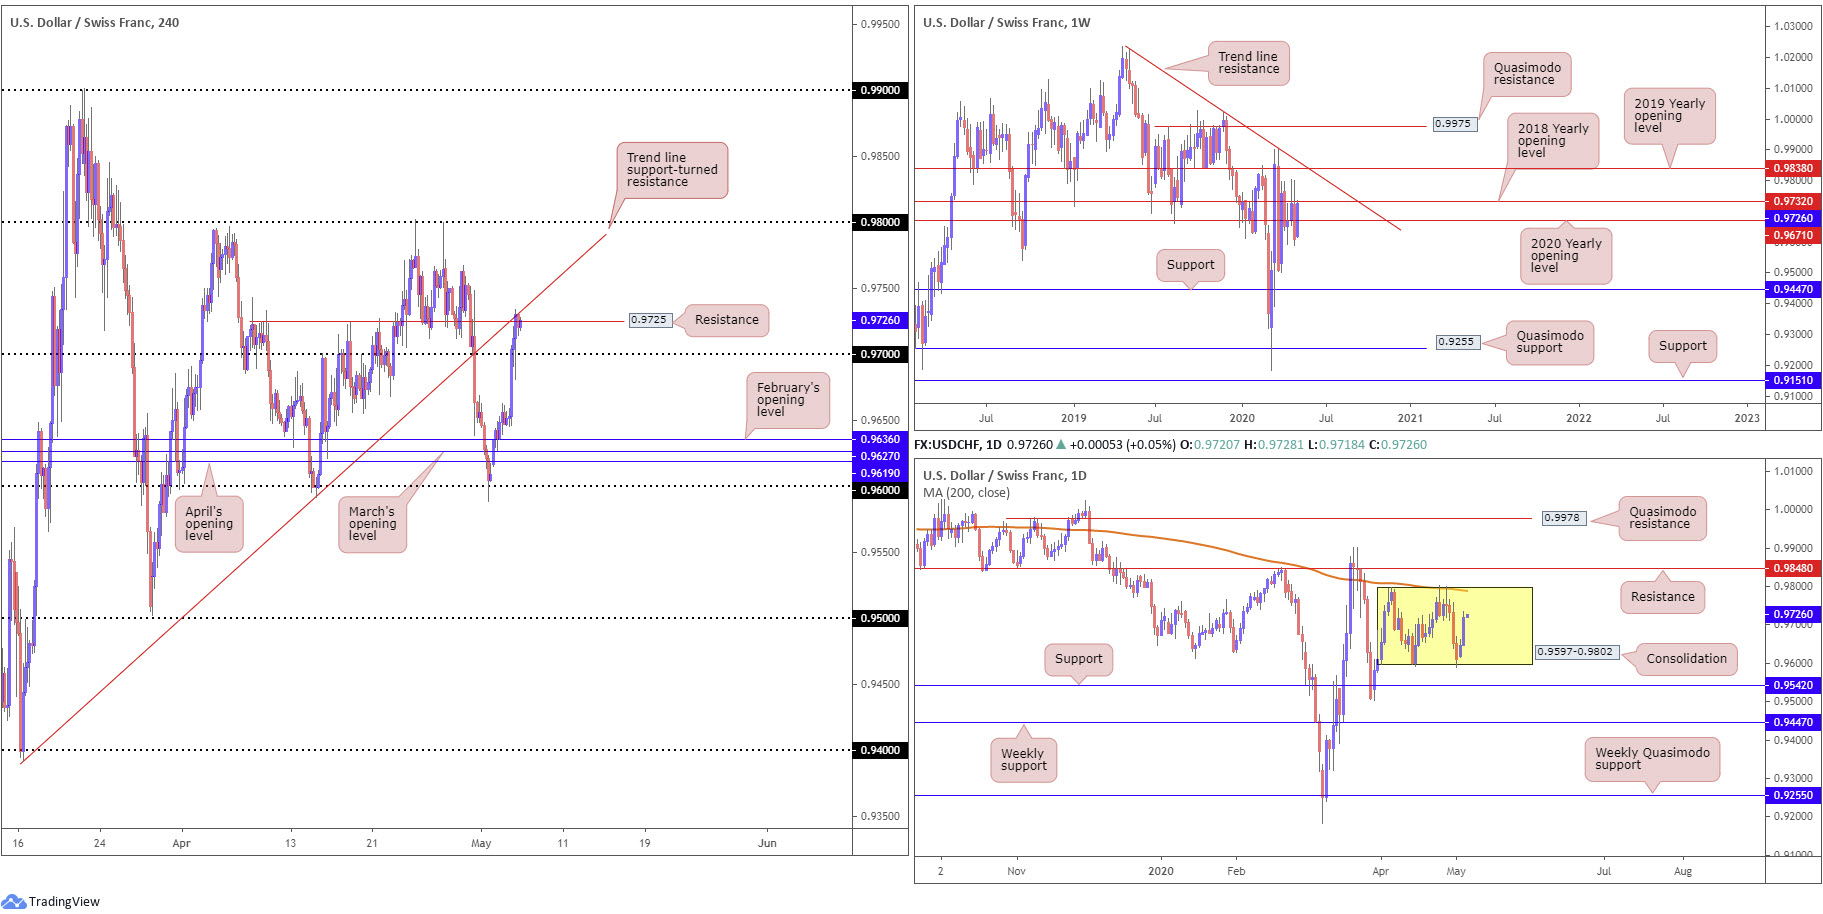
Sponsored by a broad-based USD bid as well as upbeat risk sentiment, USD/CHF bulls went on the offensive Tuesday and conquered 0.97, connecting with H4 resistance at 0.9725 and converging trend line support-turned resistance (extended from the low 0.9391) into the close. Should bulls reignite interest, limited resistance is seen on the H4 timeframe until reaching 0.98.
Across the page on the weekly timeframe, price action is connecting with the 2018 yearly opening level at 0.9732. A violation of this base could lead to trend line resistance, extended from the high 1.0226, entering the fight, along with the 2019 yearly opening level at 0.9838.
Since the beginning of April, the daily candles have been busy carving out a consolidation between 0.9597-0.9802. Note the 200-day SMA (orange – 0.9788) is also seen clinging to the upper edge of the said range. Outside of the area, we can see resistance forms at 0.9848 while support can be found at 0.9542.
Areas of consideration:
Having noted the re-appearance of the 2018 yearly opening level at 0.9732 on the weekly timeframe, and H4 price shaking hands with resistance at 0.9725, along with H4 trend line resistance, sellers may have the upper hand today and attempt an approach to 0.97 and possibly beyond.
Owing to daily price exhibiting scope to advance towards the upper edge of its range at 0.9802, conservative traders may wait and see if H4 price can close beneath 0.97 before taking action. Though do be aware that potential support could emerge off the 2020 yearly opening level at 0.9671, seen on the weekly timeframe.
Dow Jones Industrial Average:
US equity benchmarks finished modestly higher Tuesday, though sharply off best levels, as US restrictions begin to ease. The Dow Jones Industrial Average added 133.33 points, or 0.56%; the S&P 500 gained 25.70 points, or 0.90%, and the tech-heavy Nasdaq 100 concluded higher by 96.51 points, or 1.09%.
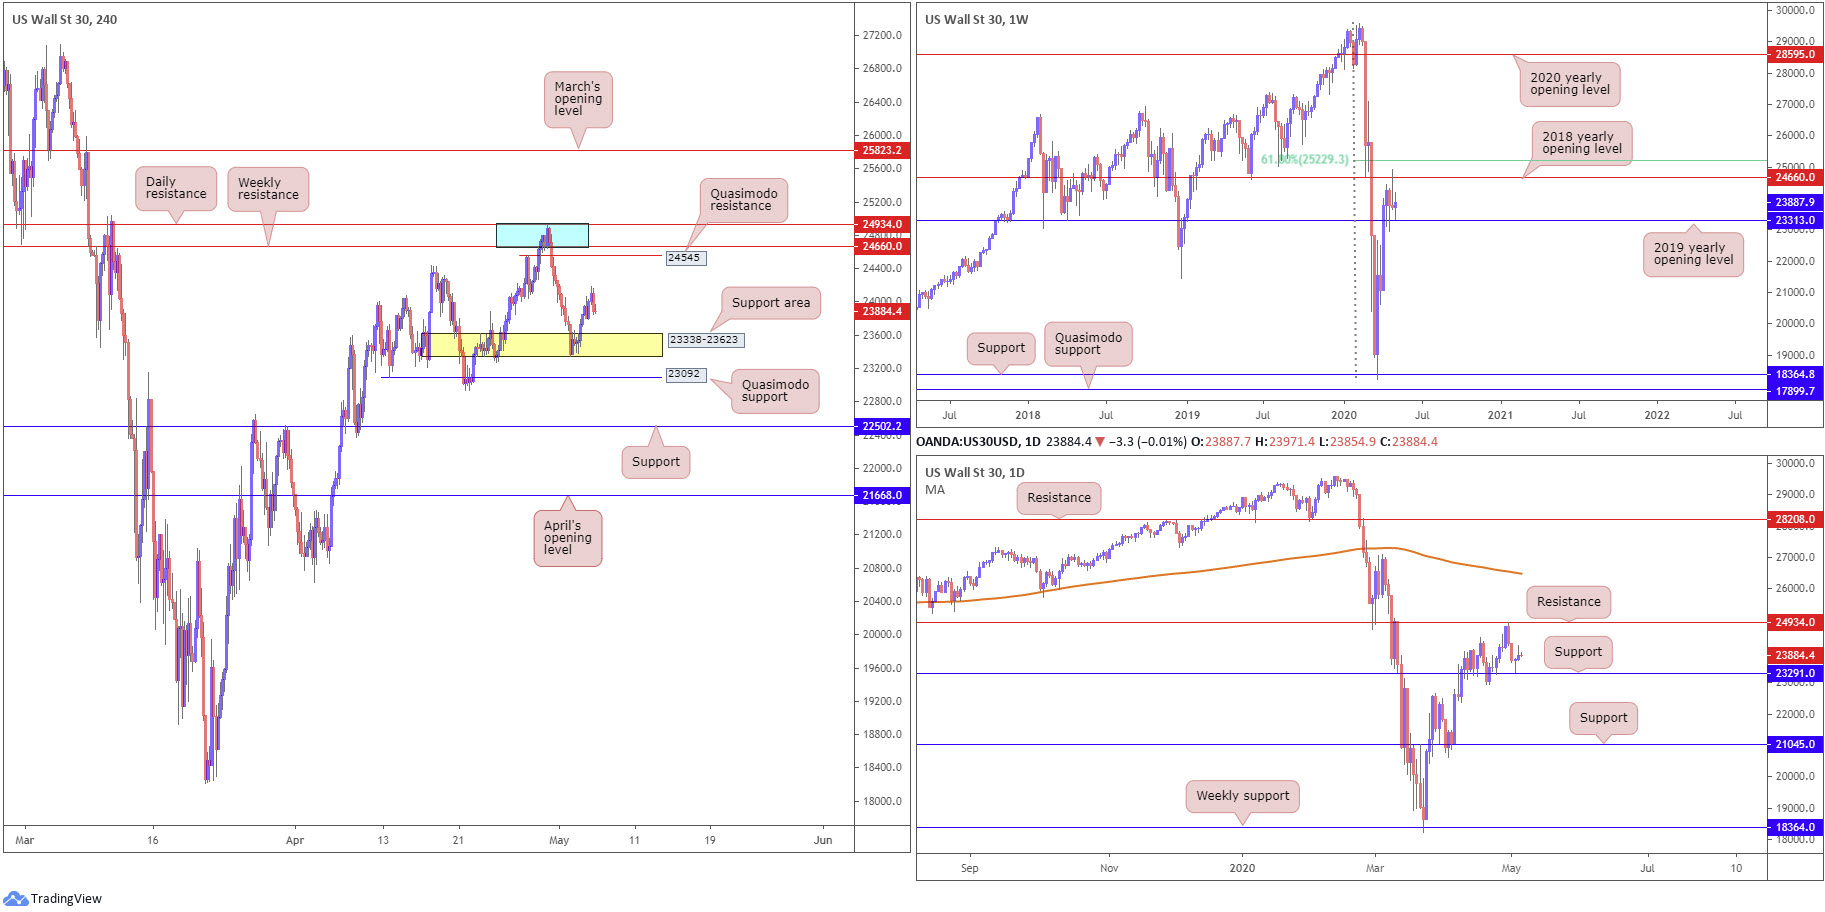
24934/24660, an area (blue) marked on the H4 timeframe that’s made up of daily resistance at 24934 and weekly resistance at 24660 (the 2018 yearly opening level), capped upside in recent trade.
Recent research went on to highlight the possibility of a reaction forming out of the H4 support area at 23338-23623, which, as you can see, did occur. Continued upside from here could test Quasimodo resistance at 24545, followed closely by the 24934/24660 zone.
Technical action on the weekly timeframe bottomed just ahead of the 2019 yearly opening level at 23313 in recent trading, following last week’s rejection off the 2018 yearly opening level at 24660. From the daily timeframe, we can see price came within touching distance of support at 23291, forming a clear-cut hammer candlestick pattern (bullish signal) on Monday. Tuesday, nonetheless, failed to print much of a follow-through move, producing a shooting star candlestick pattern (bearish signal).
Areas of consideration:
Traders short 24934/24660 have likely liquidated their position around the H4 support zone at 23338-23623.
Traders long from 23338-23623 will likely be targeting H4 Quasimodo resistance at 24545, though most would have reduced risk to breakeven by now.
In the event of a fakeout through the current H4 support area, we’re then dealing with both weekly and daily supports at 23313 and 23291.
XAU/USD (GOLD):
Despite additional USD gains, XAU/USD entered a subdued phase Tuesday. Given the relatively lacklustre performance of late, the research team’s outlook remains pretty much unchanged going forward.
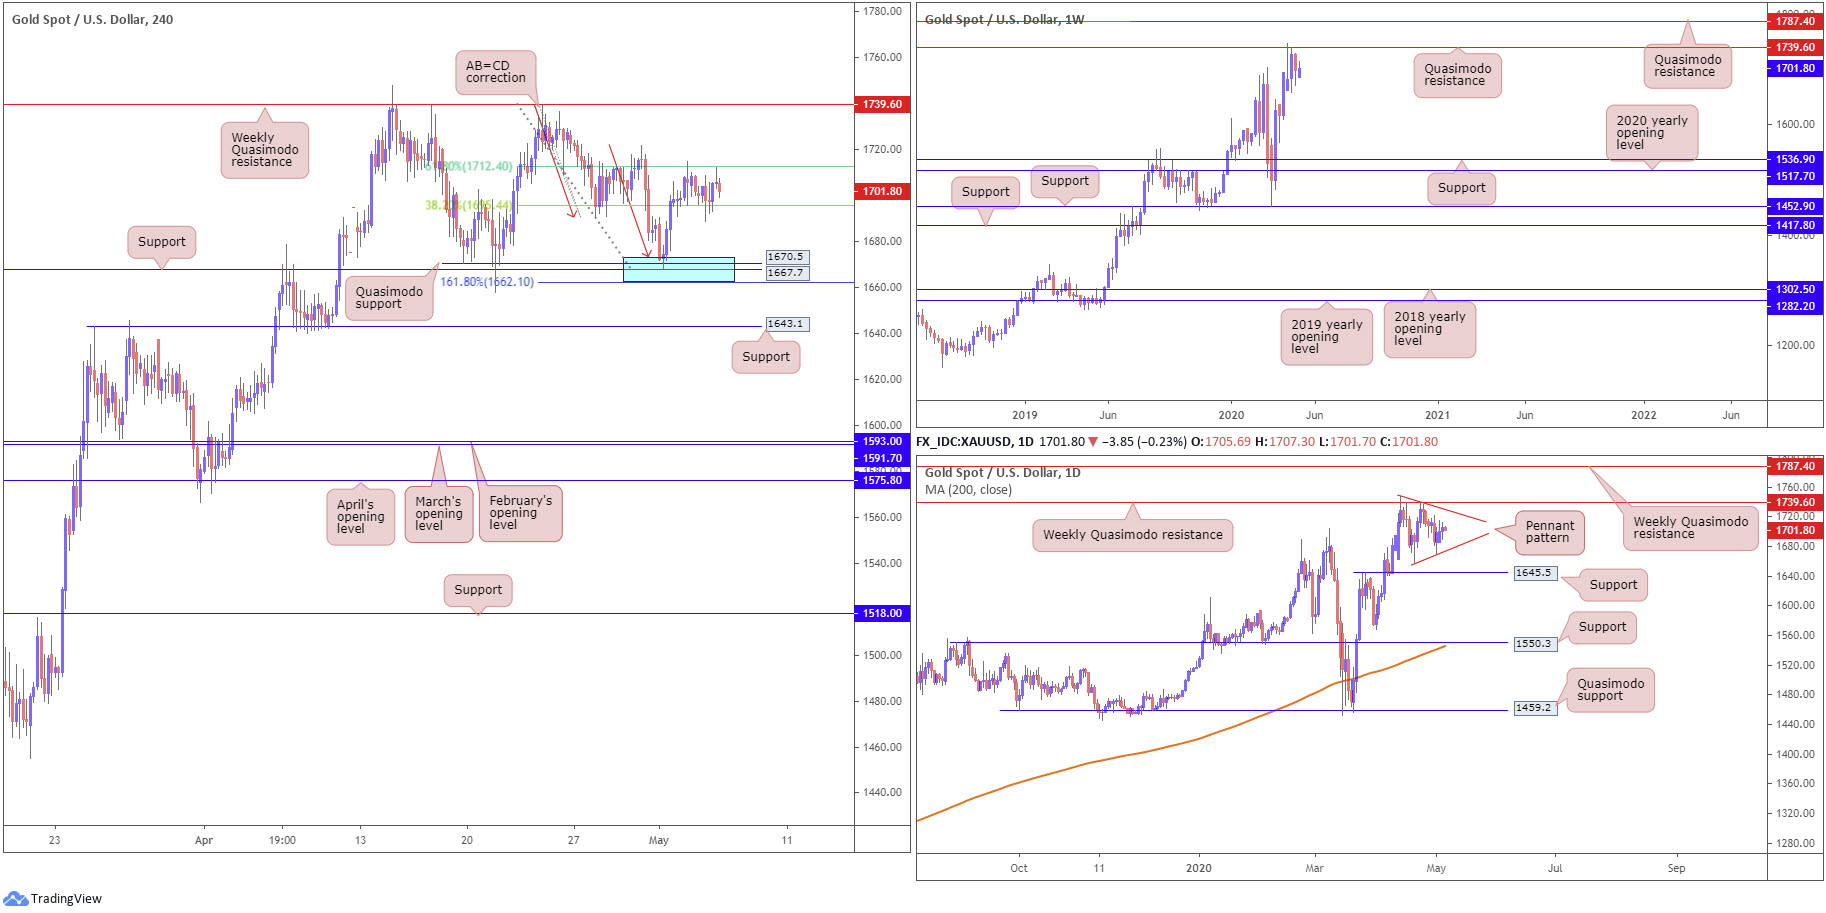
H4 support between 1662.1/1673.1 ([blue] comprised of a 161.8% Fibonacci extension point at 1662.1, support at 1667.7, Quasimodo support at 1670.5 and an AB=CD correction at 1673.1 [red arrows]), has capped downside in recent trade. Traders likely reduced risk to breakeven at the 38.2% Fibonacci retracement ratio from 1695.4, with most taking profit at the 61.8% Fibonacci retracement ratio at 1712.4 (common take-profit targets out of AB=CD corrections using legs A-D to apply the Fibonacci studies).
Further afield on the higher timeframes, we can see buyers and sellers squaring off around the underside of a weekly Quasimodo resistance at 1739.6. Downside from this region echoes the possibility of reaching support at 1536.9, while a breach of 1739.6 shifts focus towards another layer of Quasimodo resistance at 1787.4. It may also interest some traders to note the primary trend on gold has faced a northerly trajectory since 2016.
In similar fashion to the weekly timeframe, the weekly Quasimodo formation at 1739.6 is also posted as prominent resistance on the daily chart. The difference can be seen by way of supports: the next support target on the daily timeframe falls in at 1645.5. Pattern traders may also acknowledge the pennant pattern forming at the underside of the weekly Quasimodo base, created from a high of 1747.7 and a low of 1658.1.
Areas of consideration:
Further buying, despite price reaching 1712.4 on the H4 timeframe, is a possibility towards the weekly Quasimodo resistance at 1739.6. Therefore, those who managed to catch the move out of 1662.1/1673.1 may leave a portion of their position running in case of further upside.
In the event we print a H4 close above 1739.6, we’ll likely see breakout buyers make a show, targeting weekly Quasimodo resistance at 1787.4. This would also likely seal a daily close above the upper boundary of the current daily pennant pattern, adding fuel to any upside.
The accuracy, completeness and timeliness of the information contained on this site cannot be guaranteed. IC Markets does not warranty, guarantee or make any representations, or assume any liability regarding financial results based on the use of the information in the site.
News, views, opinions, recommendations and other information obtained from sources outside of www.icmarkets.com.au, used in this site are believed to be reliable, but we cannot guarantee their accuracy or completeness. All such information is subject to change at any time without notice. IC Markets assumes no responsibility for the content of any linked site.
The fact that such links may exist does not indicate approval or endorsement of any material contained on any linked site. IC Markets is not liable for any harm caused by the transmission, through accessing the services or information on this site, of a computer virus, or other computer code or programming device that might be used to access, delete, damage, disable, disrupt or otherwise impede in any manner, the operation of the site or of any user’s software, hardware, data or property.


