
A note on lower timeframe confirming price action…
Waiting for lower timeframe confirmation is our main tool to confirm strength within higher timeframe zones, and has really been the key to our trading success. It takes a little time to understand the subtle nuances, however, as each trade is never the same, but once you master the rhythm so to speak, you will be saved from countless unnecessary losing trades. The following is a list of what we look for:
- A break/retest of supply or demand dependent on which way you’re trading.
- A trendline break/retest.
- Buying/selling tails/wicks – essentially we look for a cluster of very obvious spikes off of lower timeframe support and resistance levels within the higher timeframe zone.
- Candlestick patterns. We tend to only stick with pin bars and engulfing bars as these have proven to be the most effective.
We search for lower timeframe confirmation between the M15 the H1 timeframes, since most of our higher-timeframe areas begin with the H4. Stops are usually placed 5-10 pips beyond confirming structures.
EUR/USD:
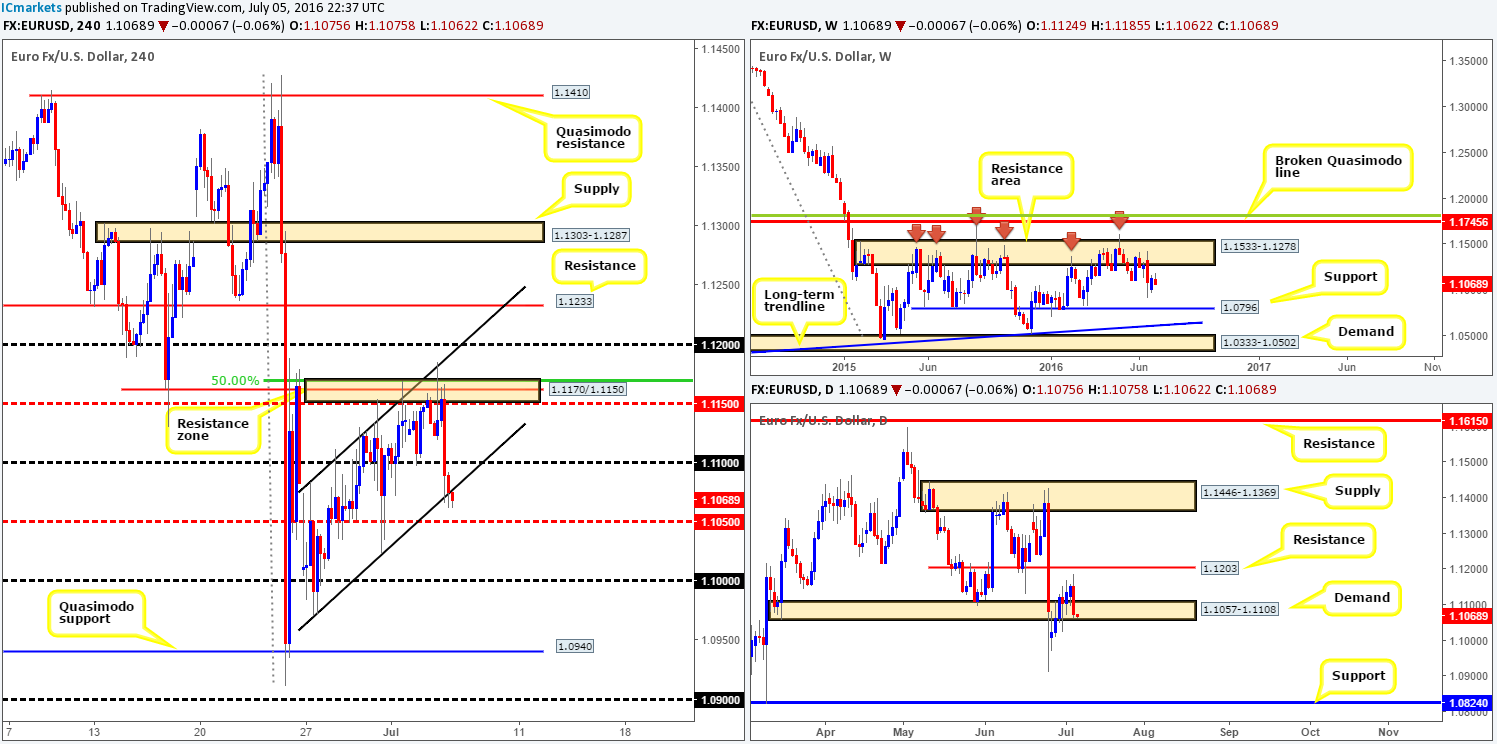
The value of the EUR weakened in aggressive fashion going into yesterday’s US session from the H4 resistance zone seen at 1.1170/1.1150 (H4 mid-way resistance at 1.1150/H4 resistance at 1.1162/ H4 50.0% Fib resistance at 1.1170). Both the psychological support 1.11 and H4 channel support line extended from the low 1.0970 were taken out, resulting in price closing the day just ahead of the H4 mid-way support line 1.1050.
Over on the higher timeframe picture, we can see that the daily demand at 1.1057-1.1108 is showing signs of weakness as price is seen flirting with the lower edge of this barrier as we speak. In the event that this area does indeed give way, there’s little support seen on this timeframe, other than the referendum low at 1.0911, until 1.0824. Up on the weekly chart, however, the shared currency appears slightly looser as the unit looks to be trading mid-range between a long-term weekly resistance area coming in at 1.1533-1.1278, and a long-term weekly support line seen at 1.0796. Therefore, according to the weekly timeframe’s structure, price could move either way.
Our suggestions: Given the weakness seen around the current daily demand and recent break through the H4 channel support (see above), we’d avoid buying for the time being. Selling, however, may be possible beyond the H4 mid-way support 1.1050, targeting the 1.10 handle followed by the H4 Quasimodo support line at 1.0940.
For most who follow our reports on a regular basis you’ll already know that we’re not too fond of breakout trading. As such, our team would only become sellers in this market if price was to retest the underside of 1.1050 as resistance (after price closed lower) followed by a lower timeframe sell signal (this is simply to avoid being faked out). Please see the top of this report for a list of sell signals we look for.
Levels to watch/live orders:
- Buys: Flat (Stop loss: N/A).
- Sells: Watch for price to consume the H4 mid-way support 1.1050 and look to trade any retest seen thereafter (lower timeframe confirmation required).
GBP/USD:
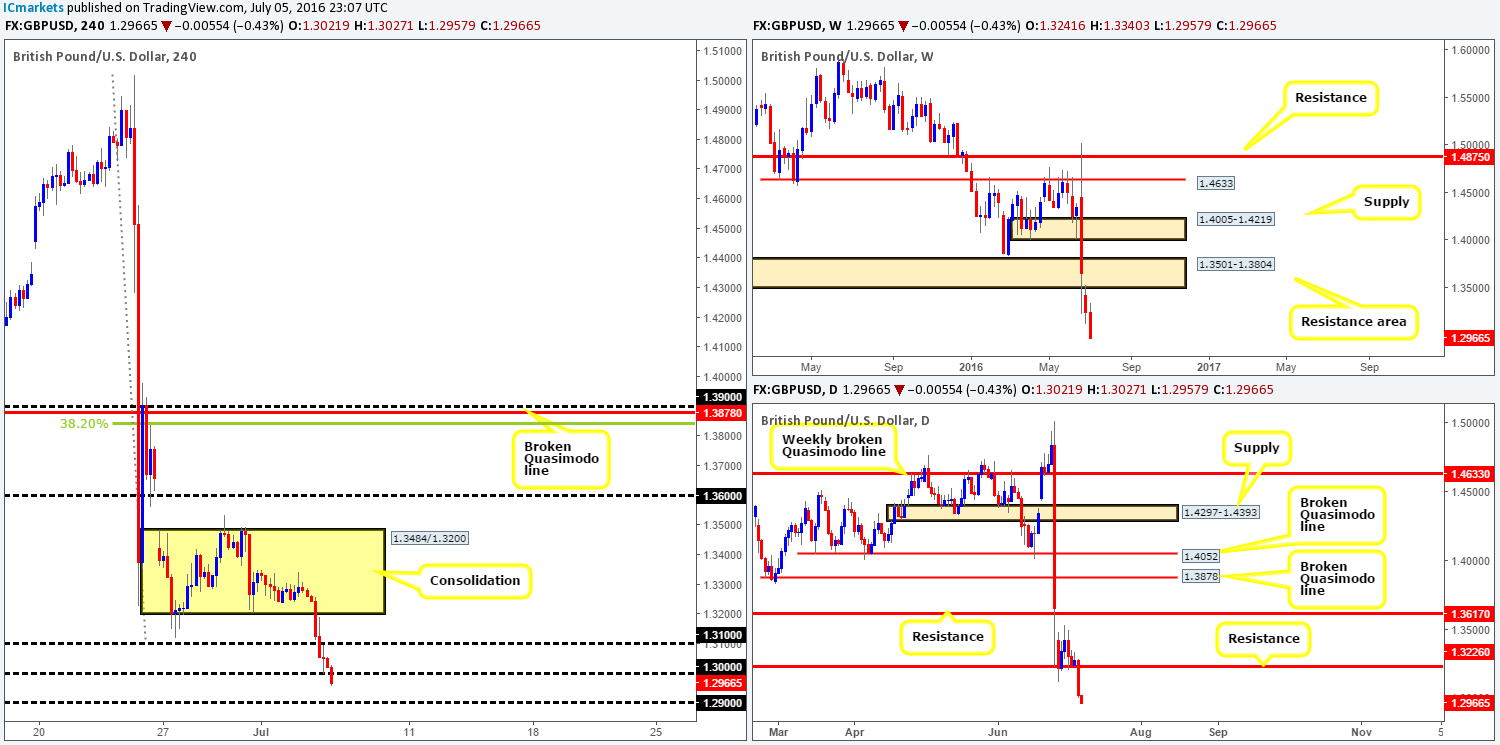
Following a week-long consolidation on the H4 chart at 1.3484/1.3200, strong sellers stepped in yesterday after the BoE announced that they’re going to be loosening requirements for UK banks to help fight against the effects of ‘Brexit’, and to ensure minimal disruption to the credit supply.
As we write, the buyers and sellers are seen battling for position around the key figure 1.30. Buyers look as though they’re weakening and as a result we may see price shake hands with the 1.29 handle sometime today. By and large, we are blind on the higher timeframes right now as price recently touched fresh 31-year lows! Essentially all we have on this platform to guide us right now are the H4 handles!
Our suggestions: Fundamentally, this pair may still be heading lower as political uncertainty in the UK remains high. Therefore, do try and keep abreast with latest developments if you intend on trading this market. From a technical standpoint, nevertheless, one could look for shorts below 1.30 today, targeting 1.29. For this we would HIGHLY recommend waiting for price to CLOSE below 1.30, and only consider shorts should one see a retest of this number as resistance followed by a lower timeframe sell signal (see the top of this report for lower timeframe entry techniques).
Levels to watch/live orders:
- Buys: Flat (Stop loss: N/A).
- Sells: Watch for price to consume the 1.30 handle and look to trade any retest seen thereafter (lower timeframe confirmation required).
AUD/USD:
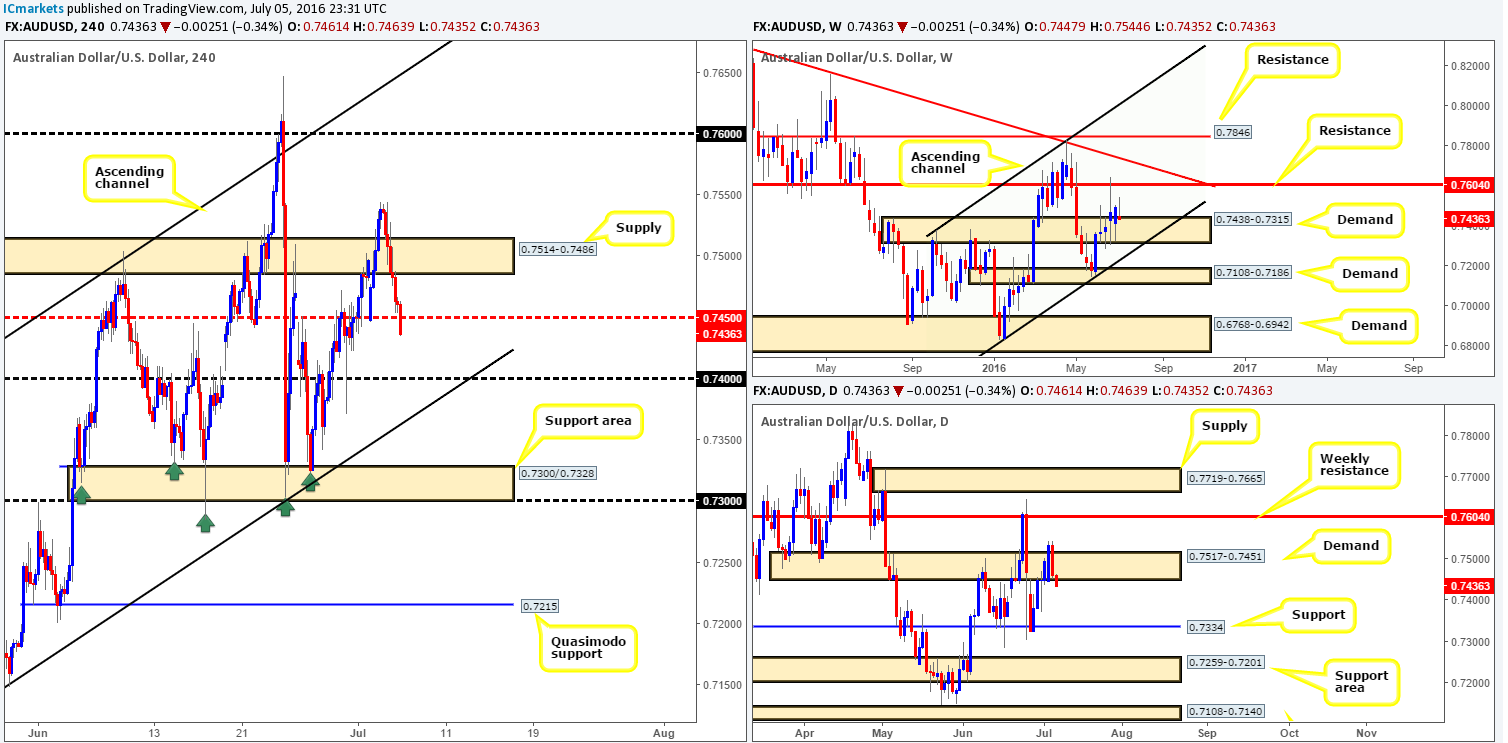
The Aussie dollar fell lower during the course of yesterday’s sessions after the RBA decided to leave interest rates unchanged. This, as you can see, saw price erase a large chunk of Monday’s gains and close just ahead of the H4 mid-way support at 0.7450. As we write, however, price is seen trading below 0.7450 and seems set to extend lower down to at least the 0.74 handle in this clear risk-off environment.
Before becoming sellers in this market, we would prefer to see at least a H4 close below the daily demand at 0.7517-0.7451 (which is essentially the H4 mid-way support at 0.7450), as let’s not forget that weekly action is trading from the top-side of a weekly demand base at 0.7438-0.7315.
Our suggestions: Watch for a close below 0.7450 and look to trade any CONFIRMED retest seen to the underside of this number, targeting 0.74, followed closely by the H4 channel support line taken from the low 0.7148 (see the top of this report for ways of confirming the retest from the lower timeframes).
Levels to watch/live orders:
- Buys: Flat (Stop loss: N/A).
- Sells: Watch for price to consume the H4 mid-way support at 0.7450 and look to trade any retest seen thereafter (lower timeframe confirmation required).
USD/JPY:
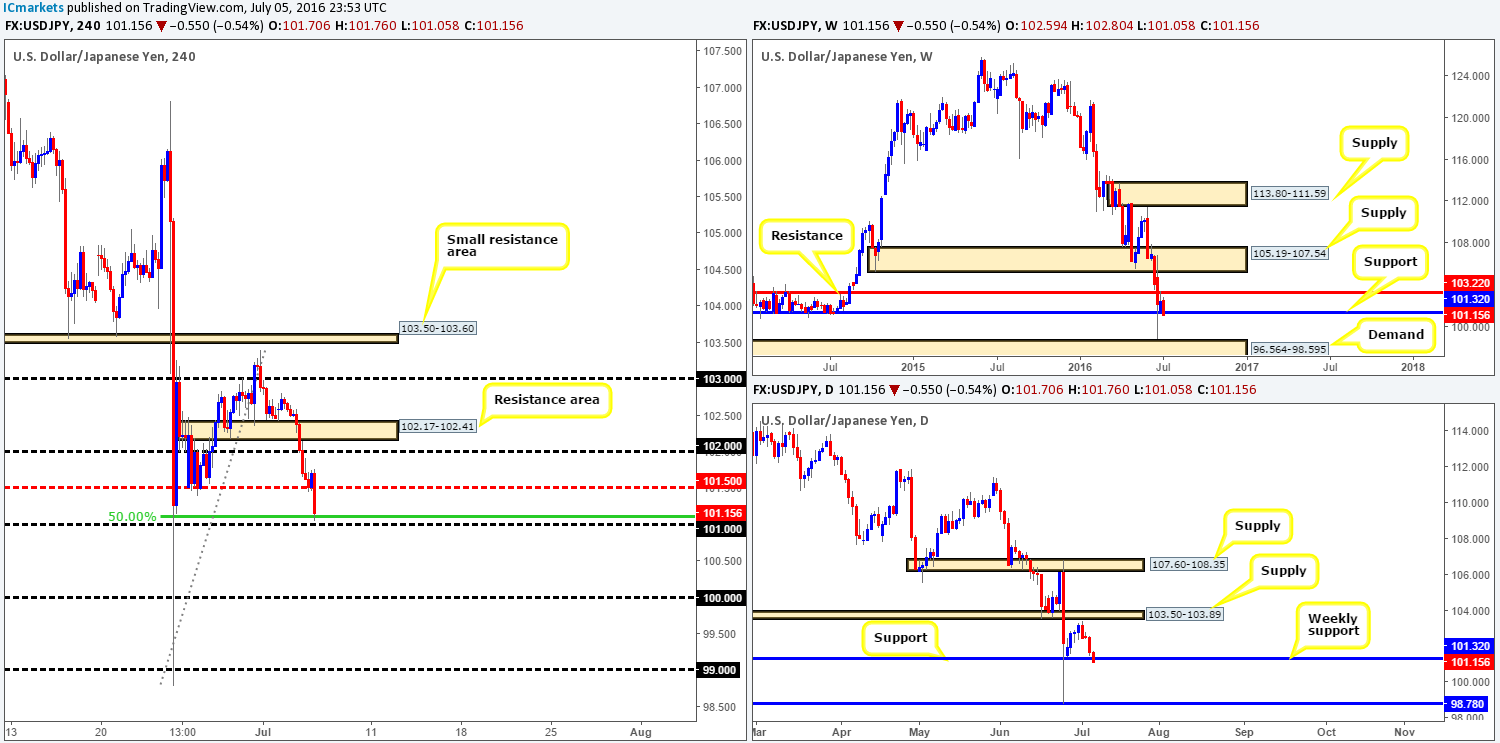
In recent trading, the USD/JPY sold off as investors flocked to the safe-haven Yen. This clear risk-off environment forced price to crash through both the H4 support area at 102.17-102.41 (acting resistance area) and the 102 handle.
As we write, the pair is seen trading within shouting distance of the 101 handle, which given its close relationship with the weekly support at 101.32 and a H4 Fib support at 101.09, we may see price rebound from this line today. However, entering from the 101 region would, as far as we can see, require a stop loss of around 20 pips to make it a worthwhile trade, due to the next take-profit target sitting just above at 101.50 (held beautifully as support twice in recent action, so has a good chance of providing resistance).
Our suggestions: Watch for a lower timeframe entry long from 101.00, targeting 101.50 as a first take-profit target. Here we’d look to reduce risk to breakeven and liquidate 50% of the position, in the hope that price may rally further up to the 102 hurdle. For those who struggle to find entries on the lower timeframes, you may want to check out our plan which can be seen at the top of this report.
Levels to watch/live orders:
- Buys: 101.00 region [Tentative – confirmation required] (Stop loss: dependent on where one confirms this area).
- Sells: Flat (Stop loss: N/A).
USD/CAD:
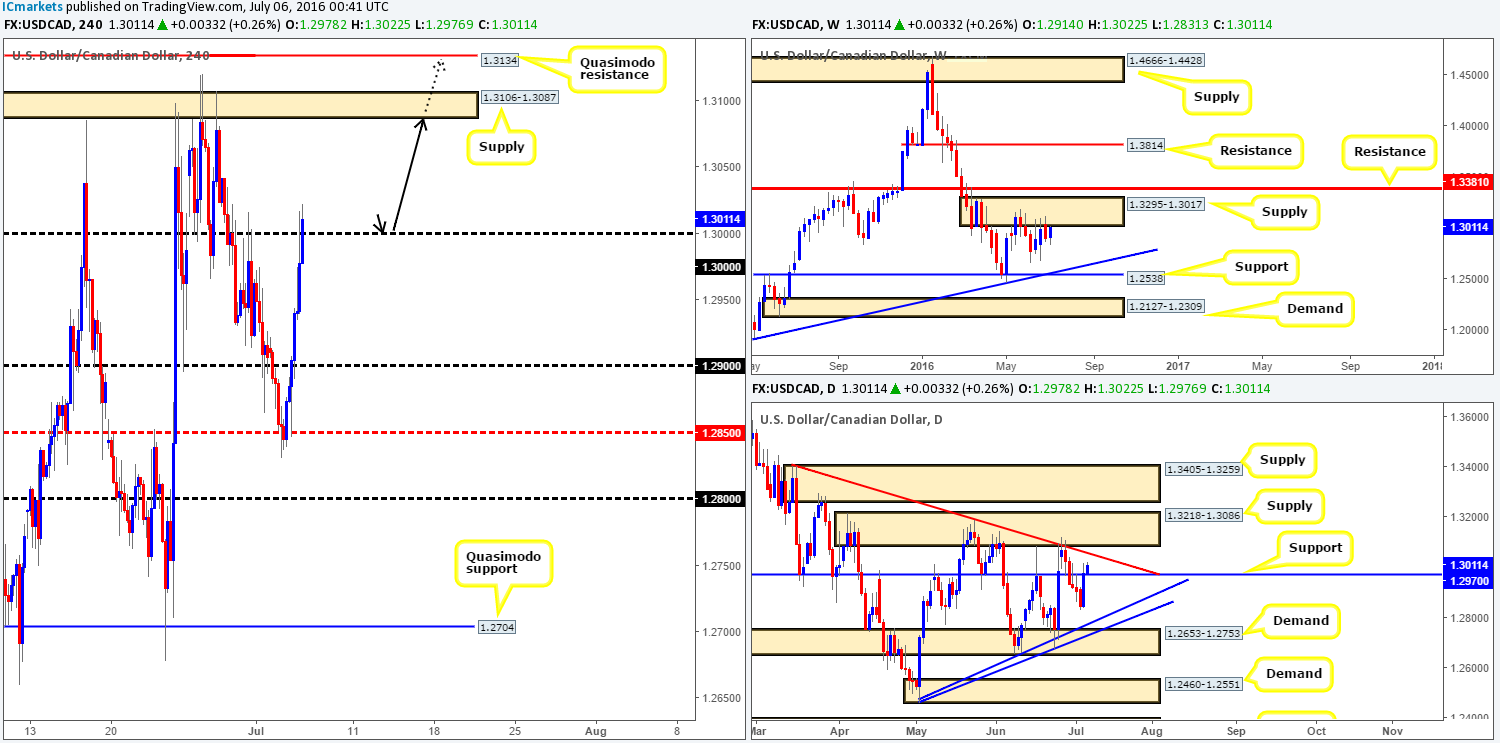
Bolstered by a sharp drop in oil prices yesterday, the USD/CAD aggressively advanced north, taking out the 1.29 handle and just now cutting through the 1.30 line. From a technical standpoint, a close above this level would likely attract further buying up to the H4 supply at 1.3106-1.3087, and quite possibly, the H4 Quasimodo resistance line at 1.3134.
However, over on the weekly chart, traders will see that upside momentum could potentially diminish as price is currently testing the underside of weekly supply at 1.3295-1.3017. Sliding down into the daily chart, nevertheless, there is a small void seen for price to advance up to the daily trendline resistance taken from the high 1.3401, following a break of daily resistance at 1.2970 (acting support).
Our suggestions: Should the loonie close above 1.30 today and retest this line as support, we would, along with a lower timeframe buy signal (see the top of this report on how to pinpoint an entry), look to enter long. However, given the position of price on the weekly chart, risk would be reduced to breakeven as soon as price tags 1.3050 since one can never be too careful when trading against higher timeframe opposition!
Take profit targets for a long above 1.30 are: 1.3106-1.3087 (H4 supply), 1.3134 (H4 Quasimodo resistance).
Levels to watch/live orders:
- Buys: Watch for price to consume 1.30 and look to trade any retest seen thereafter (lower timeframe confirmation required).
- Sells: Flat (Stop loss: N/A).
USD/CHF:
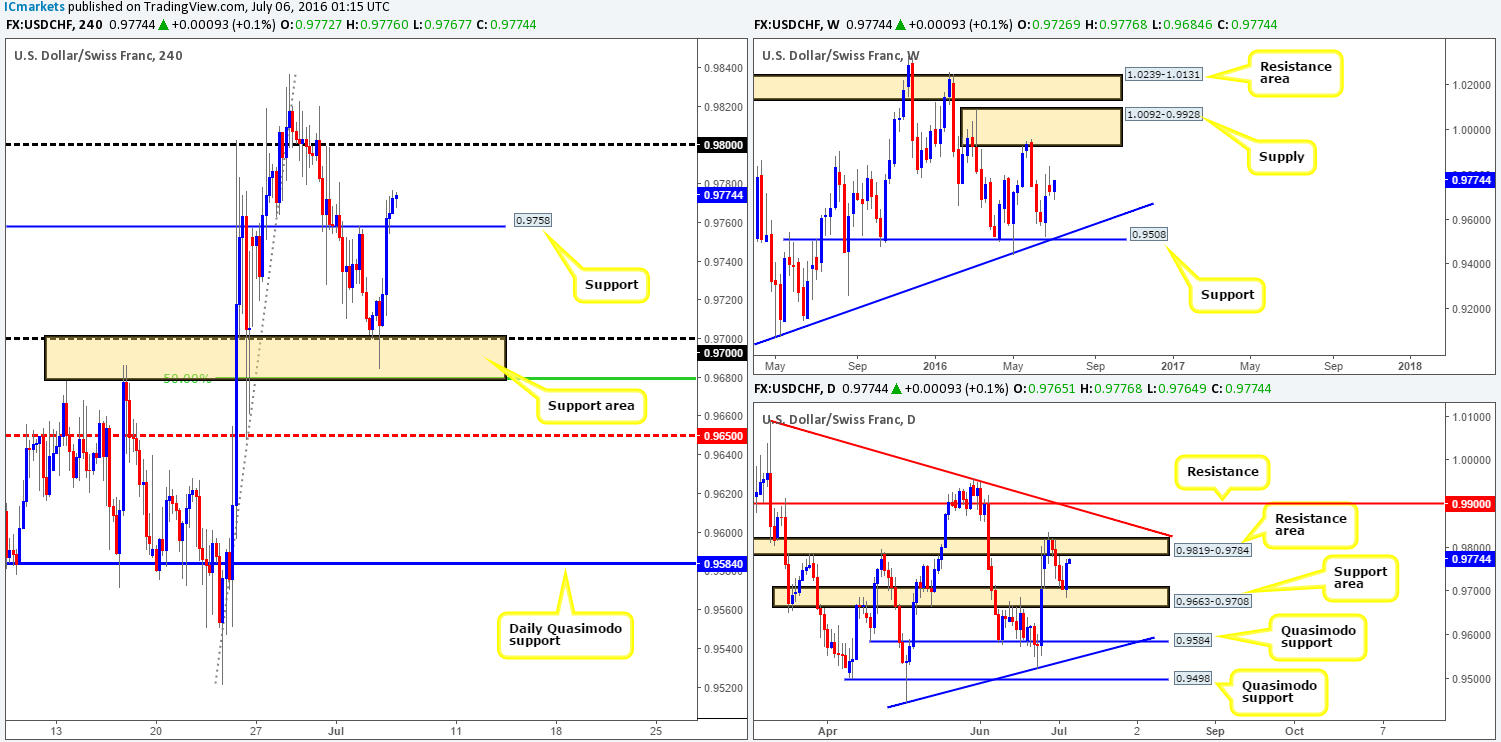
For those who read our previous report on the Swissy (see link below) you may recall us mentioning to watch for a lower timeframe buy entry between the H4 support area at 0.9679/0.9700 (comprised of a round number at 0.9700 and a H4 Fib support at 0.9679). As can be seen from the chart, price reacted beautifully from this zone, and has already closed above the first take-profit line at 0.9758 (a H4 resistance barrier). For any of our readers who managed to enter long here, price is very close to hitting the second and final take-profit line – the underside of the daily resistance area at 0.9784.
Our suggestions: Unless you’re already long this pair, we would advise being patient since there is no immediate trading opportunity as far as we see. Should price hit the above said daily resistance area and retrace, our attention would then shift to the H4 resistance-turned support at 0.9758. A break below this barrier followed by a subsequent retest would likely encourage further selling back down to the H4 support area we mentioned above at 0.9679/0.9700. To trade this move, however, we would require a lower timeframe sell signal to form after the retest as this usually allows one to avoid any fakeouts that take place.
http://www.icmarkets.com/blog/tuesday-5th-july-daily-technical-outlook-and-review/
Levels to watch/live orders:
- Buys: Flat (Stop loss: N/A).
- Sells: Watch for price to consume the H4 support level at 0.9758 and look to trade any retest seen thereafter (lower timeframe confirmation required).
DOW 30:
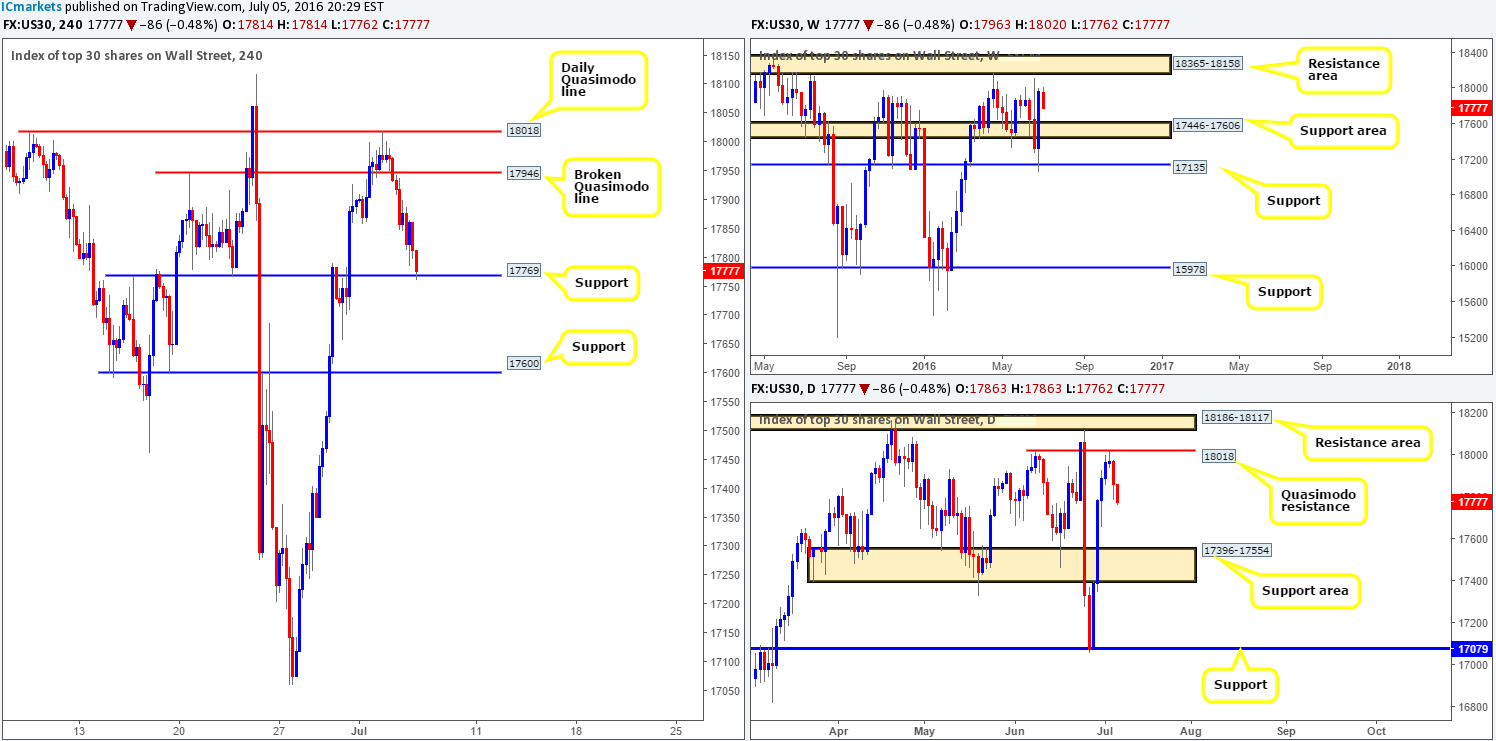
In our previous report, we wrote about looking to short from the underside of the H4 broken Quasimodo line at 17946, targeting H4 support at 17769, followed by H4 support at 17600. As you can see, price missed the underside of this line by an ant’s hair before proceeding to drop to lows of 17786 on the day.
With daily action looking as though it intends to continue lower down to the daily support area at 17396-17554, and weekly price showing space to move south to the weekly support area at 17446-17606, where does one go from here? Well, buying from the current H4 support at 17769 might not be the path to take today given the higher timeframe picture. Alternatively, one could look for price to close below this H4 line as the path south appears clear down to H4 support at 17600 (positioned above the aforementioned daily support area).
Our suggestions: In light of the above, today’s spotlight will firmly be focused on watching for price to close below the H4 support at 17769. Should this come into view, a retest followed by a lower timeframe sell signal will be required before pulling the trigger. There is only one take-profit target for this potential setup: the H4 support mentioned above at 17600. For those who have difficulty in pinning down lower timeframe entries, please take a quick look at the top of this report where we have laid out our entry techniques in bullet-point form.
Levels to watch/live orders:
- Buys: Flat (Stop loss: N/A).
- Sells: Watch for price to consume the H4 support level at 17769 and look to trade any retest seen thereafter (lower timeframe confirmation required).
Gold:
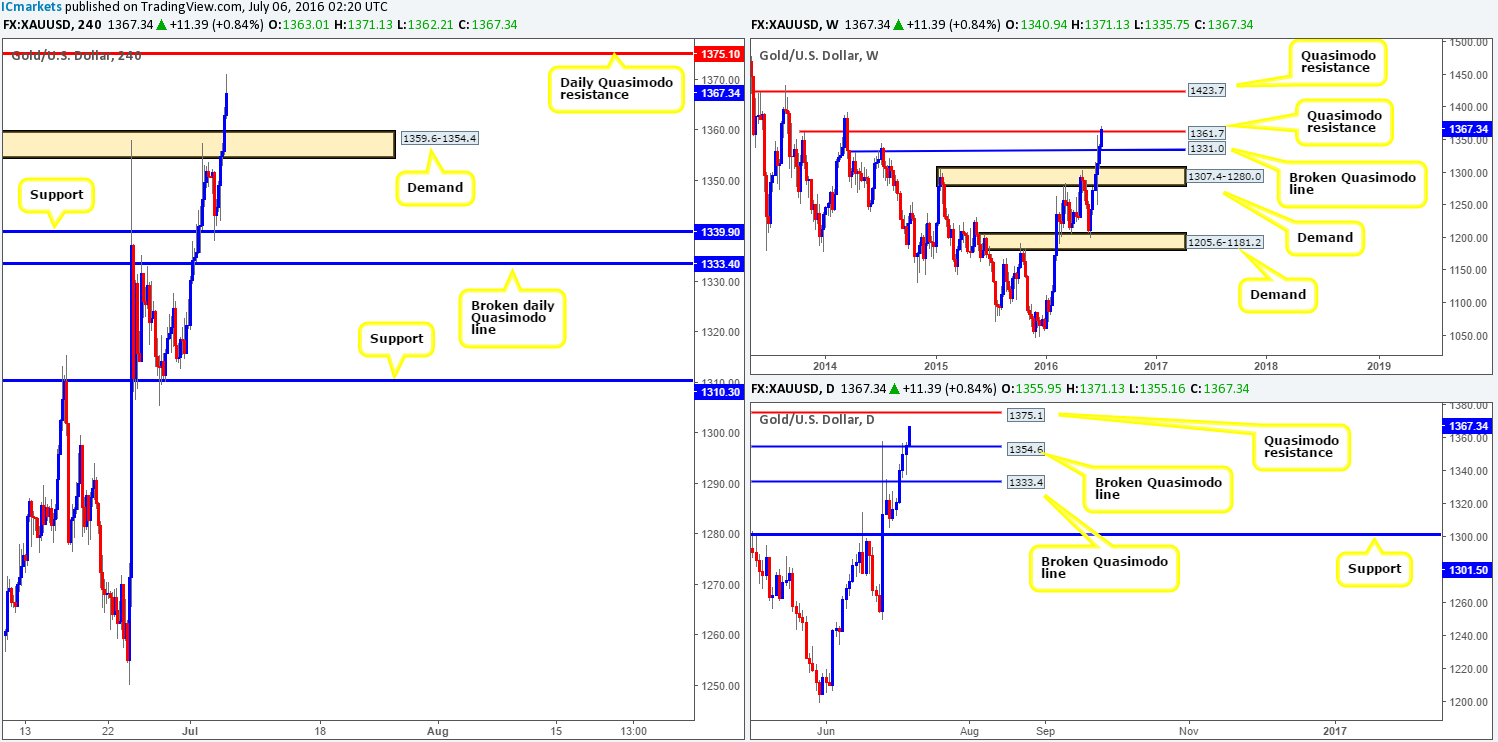
Along with the Yen, gold’s safe-haven appeal strengthened during the course of yesterday’s sessions, pushing price above the H4 supply at 1359.6-1354.4 (now acting demand), which potentially opened up the path north to the daily Quasimodo resistance line drawn from 1375.1.
With the above in mind, one has to also take into consideration that weekly price is currently flirting with a weekly Quasimodo resistance line at 1361.7. This line could potentially halt further buying and push prices down to retest the H4 demand barrier at 1359.6-1354.4. Should this happen, our team will not consider buying from here as you’d effectively be going up against weekly flow which is usually not a good idea! On the other hand, assuming the buyers still have some fight left in them at current price, we may see the yellow metal bid up to the daily Quasimodo resistance line mentioned above at 1375.1, which, to us, looks to be a decent sell zone!
Our suggestions: Shorting from the daily Quasimodo resistance line at 1375.1 is certainly an option today if price manages to reach this high. Whether one waits for lower timeframe confirmation to sell or simply pulls the trigger at market, the stop loss, at least in our opinion, should be set above the apex of the daily Quasimodo formation: 1387.8.
Levels to watch/live orders:
- Buys: Flat (Stop loss: N/A).
- Sells: 1375.1 region [Tentative – confirmation required] (Stop loss: dependent on where one confirms this area).


