
A note on lower timeframe confirming price action…
Waiting for lower timeframe confirmation is our main tool to confirm strength within higher timeframe zones, and has really been the key to our trading success. It takes a little time to understand the subtle nuances, however, as each trade is never the same, but once you master the rhythm so to speak, you will be saved from countless unnecessary losing trades. The following is a list of what we look for:
- A break/retest of supply or demand dependent on which way you’re trading.
- A trendline break/retest.
- Buying/selling tails – essentially we look for a cluster of very obvious spikes off of lower timeframe support and resistance levels within the higher timeframe zone.
- Candlestick patterns. We tend to only stick with pin bars and engulfing bars as these have proven to be the most effective.
For us, lower timeframe confirmation starts on the M15 and finishes up on the H1, since most of our higher timeframe areas begin with the H4.
EUR/USD:
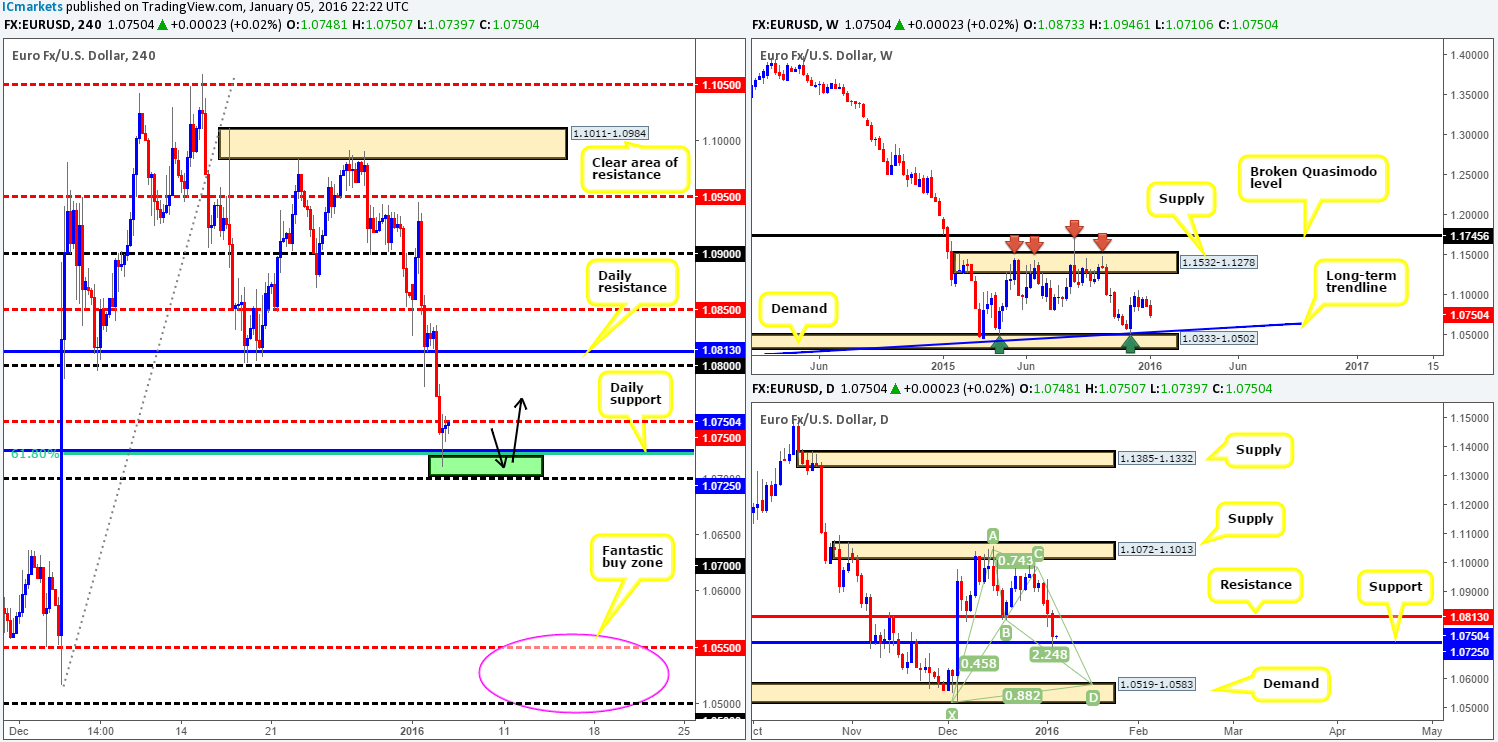
The EUR continued to sink against the U.S. dollar on Tuesday, consequently punching through bids around daily support (now resistance) at 1.0813, psychological support 1.0800 and mid-level support 1.0750. Trade ended with price defending a daily support level coming in at 1.0725, which, as you can see, merges beautifully with the 61.8% Fibonacci level at 1.0722.
Given that price is now trading from daily support (see above), and weekly action shows price loitering mid-range between supply at 1.1532-1.1278 and demand drawn from 1.0333-1.0502, our prime focus will be on longs today. Right now, we can see that offers have likely been filled around 1.0750, which could send prices back down to the daily support. Should this happen, our team will begin looking for lower timeframe buy entries into this market within the green box planted between the above said daily level and psychological support 1.0700, targeting 1.0750, followed closely by 1.0800/daily resistance 1.0813.
On the other hand, market participants may be attracted to the bullish Harmonic Bat pattern currently forming on the daily chart. The completion point of this pattern converges with daily demand at 1.0519-1.0583, and lurks very close to weekly demand at 1.0333-1.0502 as well. Therefore, to include the upper limits of each higher timeframe structures, our buy zone on the H4 chart for this trade (if it comes to fruition) would be between 1.0550/1.0500 (pink circle). With this being the case, a close below 1.0800 today will shift our attention to shorting this market if a confirmed retest of this barrier is seen thereafter, targeting our (pink circle) H4 buy zone just mentioned.
Levels to watch/live orders:
- Buys: 1.0725/1.0700 [Tentative – confirmation required] (Stop loss: Dependent on where one confirms this area). 1.0550/1.0500 [Tentative – confirmation required] (Stop loss: Dependent on where one confirms this area).
- Sells: Watch for bids to be consumed around 1.0725/1.0700 and then look to trade any retest of this area thereafter (lower timeframe confirmation preferred).
GBP/USD:
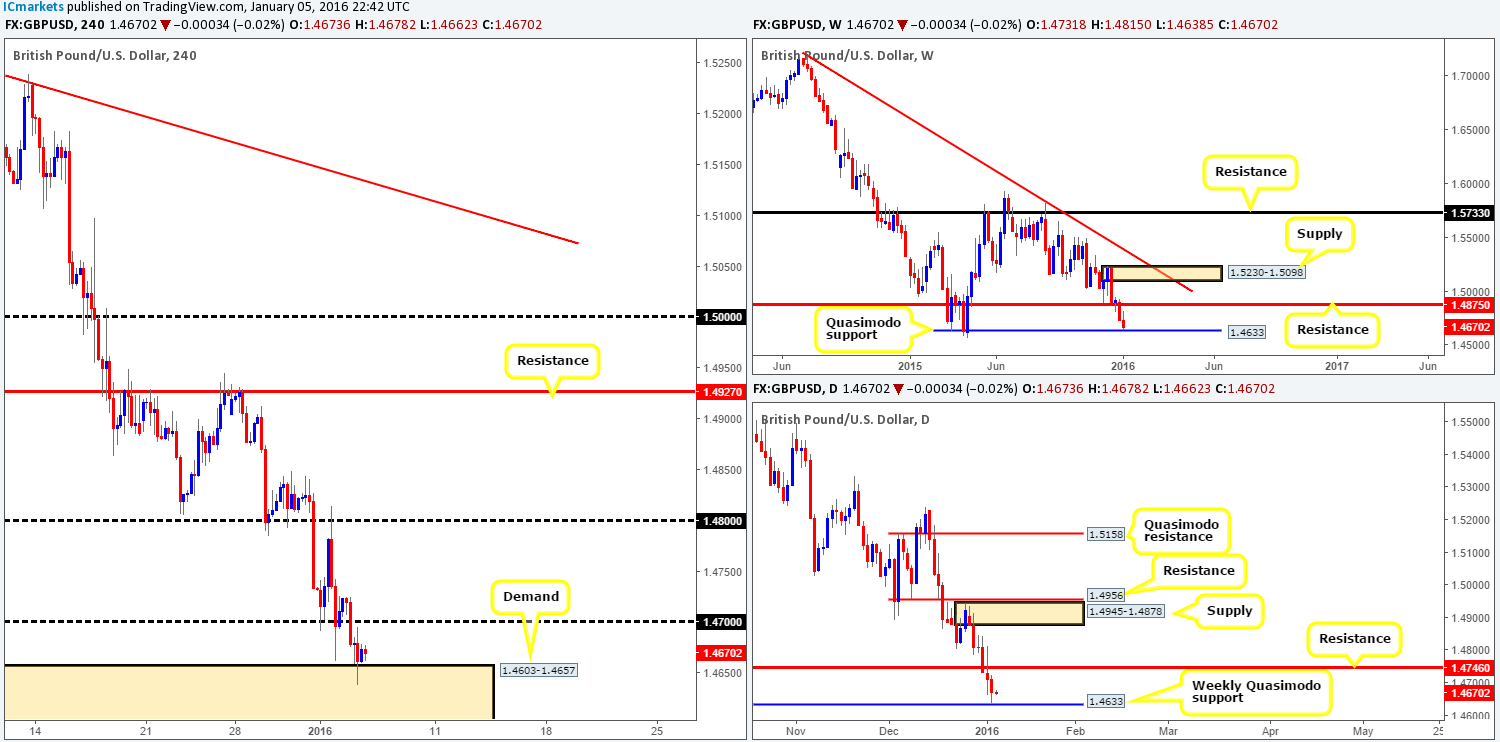
For those who read our previous report (http://www.icmarkets.com/blog/tuesday-5th-january-daily-technical-outlook-and-review/), you may recall us mentioning that we placed a pending buy order just above the current H4 demand (1.4603-1.4657) at 1.4658 with a stop set at 1.4597. The main reason for us choosing to touch trade this H4 area is simply due to the fact that it converges nicely with a weekly Quasimodo support level drawn from 1.4633.
As can be seen from the H4 chart, our order has been filled and we’re now patiently waiting to see if price will reach target one – psychological resistance 1.4700. Should this happen today, and price breaks beyond our primary target, our team plans to trail the remaining position behind supports as/if and when they form. Reason being is this pair could potentially rally some distance owing to higher timeframe involvement.
Levels to watch/live orders:
- Buys: 1.4658 [LIVE] (Stop loss: 1.4597).
- Sells: Flat (Stop loss: N/A).
AUD/USD:
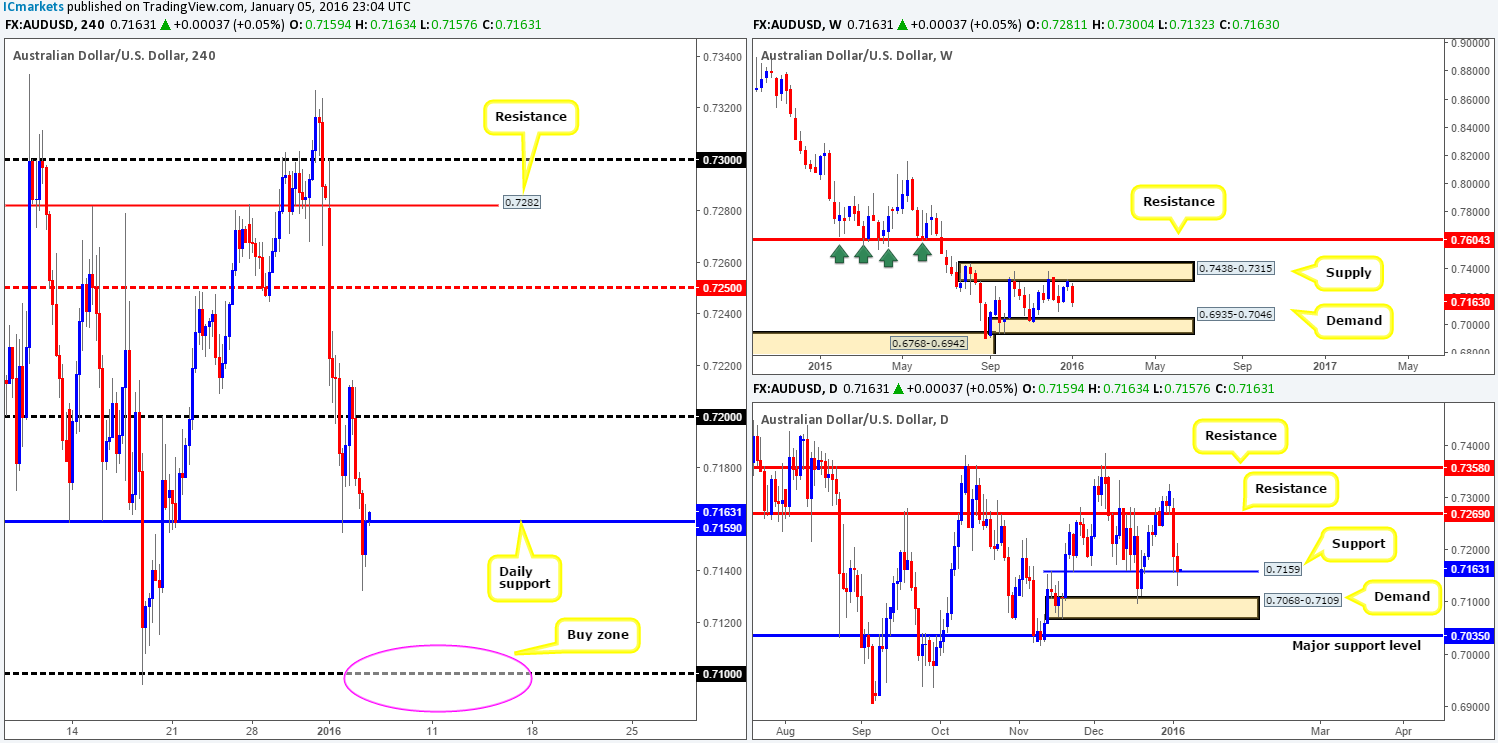
Although the AUD initially closed above the psychological level 0.7200 (no lower timeframe price action was seen to trade long here), the pair took yet another beating yesterday with speculation of further slowdown in China. From the H4 chart, it’s clear to see that this bearish assault dragged price below daily support at 0.7159 during the U.S. session, consequently tagging in bids from H4 demand at 0.7115-0.7134 and forcing price to end the day just above daily support.
Due to the spike seen below the daily barrier (see daily chart) sell stops were likely filled here. In addition to this, the majority of bids have more than likely been filled from the aforementioned H4 demand, and with price trading heavily from weekly supply at 0.7438-0.7315, there is, in our humble opinion, a possibility that further downside will be seen today.
In light of this technical view, we’re going to be keeping a close eye on lower timeframe action around the daily level. Should we manage to sell from here, we’ll be looking to liquidate shorts around the 0.7100 region, which is, in itself, a nice-looking buy zone. Not only is 0.7100 considered support, it’s also bolstered by daily demand at 0.7068-0.7109. Therefore, to long from here, stops might be best placed below this daily barrier to avoid any nasty fakeouts below 0.7100. Waiting for lower timeframe confirmation at this round number is still advised due to the fact that price could ignore the daily demand altogether and head for weekly demand just below it at 0.6935-0.7046.
Levels to watch/live orders:
- Buys: 0.7100 region [Tentative – confirmation required] (Stop loss: best to be placed below daily demand around the 0.7065 area).
- Sells: 0.7159 area [Tentative – confirmation required] (Stop loss: Dependent on where one confirms this zone).
USD/JPY:
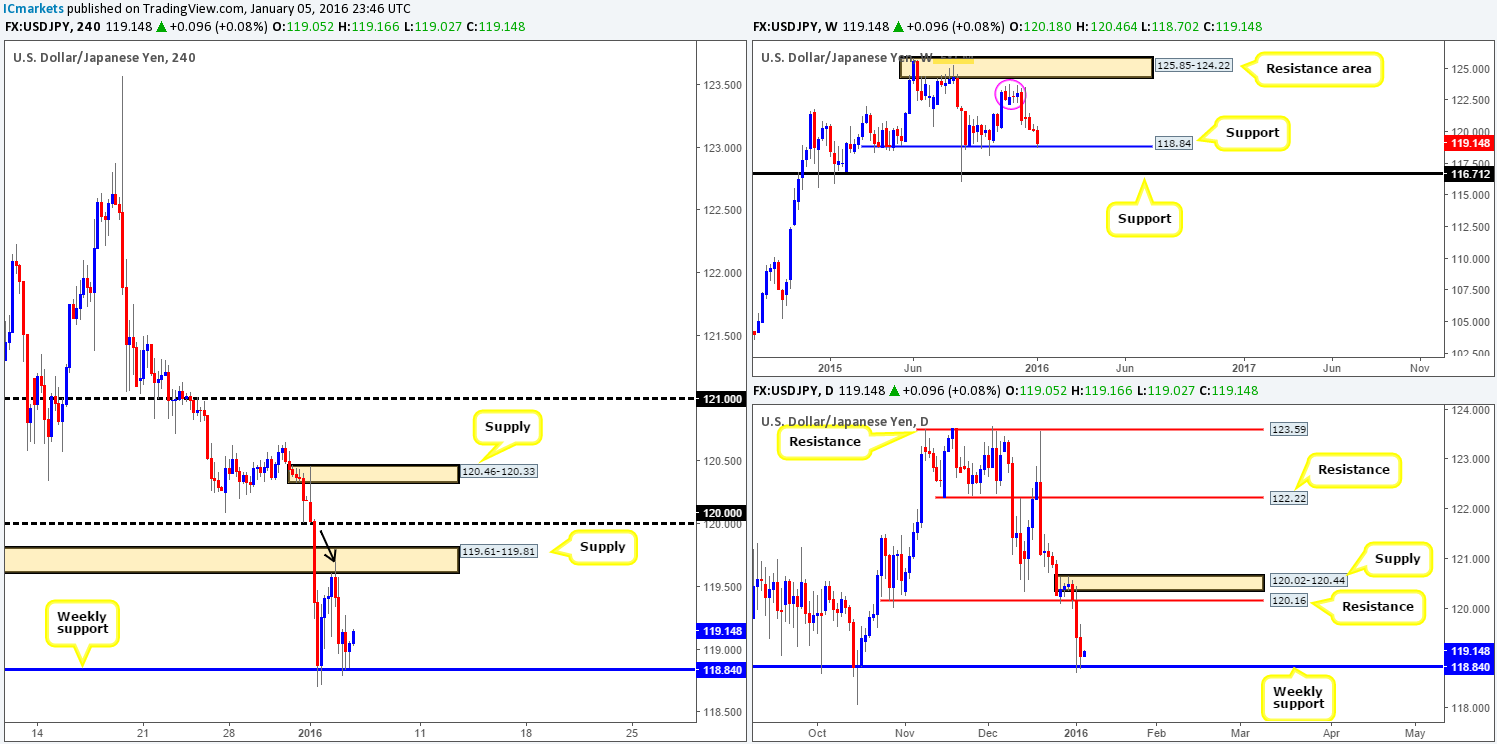
Beginning with the weekly timeframe this morning, we can see that the USD/JPY remains teasing support at 118.84. In the event that this barrier holds, little resistance is seen until around the 122.10 (pink circle) area. By the same token, weekly support is the primary support level to watch on the daily timeframe, the only difference here is upside targets come in around 120.16/ 120.02-120.44.
Turning our attention to the H4 timeframe, however, price appears to be beginning to carve out a consolidation zone between the above said weekly support and a H4 supply zone given at 119.61-119.81. With some of the offers likely taken out from this supply (black arrow), entering long from the weekly level could be a possibility today. However, we would strongly advise only trading here with the backing of a lower timeframe buy setup, and, if the trade goes in your favor, taking partial profits at the H4 supply due to the possibility of residual offers lurking within this zone. If this H4 supply has the strength to hold the market lower against a weekly level, then it is certainly not a hurdle to be ignored!!!
Levels to watch/live orders:
- Buys: 118.84 region [Tentative – confirmation required] (Stop loss: dependent on where one confirms this level).
- Sells: Flat (Stop loss: N/A).
USD/CAD:
A quick look at the weekly chart on the USD/CAD shows that the bears are having a hard time finding their feet within supply drawn from 1.4190-1.3794, with very little selling interest seen over the past three weeks or so. Zooming in and looking at the daily timeframe, nonetheless, supply at 1.4001-1.3904 suffered a small breach yesterday but is still, for the time being, holding firm. Assuming the majority of the buy stops are consumed here, the path north may be clear (at least on this timeframe) for price to challenge resistance at 1.4103.
Down on the H4 timeframe, we can see that support from 1.3914 allowed the bulls to push this market higher during the course of yesterday’s sessions. This, as you can see, saw price collide with the large psychological resistance 1.4000, peaking at 1.4019 before pulling back into the close 1.3995.
Given the strength of this pair’s trend right now, and the fact that price broke above daily supply at 1.4001-1.3904, our team is certainly in favor of the buy-side of this market right now. Despite this, we would like to see market action CLOSE above and retest 1.4000 before looking to join this trend, and with H4 support at 1.3977 holding strong at the moment, it does not look like we’ll have too long of a wait!
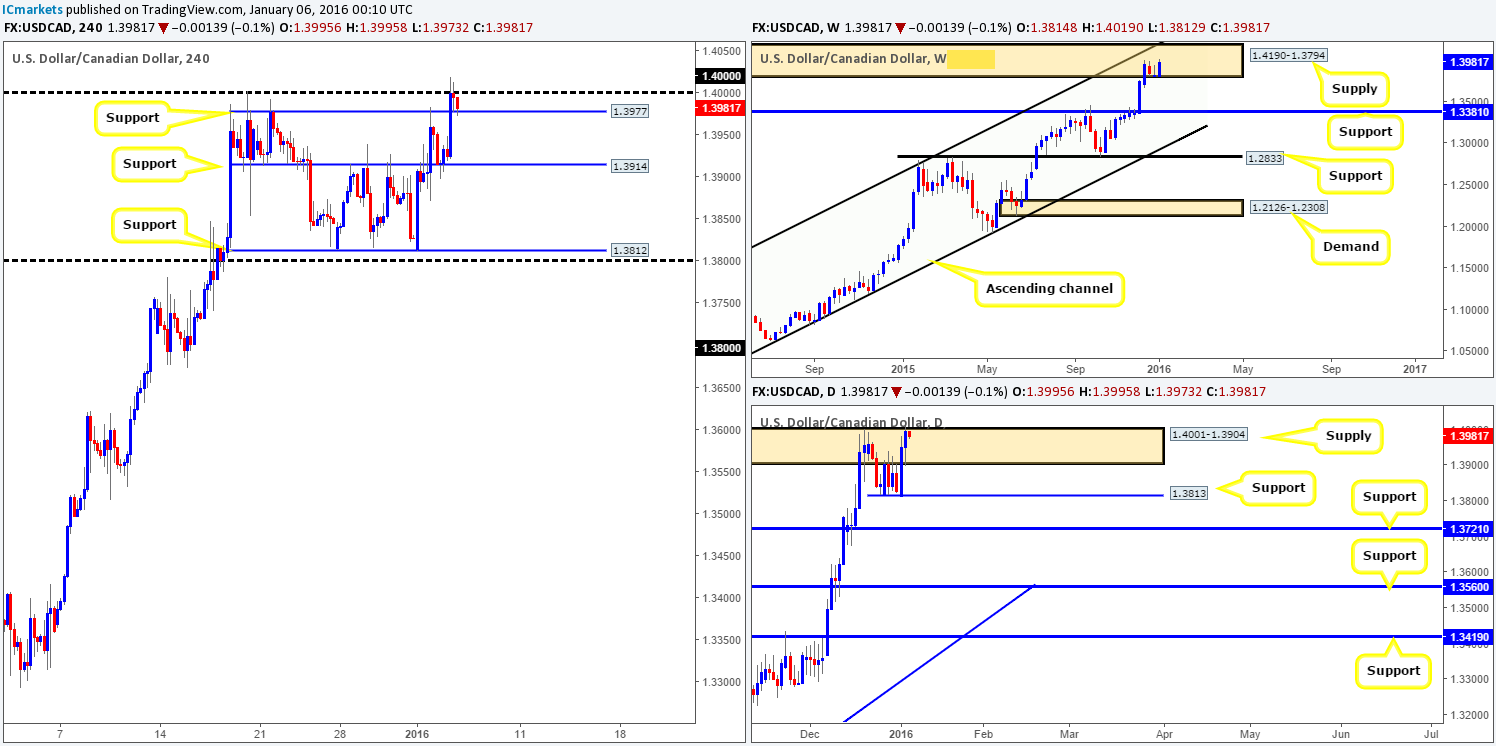
Levels to watch/live orders:
- Buys: Watch for offers to be consumed around 1.4000 and then look to trade any retest of this level thereafter (lower timeframe confirmation preferred).
- Sells: Flat (Stop loss: N/A).
USD/CHF:
Amid yesterday’s trade, the USD/CHF pulled back slightly going into the European session to a low of 1.0007 and then followed with an aggressive rally throughout the London morning trade. The bullish assault pulled the pair up to H4 resistance at 1.0123 (nice history attached to this number), which converges with both psychological resistance 1.0100 and the 61.8% Fibonacci level at 1.0122.
This pair is now a little difficult to read in our opinion. On the one hand, weekly action is within touching distance of connecting with the recently faked supply at 1.0239-1.0131, and on the other, daily movement cleared supply (now demand) at 0.9989-1.0043 and potentially opened the gates for further upside.
Given the points made above, we’re afraid we’re going to have to side with the weekly chart on this one today and look to short with lower timeframe confirmation from 1.0100/1.0123 down to parity. Why parity and not the H4 demand circled in pink at 1.0007-1.0025? This demand has ‘fakeout’ written all over it due to it being located just above such a large number. As a result, 1.0000 could be a nice place to look for a confirmed bounce to take place, as it’s located within daily demand at 0.9989-1.0043.
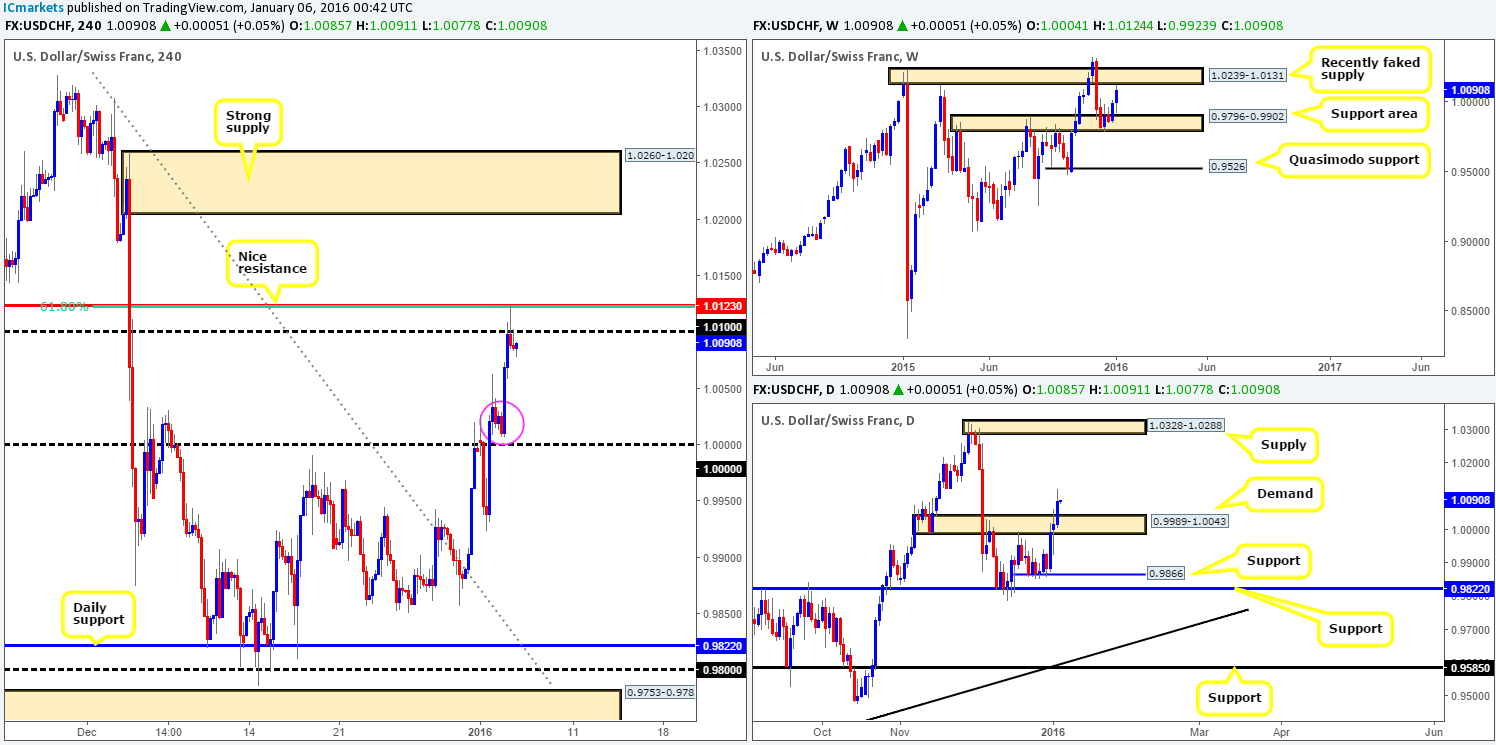
Levels to watch/live orders:
- Buys: 1.1000 [Tentative – confirmation required] (Stop loss: dependent on where one confirms this level).
- Sells: 1.0123/1.0100 [Tentative – confirmation required] (Stop loss: dependent on where one confirms this area).
DOW 30:
Yesterday’s action on the DOW saw H4 price enter into a whipsaw frenzy around the weekly support level coming in at 17135. This likely caused a ton of confusion to lower timeframe traders and possibly took out a monumental amount of stops along the way!
Yet, in spite of this, price managed to close the day above this weekly barrier with the help of daily demand at 16889-17056 (see daily chart). Providing that the bulls maintain their position here, we see no reason not to continue looking to enter long (with lower timeframe confirmation) from this weekly hurdle (as per the green arrows). Assuming that we manage to pin-point a long setup from here, the H4 resistance coming in at 17440 will be the first take-profit level. Be that as it may, this hurdle is quite a way off so our team will look to trail the stop to target, as there’s nothing worse than letting a winning trade turn into a loser!
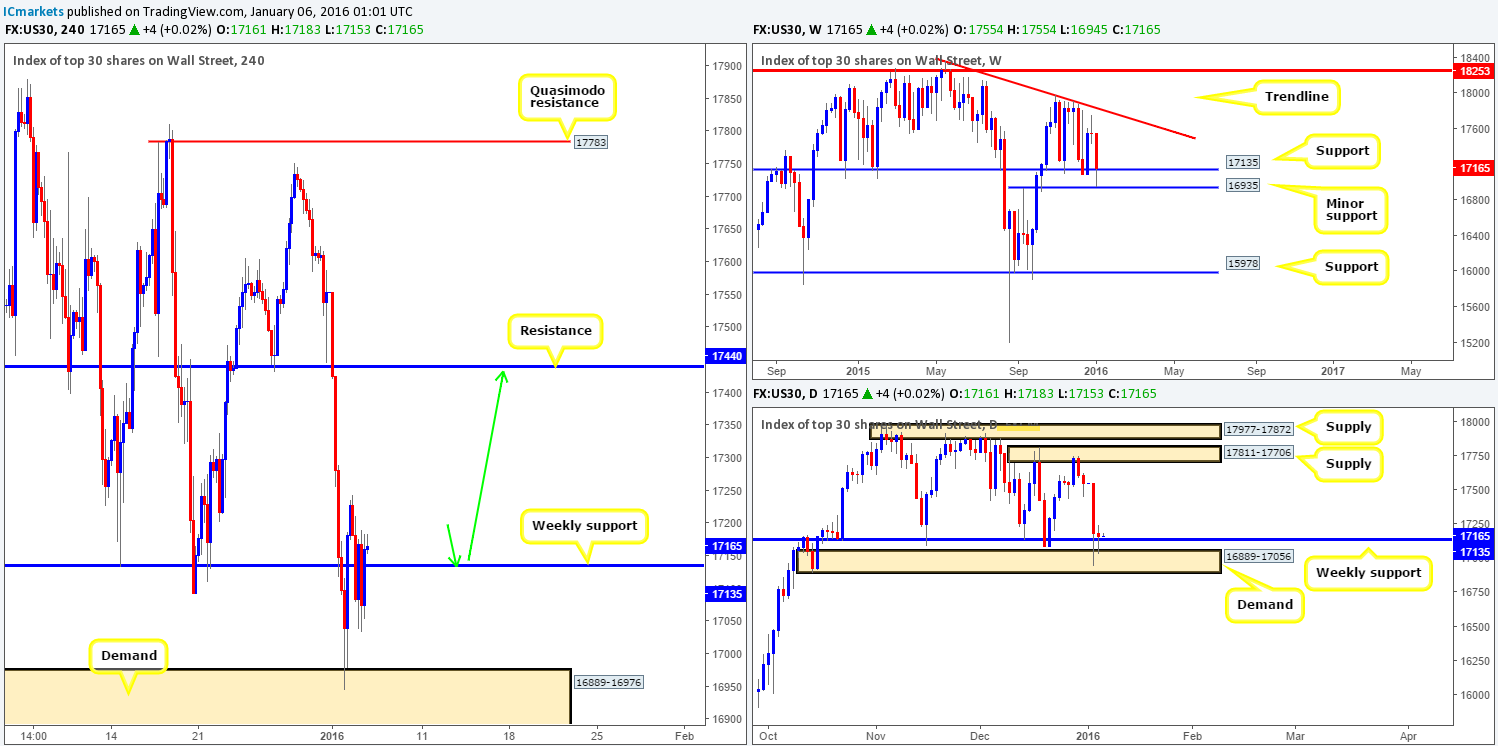
Levels to watch/live orders:
- Buys: 17135 [Tentative – confirmation required] (Stop loss: dependent on where one confirms this level).
- Sells: Flat (Stop loss: N/A).
XAU/USD: (Gold)
Following Monday’s safe-haven rush for Gold, yesterday’s action painted a calmer picture. Price, at least from the H4 chart, recorded little movement with session highs coming in at 1081.9 and lows drawn from 1072.5.
With the above in mind, we can see that weekly activity remains bouncing above demand at 1026.5-1054.8 (converges beautifully with the lower limits of the current wedge pattern [1180.1]). Meanwhile, price on the daily timeframe (can be seen on H4 too) shows resistance is looming above current price at 1084.5. However, taking a short from here might not be the best path to take considering the weekly position (see above), unless, of course, it boasts extremely attractive lower timeframe bearish action.
A level that we are really beginning to like, however, is the H4 support drawn at 1067.3. Not only has this barrier provided significant support and resistance to this market since the beginning of December 2015, it also merges with a 61.8% Fibonacci level at 1067.6. In our experience, barriers such as these SHOULD NOT be ignored. In spite of this, one still has to be cautious here and trading this level would only be valid to us with supporting lower timeframe buying strength. The reason for why comes from the possibility that Gold may continue lower to connect with the top side of weekly demand see below at 1054.8.
Levels to watch/live orders:
- Buys: 1067.3 [Tentative – confirmation required] (Stop loss: dependent on where one confirms this level).
- Sells: 1084.5 [Tentative – extremely attractive confirmation required] (Stop loss: dependent on where one confirms this level).


