
EUR/USD:
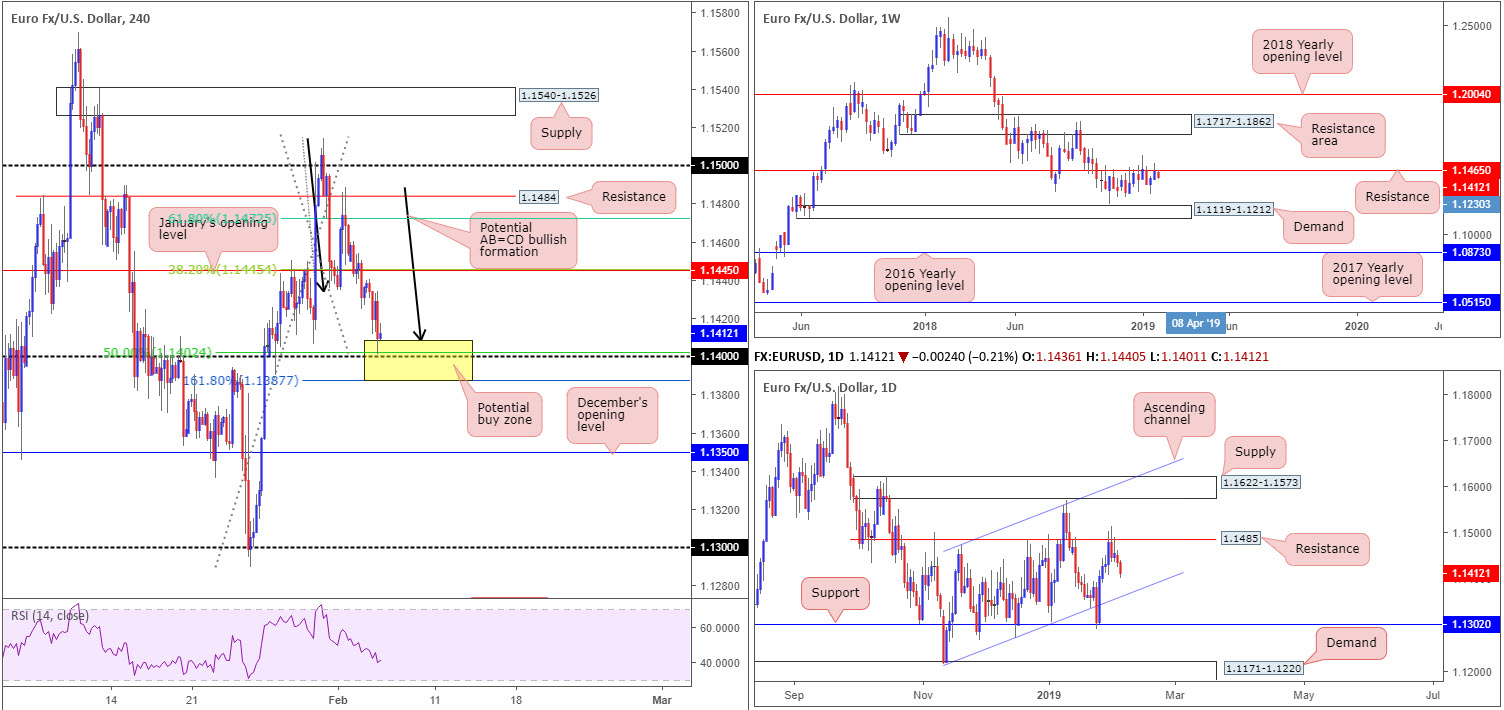
The single currency weakened in response to a robust US dollar Tuesday, challenging levels visible just north of 1.14 on the H4 timeframe.
For folks who read Tuesday’s briefing you may recall the piece emphasising 1.1387/1.1408 as a possible buy zone (yellow – comprised of a H4 AB=CD bullish formation at 1.1408, a 50.0% H4 support value at 1.1402, a round number at 1.14 and a 161.8% H4 Fibonacci ext. point at 1.1387: the extreme point of the AB=CD play). As is evident from the chart price action is testing the top edge of this zone, as we write. However, as the research team also pointed out in Tuesday’s report, a fakeout beneath this area to a nearby daily channel support (extended from the low 1.1215) could take shape before active buyers make an appearance.
While 1.1387/1.1408 is incredibly attractive in view of its surrounding confluence, traders might want to acknowledge weekly price also fading a resistance level priced in at 1.1465. From this angle, the next support target falls in at demand drawn from 1.1119-1.1212.
Areas of consideration:
Should the H4 AB=CD bullish pattern play out, as expected, the first take-profit target is the 38.2% Fibonacci resistance value at 1.1445: January’s opening level, followed by the second take-profit target falling in around the 61.8% Fibonacci resistance value at 1.1472, positioned south of a H4 resistance level at 1.1484.
As there’s a chance of a fakeout forming beneath the H4 area highlighted above, though, the research team still feels waiting for the H4 candles to chalk up a bullish candlestick pattern before pulling the trigger is worth considering. This recognises buyer intent, and at the same time provides entry and stop parameters to work with.
Today’s data points: Limited.
GBP/USD:
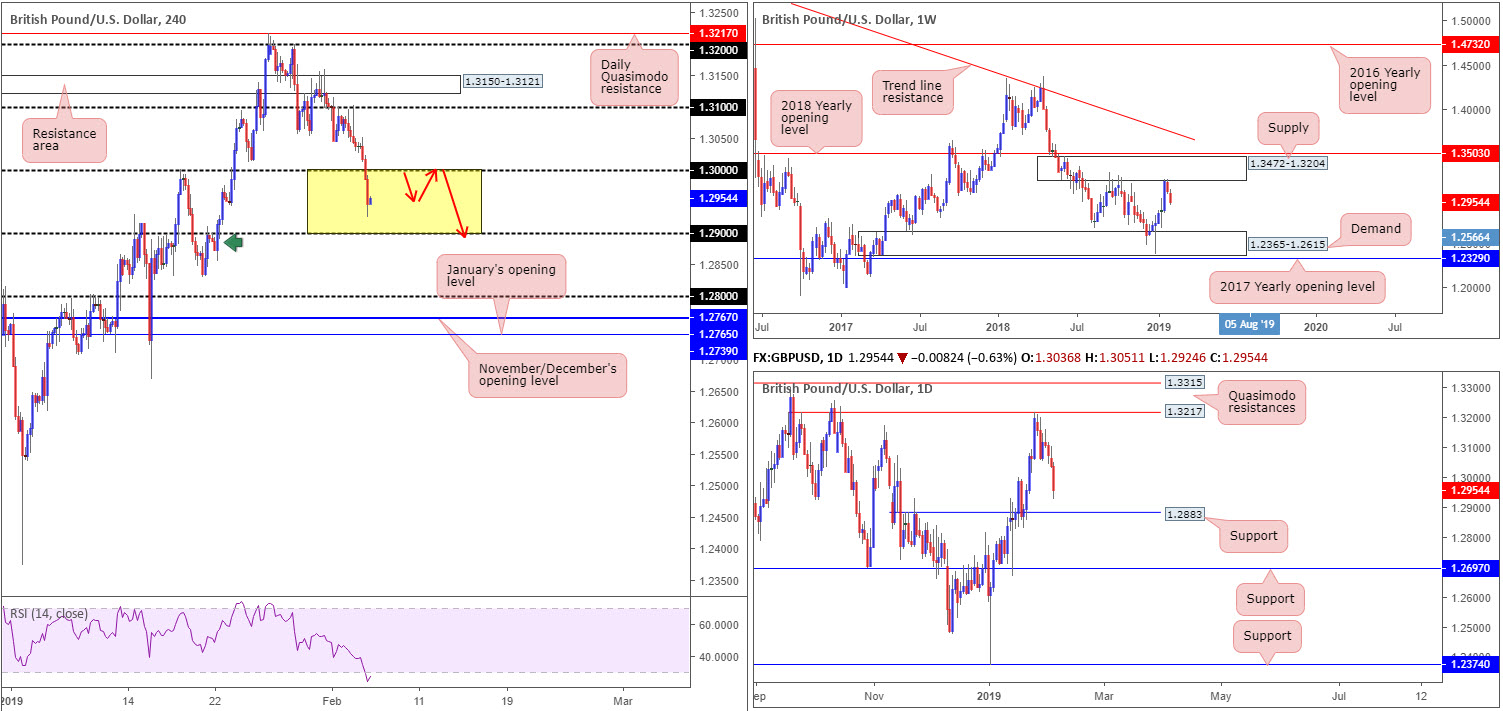
Pound sterling fell sharply following UK services PMI figures Tuesday. At 50.1 in January, the headline seasonally adjusted IHS Markit/CIPS UK Services PMI Business Activity Index was down from 51.2 in December and only fractionally above the crucial 50.0 no-change value. The latest reading was the lowest for two-and-a-half years and the second-weakest since December 2012 (Markit). Brexit uncertainties added to cable’s woes as UK PM May hit the wires, defending the need for ‘legally binding changes’ to the Irish backstop. In addition to this, May’s spokesman confirmed the PM is to meet with EU’s Tusk and Juncker on Thursday.
After tripping stops beneath key figure 1.30 on the H4 scale, the floor opened and price clocked lows of 1.2924. The next port of call on this timeframe can be seen around the 1.29 handle, which happens to merge with an area of demand around 1.2888ish (green arrow).
Having seen weekly price extending its downside presence from supply at 1.3472-1.3204, with room seen to press as far south as demand coming in at 1.2365-1.2615, along with daily price displaying room to trade as low as support at 1.2883, further selling is likely in store.
Areas of consideration:
On account of recent developments, the research team has eyes on the 1.30 level today in the form of a retest play (red arrows).
In the event the above comes to fruition, targeting the 1.29 handle is a logical base, shadowed closely by daily support drawn from 1.2883.
Conservative traders may opt to wait and see if H4 price chalks up a bearish candlestick pattern off 1.30 at the retest. By having this in the bag, not only do traders boast additional confirmation sellers are potentially willing, the structure also provides entry and stop parameters.
Today’s data points: Limited.
AUD/USD:
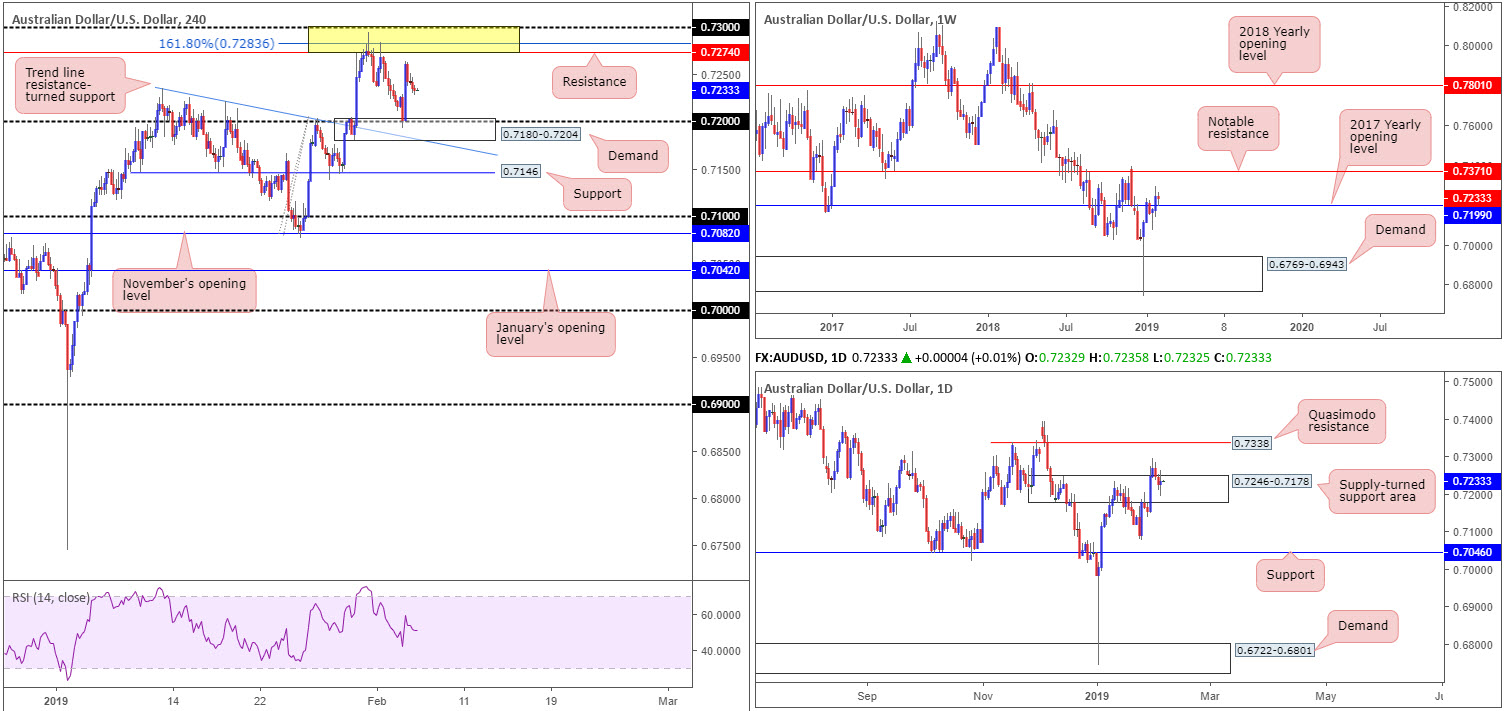
In the early hours of Tuesday, the markets experienced a bout of selling amid poor Australian retail sales and a larger-than-expected trade surplus. This pulled the AUD/USD in the direction of the 0.72 handle, though swiftly found support off lows at 0.7193.
Australian retail turnover fell 0.4 per cent in December 2018, seasonally adjusted, according to the latest Australian Bureau of Statistics (ABS) Retail Trade figures. This follows a 0.5 per cent rise in November 2018.
In seasonally adjusted terms, the balance on goods and services was a surplus of $3,681m in December 2018, an increase of $1,425m on the surplus in November 2018.
As is evident from the H4 timeframe, the 0.72 handle fuses with a nice-looking demand base formed at 0.7180-0.7204, which collectively held price higher. Upside was exacerbated on the latest RBA Meeting’s Minutes, as policymakers maintained the wording referred to future rate moves, reiterating the cash rate will likely be moved to the upside rather than to the downside.
For traders who read Tuesday’s briefing you may recall the aforementioned H4 demand zone was highlighted as a potential buy zone. This was largely due to its connection to higher-timeframe structure. Weekly price is seen hovering above its 2017 yearly opening level at 0.7199 following last week’s advance. With sellers likely emptied from this neighbourhood, a retest of 0.7199 as support has resistance at 0.7371 in the crosshairs this week. Recent buying, as is evident from the daily timeframe, destroyed supply at 0.7246-0.7178 Wednesday and later retested the zone as a support area Friday. Assuming buyers hold ground here, upside momentum towards Quasimodo resistance at 0.7338 might be observed.
Areas of consideration:
Well done to any of our readers who managed to jump aboard this move.
Going forward, further buying is still possibly in store. Not only do we have room to drive higher on the H4 scale towards resistance marked in yellow at 0.73/0.7274 (comprised of a round number at 0.73, a 161.8% Fibonacci ext. point at 0.7283 and a resistance level at 0.7274), both weekly and daily timeframes, as expressed above, also display room to advance northbound.
Therefore, should we retest the noted H4 demand today, another wave of buying could materialise. Should we continue climbing higher from current price, however, drilling down to the lower timeframes and searching for a local resistance-turned support to trade is certainly an option, targeting the H4 area of resistance mentioned above at 0.73/0.7274.
Today’s data points: Limited.
USD/JPY:
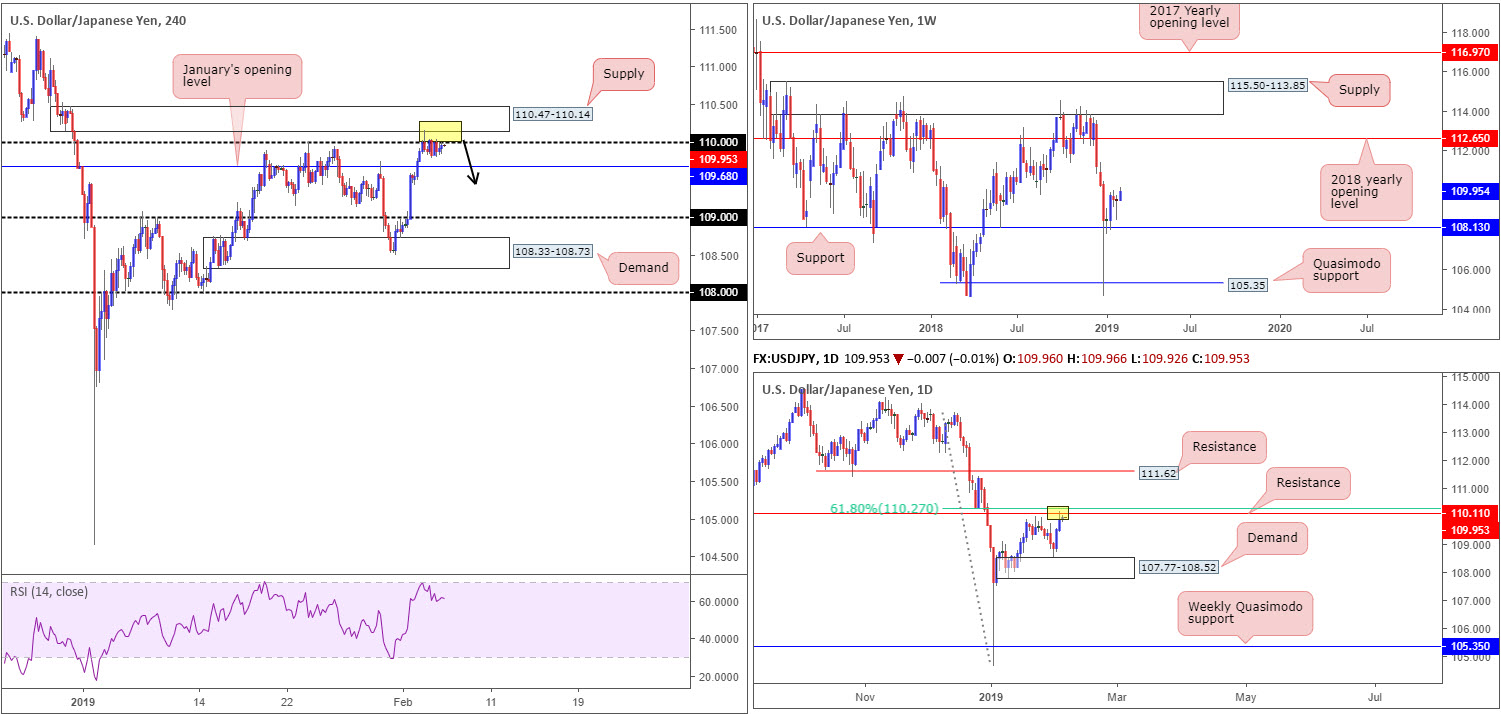
Struggling to feed off the recent advance in US equities, USD/JPY action Tuesday sported a lacklustre range at the underside of 110.
In light of recent movement proving somewhat fruitless, much of the following segment will echo thoughts put forward in Tuesday’s briefing.
In previous writings, the piece underscored H4 supply coming in at 110.47-110.14 as an area of interest.
The push above 110 sited a few pips beneath it not only trips stop-loss orders from traders attempting to fade the psychological mark, which, when filled, become buy orders to sell in to, breakout buyers will also have likely attempted to join the movement here. This offer of liquidity to sell to, coupled with daily resistance seen plotted at 110.11 (and its nearby 61.8% Fibonacci resistance value at 110.27), has, as you can see, brought price action lower from the noted H4 supply.
Areas of consideration:
Traders who believed the H4 supply and daily resistance was enough evidence to draw sellers’ attention will likely already be short this market with stop-loss orders planted just north of 110.47. Once, or indeed if, the H4 candles reclaim 109.68 to the downside, this may be a good opportunity to begin thinking about reducing risk to breakeven and taking partial profits off the table.
Traders who feel the need to trade the H4 supply based on candle confirmation due to where we’re trading on the weekly timeframe (above support at 108.13 with room seen to rally as far north as the 2018 yearly opening level at 112.65), the bearish fakeout candle developed on the fakeout above 110 is likely enough evidence to suggest further selling (entry/stop parameters can be defined off of this structure), hopefully beyond January’s opening level at 109.68.
Today’s data points: Limited.
USD/CAD:
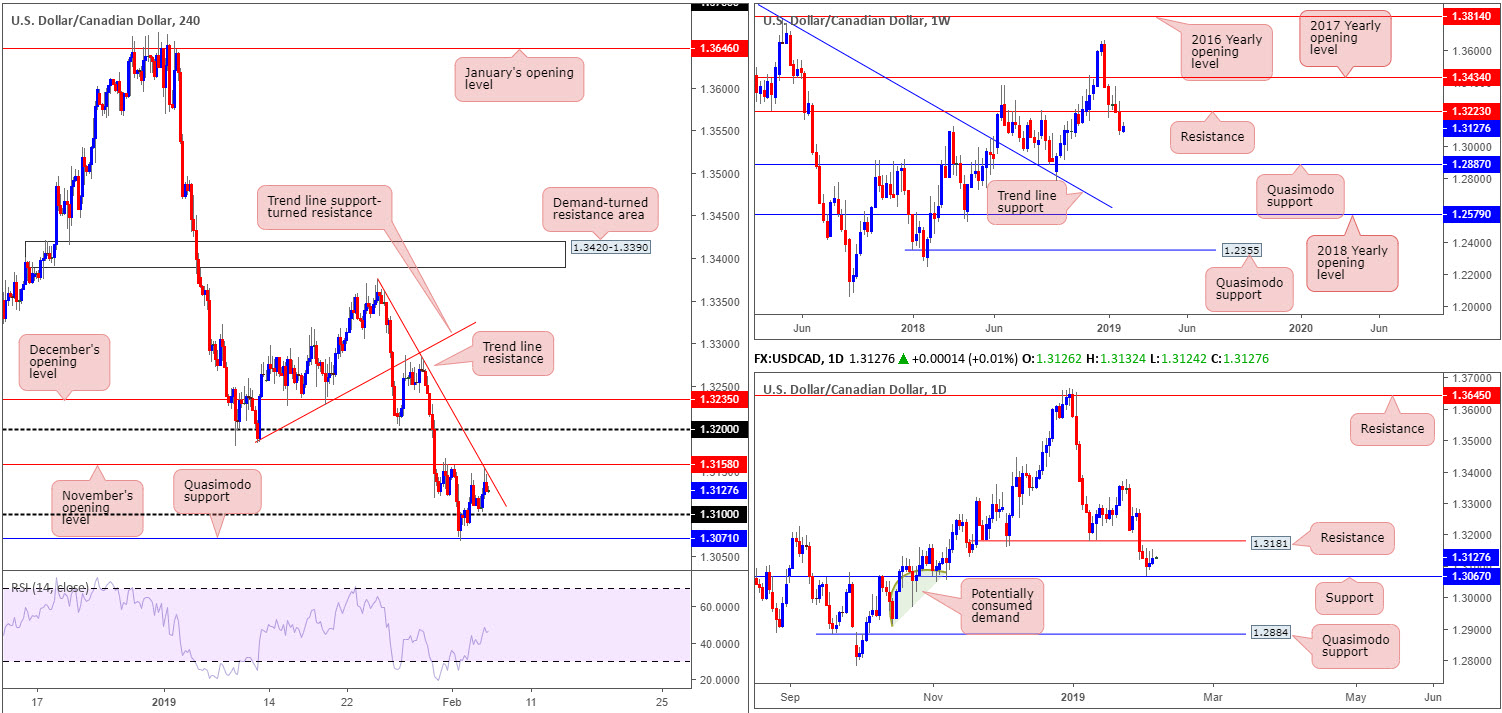
A combination of a healthy US dollar across the board and a diminishing oil market encouraged a USD/CAD bid Tuesday. Leaving the 1.31 handle unchallenged on the H4 timeframe the pair rose higher, though encountered active sellers a few pips south of November’s opening level at 1.3158: at a trend line resistance (extended from the high 1.3375. In the event the market continues to explore higher ground, however, the 1.32 handle is next in line as a viable resistance beyond 1.3158.
Turning over a page to weekly structure, traders will likely acknowledge a negative climate. Price failed to shield support priced in at 1.3223 last week, causing a substantial near-full-bodied bearish candle to form. To the left, the research team notes limited support (or demand) until shaking hands with a Quasimodo base coming in at 1.2887.
The story on the daily timeframe, on the other hand, shows price action meandering between resistance at 1.3181 and support plotted at 1.3067.
Areas of consideration:
In light of recent developments, a continuation move lower from the aforementioned H4 trend line resistance is a possibility, having seen room to extend south on the weekly timeframe.
The flip side to this, nonetheless, is the H4 Quasimodo support at 1.3071, which happens to converge with daily support at 1.3067, could offer traders a platform to enter long from.
Irrespective of the direction selected today, traders will have to contend with opposing structure. Technically speaking, though, higher-timeframe structure generally takes precedence over its smaller counterparts. Therefore, selling could be the higher-probability move.
Should the market close beneath the current H4 Quasimodo support, a selloff towards 1.30 on the H4 timeframe (not seen on the screen) could be seen. Entering short on either the breakout candle or a retest play off the underside of 1.3071 (preferably on the back of a bearish candlestick formation – entry/stop parameters can be defined according to this structure) are two prospects potentially worth exploring.
Today’s data points: Gov. Council Member Lane Speaks; CAD Ivey PMI.
USD/CHF:
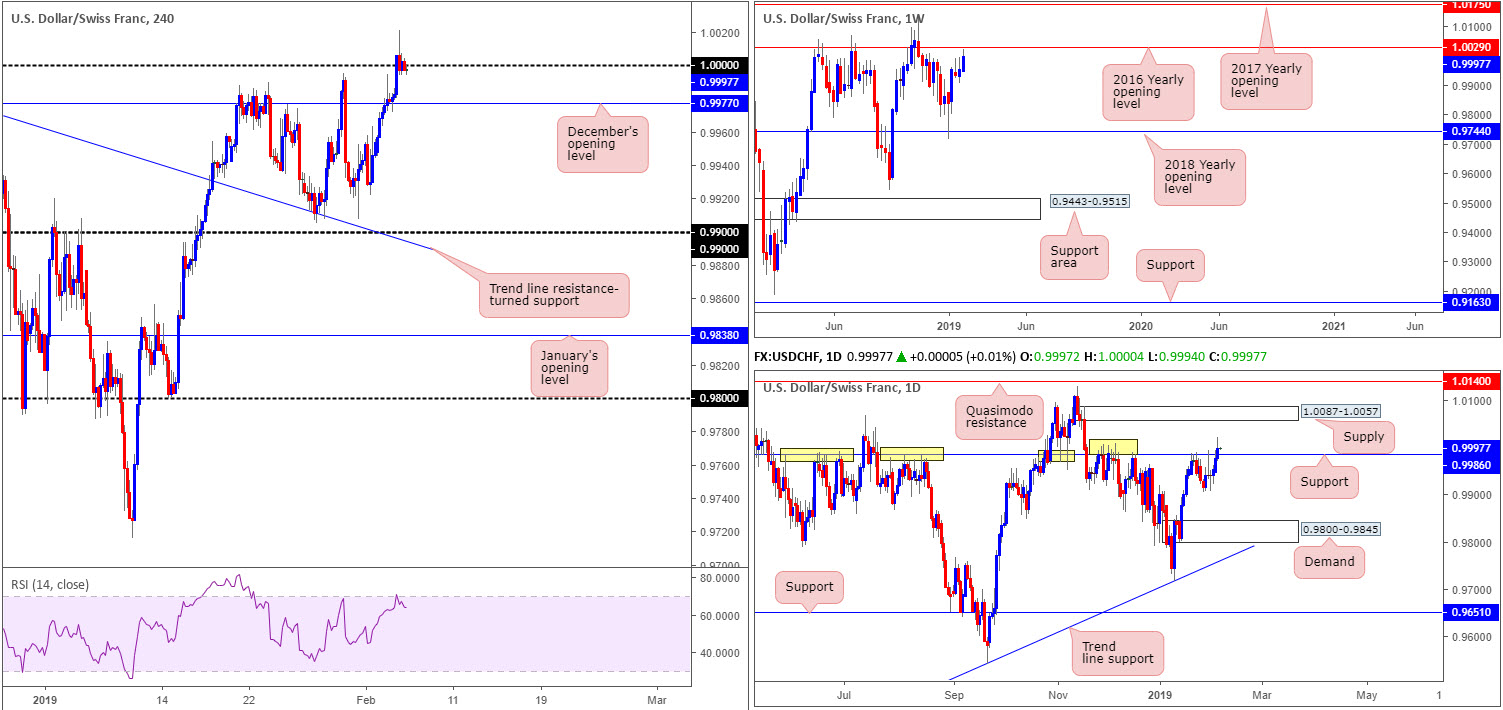
Broad-based US dollar bidding Tuesday, which happened to pull the DXY above its 96.00 mark, has positioned the current weekly candle on the USD/CHF within shouting distance of the 2016 yearly opening level at 1.0029. In corroboration with weekly movement, daily activity punctured resistance priced in at 0.9986 (now acting support), possibly freeing upside towards supply coming in at 1.0087-1.0057.
Against the backdrop of the higher-timeframe’s position, the H4 candles are, after overthrowing December’s opening level at 0.9977, visibly seen engaging with 1.0000 (parity). The consolidating phase evident around this number should not come as much of a surprise. 1.0000 will be a watched number across the board and, therefore, attract a substantial amount of interest from both sides of the market. It might also be worth pencilling in the RSI indicator is visibly fading its overbought value.
Areas of consideration:
With weekly sellers eyeing the 2016 yearly opening level at 1.0029, along with daily price crossing above resistance at 0.9986 and poised to accelerate north towards supply at 1.0087-1.0057, selling 1.0000 is challenging. With this being the case, waiting for a decisive H4 close above 1.0000 to form that’s followed up with a retest as support (preferably by way of a bullish candlestick pattern as this provides a defined structure to base entry and stops from) is, likely enough evidence to suggest a long, targeting 1.0029, followed by the underside of the current daily supply.
Today’s data points: Limited.
Dow Jones Industrial Average:
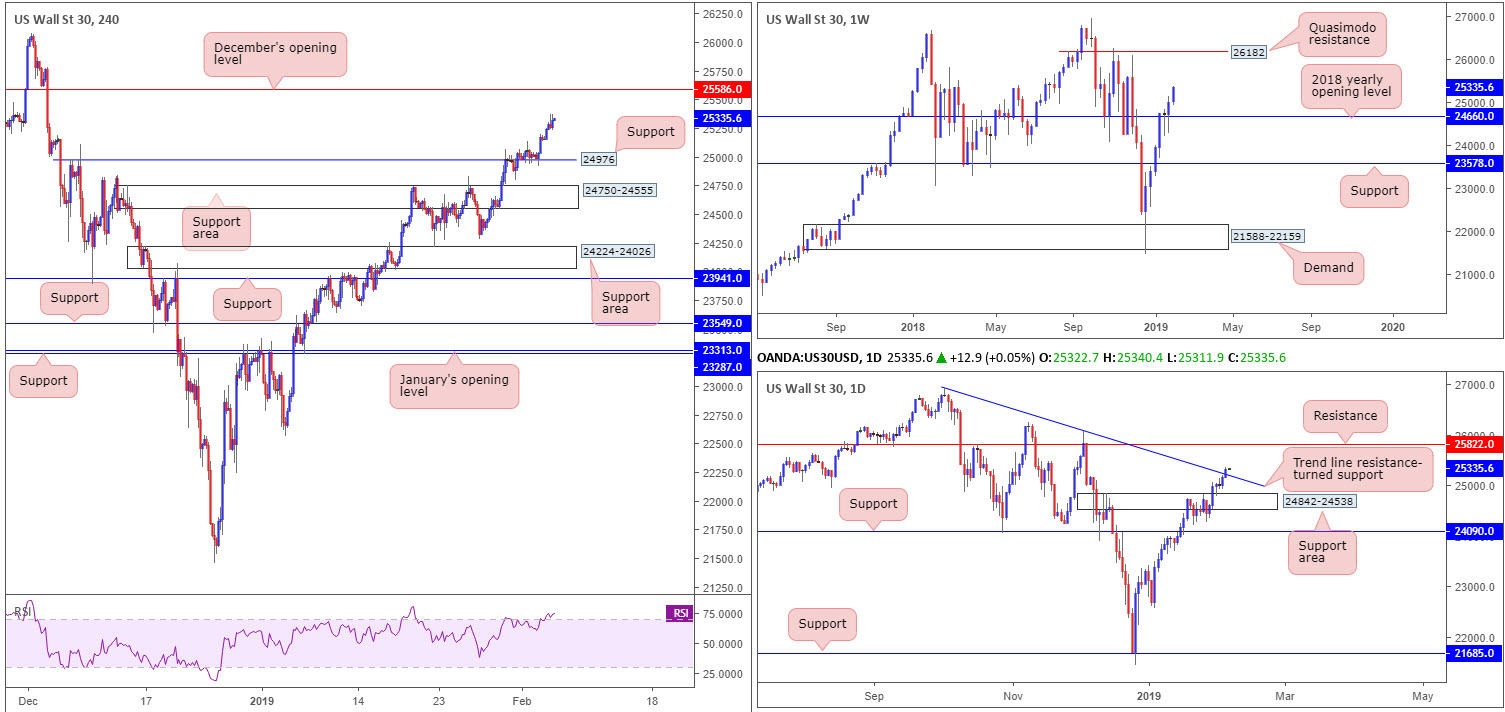
US equities moved into a higher gear Tuesday, following Monday’s retest off H4 support at 24976. Well done to any of our readers who managed to hold their long from here as the aforementioned support was a noted level to watch for potential longs in recent reports.
Further buying towards December’s opening level at 25586 located on the H4 timeframe is a strong possibility. Supporting this, the research team notes weekly price displaying little in terms of resistance until crossing swords with a Quasimodo barrier at 26182. What’s also notable from a technical perspective is daily price recently conquered nearby trend line resistance (extended from the high 26939), freeing space to the upside towards resistance coming in at 25822.
Areas of consideration:
As of current price there are no immediate opportunities to trade, according to our technical studies.
Those who remain long from 24976 have likely reduced risk to breakeven after daily price tested its trend line resistance. Now we’ve effectively cleared this descending resistance, 25822, as highlighted above, is the next resistance seen on the daily scale.
So, in terms of upside targets for those currently long, the next area of concern is December’s opening level at 25586, followed then by the daily resistance mentioned above at 25822.
Today’s data points: Limited.
XAU/USD (GOLD):
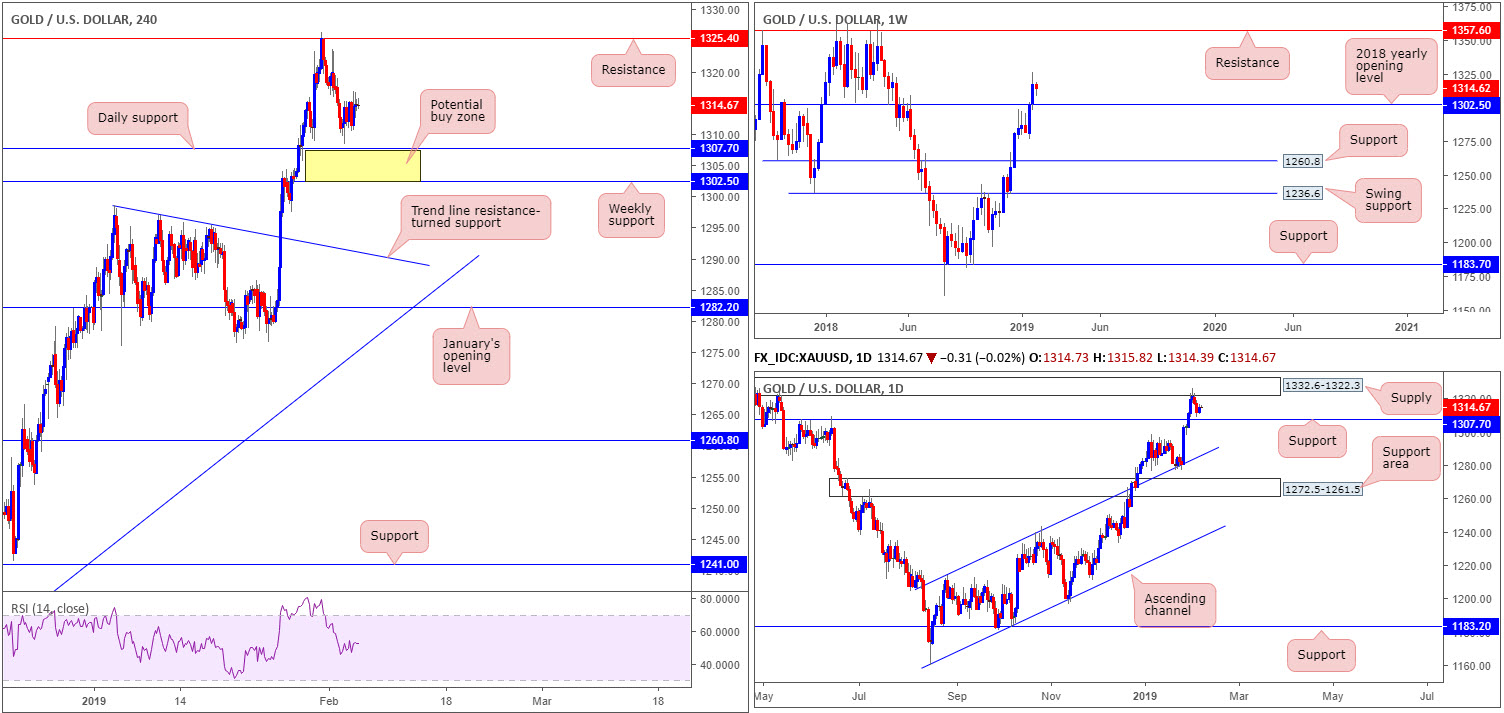
Over the course of Tuesday’s sessions, the price of gold entered a phase of tight consolidation between 1316.9/1310.9. What’s interesting here is this ranging action established north of an attractive buy zone on the H4 timeframe coated in yellow between 1302.5/1307.7 (a weekly support at 1302.5: the 2018 yearly opening level and a daily support coming in at 1307.7).
A bounce from 1302.5/1307.7 has daily supply to target at 1332.6-1322.3. It may also interest traders to note within the current daily supply zone is a H4 resistance level priced in at 1325.4. Also note how strongly this level capped price last week.
Areas of consideration:
Keeping things simple this morning, the 1302.5/1307.7 area marked on the H4 timeframe remains of interest. A H4 bullish candlestick pattern (entry/stop parameters can be defined off of this structure) emerging from this region would, according to our technical studies, be considered a strong buy signal. Arguably, though, many traders will feel the combination of a weekly and daily support is sufficient evidence to trade, without waiting for additional candle confirmation, simply entering and placing stops using the limits of the zone.
The use of the site is agreement that the site is for informational and educational purposes only and does not constitute advice in any form in the furtherance of any trade or trading decisions.
The accuracy, completeness and timeliness of the information contained on this site cannot be guaranteed. IC Markets does not warranty, guarantee or make any representations, or assume any liability with regard to financial results based on the use of the information in the site.
News, views, opinions, recommendations and other information obtained from sources outside of www.icmarkets.com.au, used in this site are believed to be reliable, but we cannot guarantee their accuracy or completeness. All such information is subject to change at any time without notice. IC Markets assumes no responsibility for the content of any linked site. The fact that such links may exist does not indicate approval or endorsement of any material contained on any linked site.
IC Markets is not liable for any harm caused by the transmission, through accessing the services or information on this site, of a computer virus, or other computer code or programming device that might be used to access, delete, damage, disable, disrupt or otherwise impede in any manner, the operation of the site or of any user’s software, hardware, data or property.


