
A note on lower timeframe confirming price action…
Waiting for lower timeframe confirmation is our main tool to confirm strength within higher timeframe zones, and has really been the key to our trading success. It takes a little time to understand the subtle nuances, however, as each trade is never the same, but once you master the rhythm so to speak, you will be saved from countless unnecessary losing trades. The following is a list of what we look for:
- A break/retest of supply or demand dependent on which way you’re trading.
- A trendline break/retest.
- Buying/selling tails/wicks – essentially we look for a cluster of very obvious spikes off of lower timeframe support and resistance levels within the higher timeframe zone.
- Candlestick patterns. We tend to only stick with pin bars and engulfing bars as these have proven to be the most effective.
We search for lower timeframe confirmation between the M15 and H1 timeframes, since most of our higher-timeframe areas begin with the H4. Stops are usually placed 5-10 pips beyond confirming structures.
EUR/USD:
On the back of a Bloomberg headline reporting that the ECB was near consensus on need to taper QE before it concludes, the EUR aggressively catapulted itself north from H4 demand at 1.1131-1.1143 early on during yesterday’s US session. After connecting with the H4 trendline resistance extended from the high 1.1366, the single currency, as you can see, steadied around the 1.12 boundary going into the close.
Despite this flurry of buying and selling, we can see that price made little ground during the day, closing a mere 7 pips below yesterday’s close at 1.1208. What this move did do, nonetheless, was reinforce the daily support level at 1.1135 seen housed within the daily support area coming in at 1.1224-1.1072. As bullish as this may seem though, let’s not forget that the weekly candles remain trading around a major resistance area seen at 1.1533-1.1278, which has held this market lower since May 2015!
Our suggestions: Personally, we have no interest in buying this market unless a decisive break above the September 15th daily high at 1.1284 (red arrow) is seen. Even then though, we would be wary of buying due to the weekly resistance area currently in play.
Seeing as how price is now seen finding a foothold above the 1.12 mark right now, we once again find ourselves honing in on the H4 Quasimodo resistance level drawn from 1.1257. Not only does this level boast a converging H4 trendline resistance (1.1327) and H4 mid-way resistance at 1.1250, but the apex of this Quasimodo formation (1.1279) is bolstered by the underside of the aforementioned weekly resistance area! As such, a pending sell order has been placed at 1.1256, along with a stop set at 1.1281.
On the data front today, we have the US ADP non-farm employment change at 12.15pm (this market-moving event provides investors a somewhat early snapshot of the labor market, before the more influential US employment report on Friday) and the ISM non-manufacturing PMI at 2pm GMT.

Levels to watch/live orders:
- Buys: Flat (Stop loss: N/A).
- Sells: 1.1256 [pending order] (Stop loss: 1.1281).
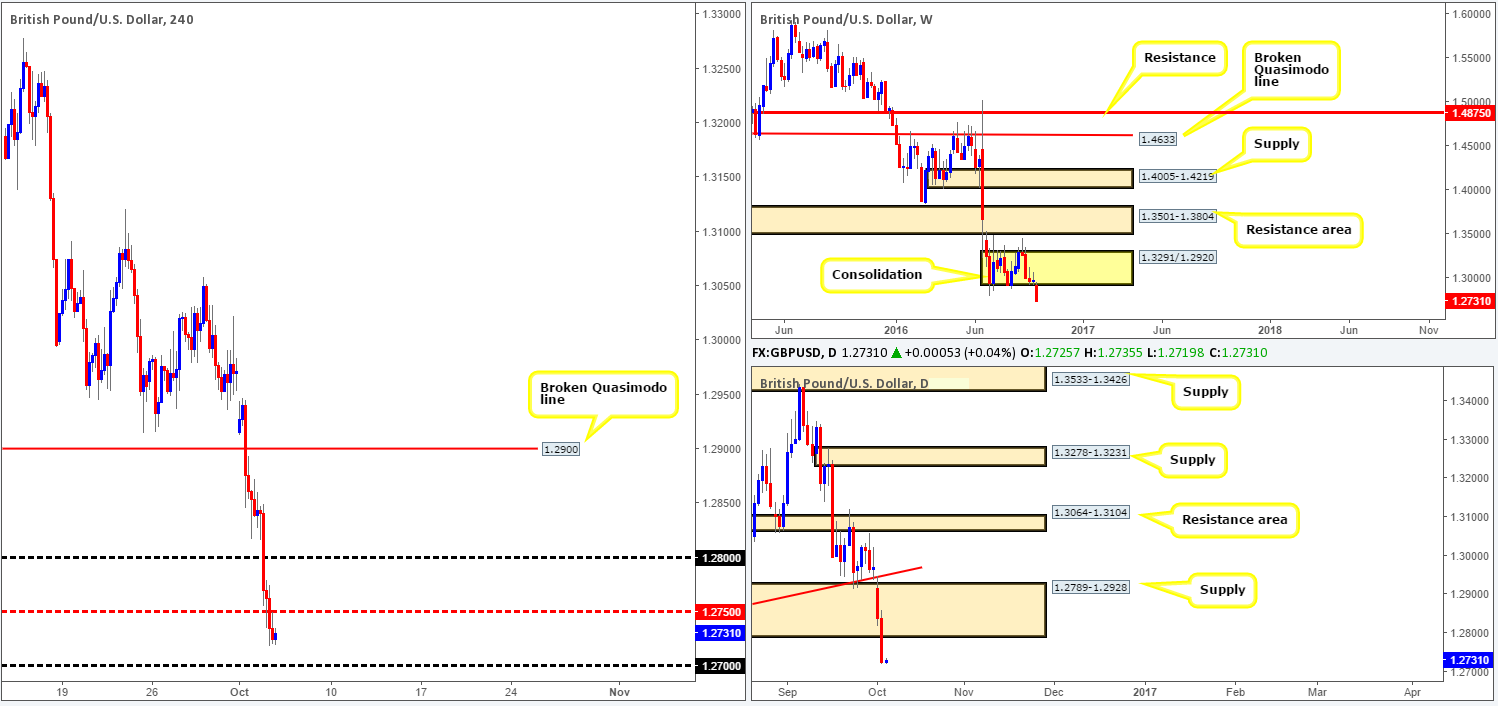
GBP/USD:
Following comments made by UK Prime Minister Theresa May that the country would begin the Brexit process by the end of March; the GBP has taken an absolute beating, losing almost 200 pips so far this week.
From the weekly chart, we can see that price has aggressively breached the lower edge of a consolidation fixed at 1.3291/1.2920. With little fresh data seen to the left, the closest support we can find beyond this barrier is seen around the 1.20 region! In addition to this break lower, we can also see that the daily candles broke below demand coming in at 1.2789-1.2928 (now acting supply). Stepping across to the H4 chart, however, we can see that price recently took out the mid-way support 1.2750 and retested the underside of this barrier in the last few hours. This could, given the pressure the pair is under right now, force prices down to the 1.27 handle, and possibly beyond. Before selling based on this momentum though, do keep in mind that there’s a possibility the GBP may extend above 1.2750 to touch gloves with 1.28 due to its connection with the underside of the recently broken daily demand-turned supply at 1.2789.
Our suggestions: Knowing that there is a daily supply lurking above 1.2750, our team would not be confident placing sell orders here. The only barrier our team considers trade worthy at the moment is 1.28. If this level fits in with your trading plan, do remain vigilant around 8.30am today since the UK’s PMI index is scheduled to hit the wire, along with the US ADP non-farm employment change at 12.15pm and the ISM non-manufacturing PMI at 2pm GMT.
Levels to watch/live orders:
- Buys: Flat (Stop loss: N/A).
- Sells: 1.28 region [At least a H4 bearish close is required here before pulling the trigger] (Stop loss: beyond the trigger candle).
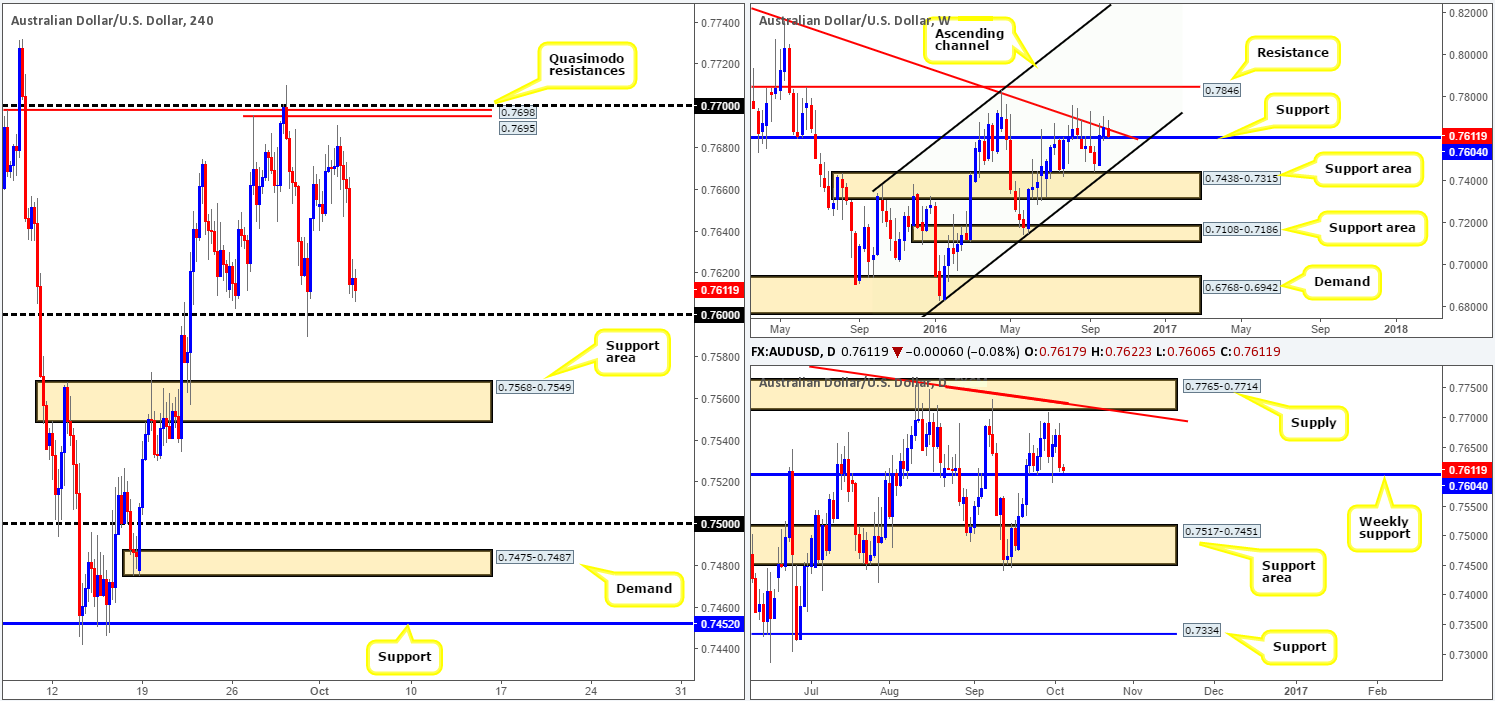
AUD/USD:
Kicking this morning’s analysis off with a look at the weekly timeframe shows that the pair is respecting the underside of the trendline resistance extended from the high 0.8295. However, before selling this market, a close beyond the nearby support at 0.7604 would need to be seen! Looking down to the daily candles, we can see that a close below the above said weekly support would likely open up the floodgates down to a support area penciled in at 0.7517-0.7451.
Turning our attention to the H4 chart, nevertheless, a close beyond the 0.76 boundary would likely clear the runway down to the support area seen at 0.7568-0.7549. This leaves 30 pips of room to play with between this area and 0.76. It also may be worth noting that this support area was used to propel the commodity currency beyond the weekly resistance 0.7604 back on the 21st September. Therefore, this base has a fairly good chance of holding price.
Our suggestions: Should the H4 close beyond 0.76 and retest the underside of this level and hold (without striking the top edge of the H4 support area), we may look to short this market on the basis that we can pin down a lower timeframe sell setup that allows a small stop loss (see the top of this report for lower timeframe entry techniques). The first take-profit target would, of course, be the aforementioned H4 support area. Beyond here though, we have our eye on the 0.75 handle as our final take-profit zone given that it is lodged within the above said daily support area.
On the data front guys, we have AUD retail sales in a few minutes as well as the US ADP non-farm employment change at 12.15pm and the ISM non-manufacturing PMI at 2pm GMT.
Levels to watch/live orders:
- Buys: Flat (Stop loss: N/A).
- Sells: Watch for a close below 0.76 and then look to trade any retest seen thereafter (lower timeframe confirmation required).
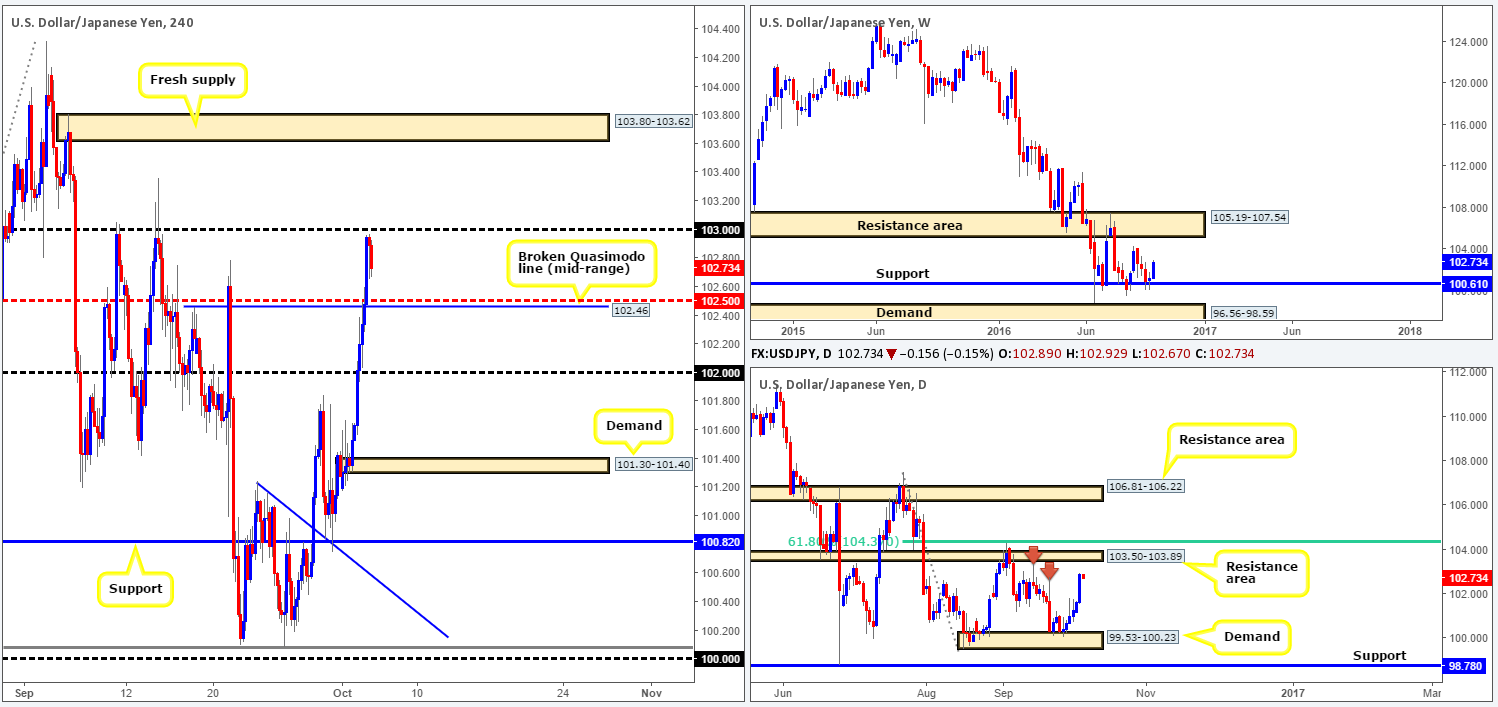
USD/JPY:
The USD/JPY was on fire yesterday! Price rallied close to 130 pips on the day, squeezing through several H4 tech resistances, before closing out just ahead of the 103 handle. There are, however, technical signs that this buying could continue today. The bounce from weekly support at 100.61 has the potential to pull prices up to the weekly resistance area coming in at 105.19-107.54, while daily action shows room to continue advancing up until a resistance area drawn from 103.50-103.89.
Our suggestions: Put simply, we see two potential opportunities to buy this market today:
- Trading long from the H4 broken Quasimodo line (mid-range) at 102.46 is appealing given its connection with the H4 mid-way point 102.50. We would strongly advise waiting for at least a reasonably sized H4 bull candle to form prior to pulling the trigger here, nonetheless, since a fakeout through this fixed zone is likely.
- Should we break above 103 today, there’s a good chance that we will likely reach the fresh H4 supply zone seen at 103.80-103.62 (lodged within the above said daily resistance area). With that being the case, a close above 103, followed by a retest and a H4 bullish candle close would, at least in our opinion, be sufficient enough to condone a long in this market, targeting the above said fresh H4 supply.
Of course, do keep in mind that US ADP non-farm employment change at 12.15pm and the ISM non-manufacturing PMI at 2pm GMT could force technicals to take a back seat during these times!
Levels to watch/live orders:
- Buys: Watch for a close above 103 and then look to trade any retest seen thereafter (H4 bullish candle close required). 102.46 region [H4 bullish candle close required] (Stop loss: beyond the trigger candle).
- Sells: Flat (Stop loss: N/A).
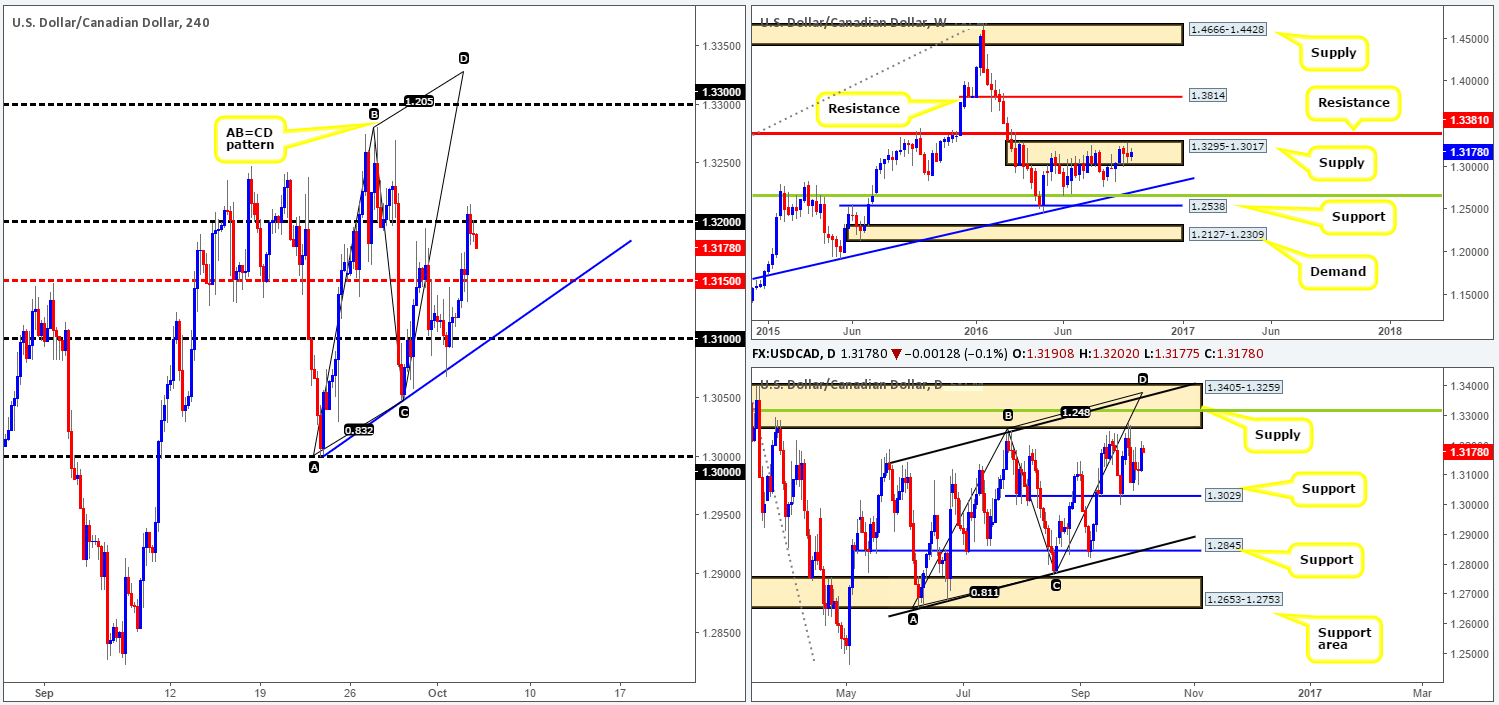
USD/CAD:
Although the bears remain trading within a weekly supply zone seen at 1.3295-1.3017, they’re currently struggling to make headway. A break above this area would almost immediately land the pair within striking distance of resistance seen at 1.3381. Conversely, a downside move from the current supply area could force price to connect with trendline support extended from the high 1.1278.
Looking down to the daily candlesticks, the pair continues to trade between a support level coming in at 1.3029 and a supply zone drawn from 1.3405-1.3259. Within this zone, and this is something we have mentioned several times in past reports, there is also a daily convergence point seen located within this barrier: a 38.2% Fib resistance level at 1.3315 (green line), the weekly resistance level at 1.3381, a channel resistance taken from the high 1.3241 and an AB=CD completion point around the 1.3376ish range.
Jumping across to the H4 chart, the loonie found a foothold around the H4 mid-way point 1.3150 yesterday, consequently forcing prices to touch base with the 1.32 figure going into the close. With price looking as though it may complete the D-leg of a H4 AB=CD pattern (taken from the low 1.30), which will likely top out within the above noted daily convergence point, we are wary of selling 1.32 today.
Our suggestions: We know it could be a long way off, but our team is interested in shorting around 1.3315ish region. Not only does this area boast a truckload of daily and H4 confluence, it also allows one to place their stops above the current daily supply! With that in mind, our team has set a pending sell order at 1.3315, with a stop positioned above at 1.3407.
Data points to consider today are CAD trade balance scheduled at 12.30pm, along with the US ADP non-farm employment change at 12.15pm and the ISM non-manufacturing PMI at 2pm GMT.
Levels to watch/live orders
- Buys: Flat (Stop loss: N/A).
- Sells: 1.3315 [pending order] (Stop loss: 1.3407).
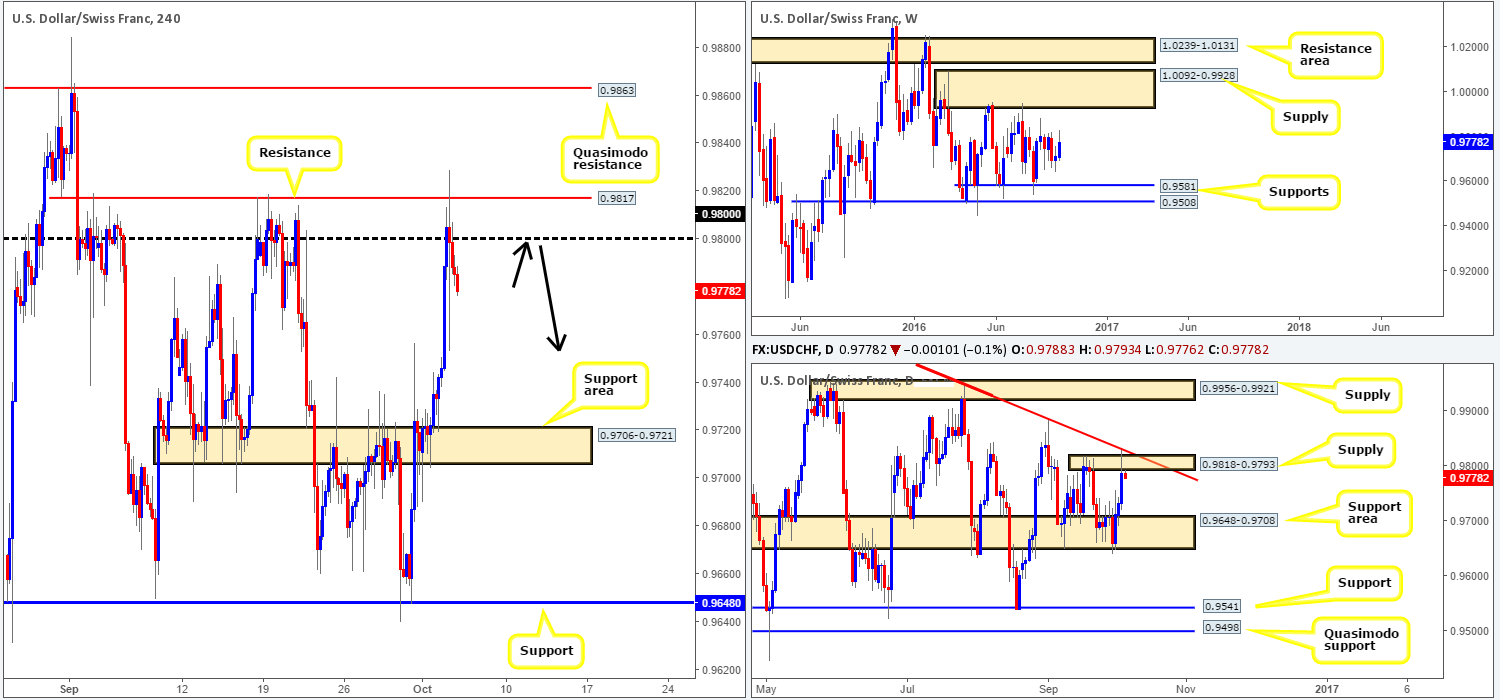
USD/CHF:
(Trade update: Long trade taken from 0.9741 was closed at 0.9795 for full profit).
During the course of yesterday’s sessions, we saw the Swissy pair press forward and aggressively attack both the 0.98 handle and the nearby H4 resistance seen at 0.9817. The whipsaw through both of these H4 barriers will likely make sense over on the daily chart, which shows price also broke through a supply barrier at 0.9818-0.9793 to tag in the trendline resistance extended from the high 1.0256. As far as weekly structures go, however, direction is rather limited for the time being as price continues to loiter mid-range between supply seen at 1.0092-0.9928, and support coming in at 0.9581.
Our suggestions: Technically, we see very little reason why the USD/CHF pair will not continue trading lower today down to the H4 support area at 0.9706-0.9721 (represents the top edge of a daily support area seen at 0.9648-0.9708, which happens to be the next downside target on the daily timeframe). As far as entry goes, the only place we’d consider entering short on this pair right now is back up at 0.98 as per the black arrows. Assuming price does retest the 0.98 number today and chalks up a H4 bearish close, we would look to jump in short, targeting the above noted H4 support area.
Despite the above, do keep an eye on the US ADP non-farm employment change at 12.15pm and the ISM non-manufacturing PMI at 2pm GMT today as both events are likely to cause a stir in this market!
Levels to watch/live orders:
- Buys: Flat (Stop loss: N/A).
- Sells: 0.98 region [H4 bearish close required] (Stop loss: beyond the trigger candle).
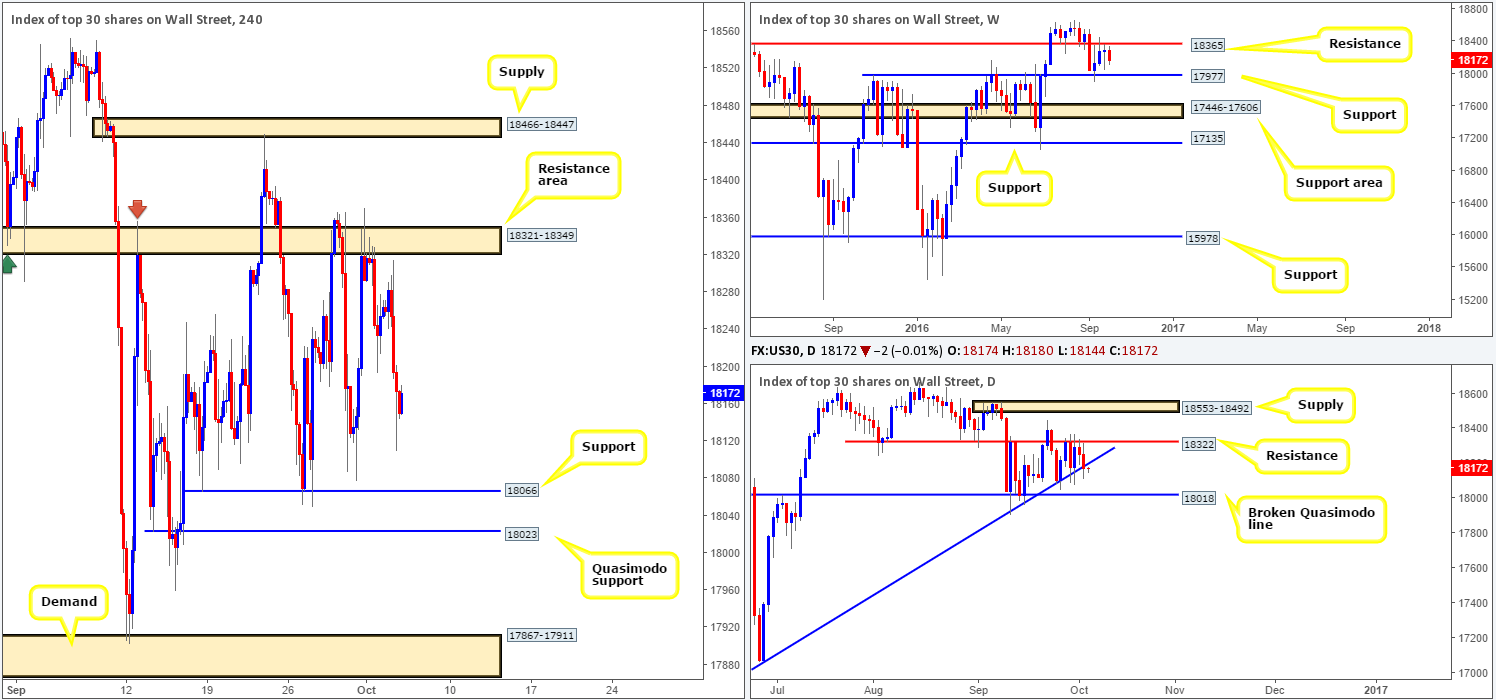
DOW 30:
Recent action shows that the DOW extended its bounce lower from the weekly resistance level at 18365 yesterday, consequently forcing daily action to slip below the trendline support taken from the low 15501. This break, along with pressure from the weekly sellers, will likely encourage further downside today towards H4 support coming in at 18066.
This H4 support, however, is not somewhere our team would feel comfortable buying from. The reason? The next downside target on the daily timeframe is seen at 18018: a broken Quasimodo line, which sits only a few points below a H4 Quasimodo support penciled in at 18023. Furthermore, the head of this H4 Quasimodo formation connects beautifully with the weekly support barrier at 17977 (the next downside target on the weekly scale).
Our suggestions: In light of the above points, our team will ignore the current H4 support and look to buy from the above said H4 Quasimodo support today. A pending buy order has been set at 18024 with a stop placed at 17955. The first take-profit target is likely to be the underside of the current support at 18066.
Levels to watch/live orders:
- Buys: 18024 [pending order] (Stop loss: 17955).
- Sells: Flat (Stop loss: N/A).
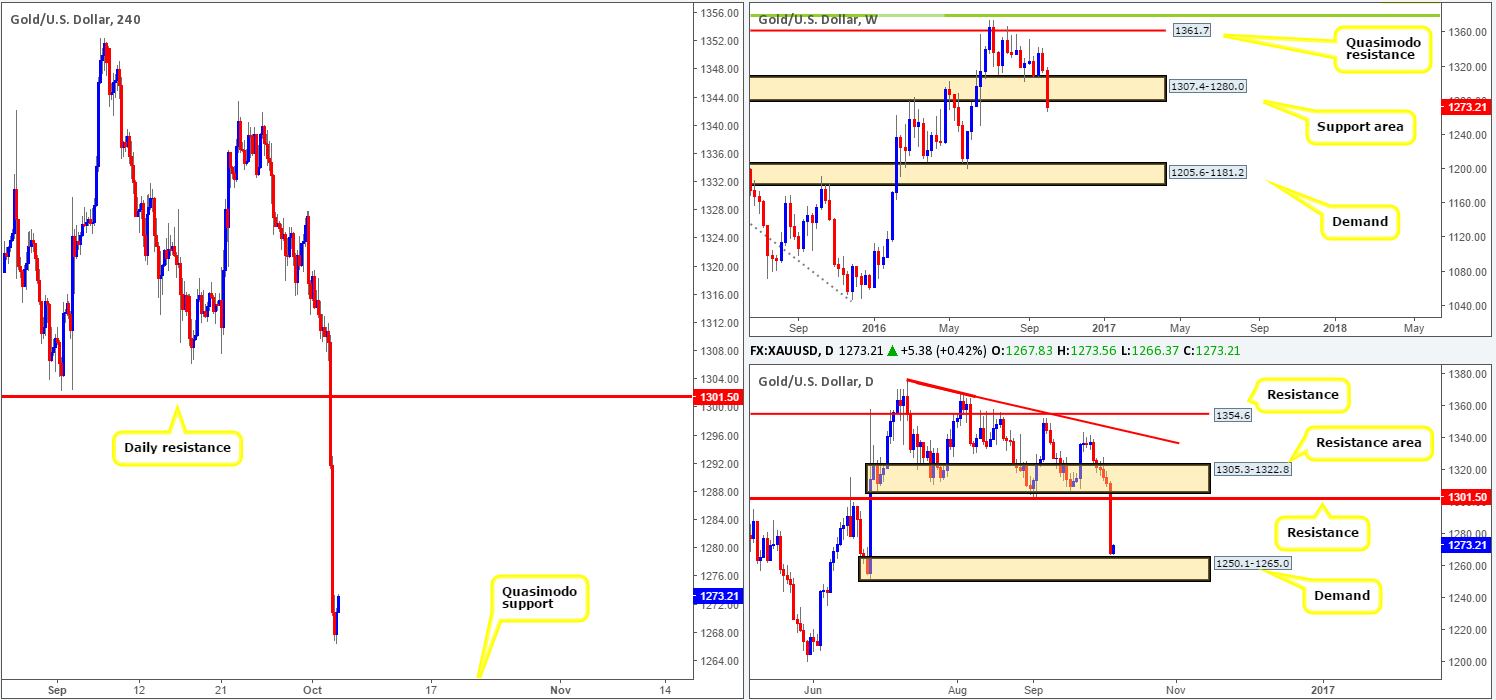
GOLD:
The gold market experienced a significant selloff yesterday, losing around $43 in value on the day! This has, as you can see, forced the yellow metal to break below a weekly support area drawn from 1307.4-1280.0, which by extension, also forced daily price down to within touching distance of a daily demand base coming in at 1250.1-1265.0. Based on this recent movement, our team would not look to become sellers in this market until a break below the aforementioned daily demand base has been seen. In regard to buying, however, we have our eye on the H4 Quasimodo support level at 1257.4 (not seen on the screen), which is housed within the above said daily demand.
Nevertheless, a buy from this H4 level is not without risk! The break below the weekly support area is concerning. Therefore, the best path, at least in our view, is to wait for a reasonably sized H4 bull candle to form off of 1257.4, before looking to enter long. Only once this is seen would we be comfortable buying here.
Levels to watch/live orders:
- Buys: 1257.4 region [H4 bullish close required] (Stop loss: beyond the trigger candle).
- Sells: Flat (Stop loss: N/A).


