
Waiting for lower timeframe confirmation is our main tool to confirm strength within higher timeframe zones, and has really been the key to our trading success. It takes a little time to understand the subtle nuances, however, as each trade is never the same, but once you master the rhythm so to speak, you will be saved from countless unnecessary losing trades. The following is a list of what we look for:
- A break/retest of supply or demand dependent on which way you’re trading.
- A trendline break/retest.
- Buying/selling tails/wicks – essentially we look for a cluster of very obvious spikes off of lower timeframe support and resistance levels within the higher timeframe zone.
- Candlestick patterns. We tend to stick with pin bars and engulfing bars as these have proven to be the most effective.
We typically search for lower-timeframe confirmation between the M15 and H1 timeframes, since most of our higher-timeframe areas begin with the H4. Stops are usually placed 1-3 pips beyond confirming structures.
EUR/USD:
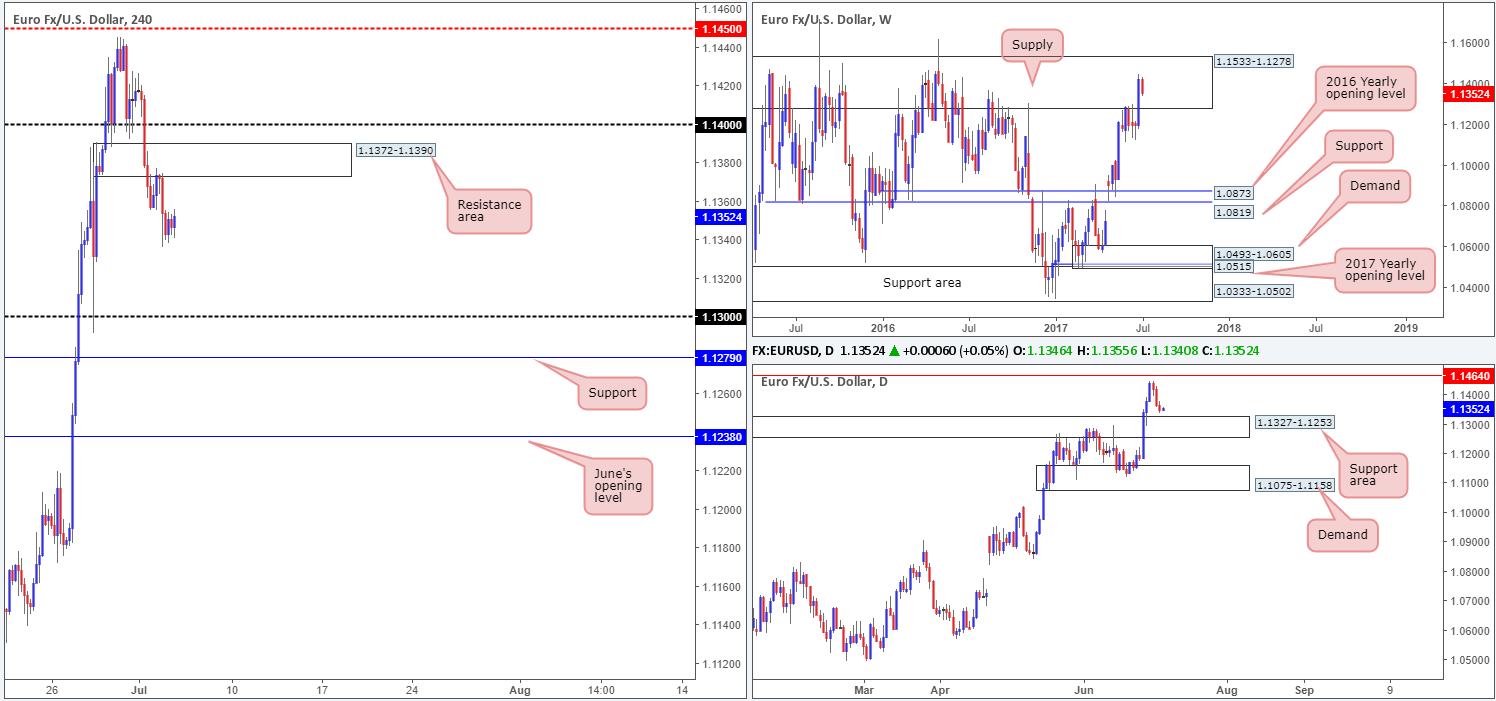
For those who read Tuesday’s report you may remember the desk highlighting the H4 resistance area at 1.1372-1.1390 as a possible sell zone. As you can see, price respected this area so well done to any of our readers who managed to jump aboard this move.
With the unit now seen consolidating around the 1.1350 mark, we still believe that there’s room for price to drive lower today, at least until we reach the top edge of the daily support area at 1.1327: the next downside target on that timeframe. Moreover, let’s not forget that weekly price is also trading within the walls of a major supply zone drawn from 1.1533-1.1278, which has capped upside since May 2015!
Our suggestions: Selling at current prices is not something our team would agree to, simply because the risk/reward would be unfavorable. However, should H4 price retest the said resistance area again today, this may tempt us to begin looking to sell again. What would be ideal here is for price to fake above the area and tag in offers positioned around the 1.14 handle lurking above. This move would trigger stops/breakout buyers’ orders lurking above 1.1372-1.1390 and likely provide the big boys enough liquidity to short from 1.14.
Data points to consider: FOMC meeting minutes at 7pm GMT+1.
Levels to watch/live orders:
- Buys: Flat (stop loss: N/A).
- Sells: 1.1372-1.1390 – Ideally looking for price to fake this area and connect with 1.14 before a sell is permitted (stop loss: beyond the fakeout candle’s wick).
GBP/USD:
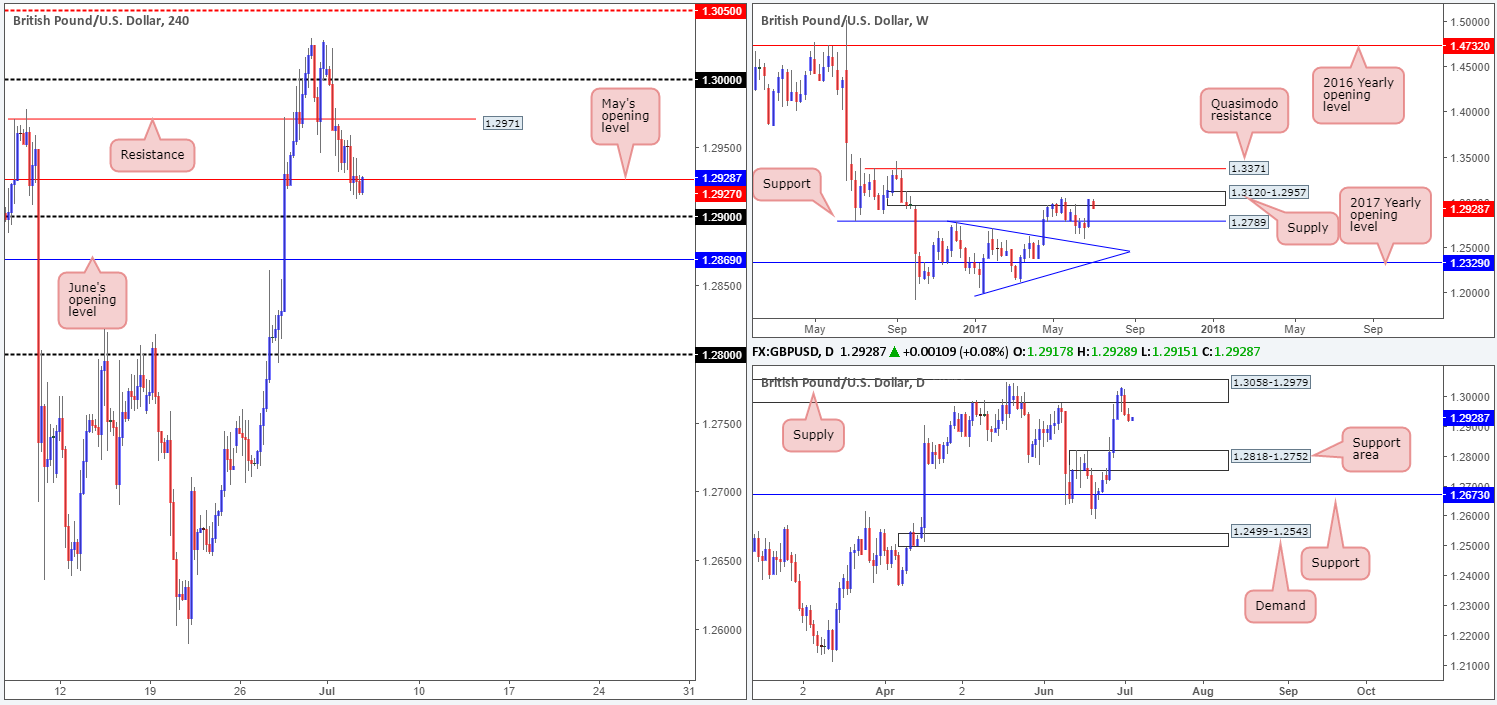
In recent trading, May’s opening level at 1.2927 failed to offer support to this market and is, at the time of writing, being retested as a resistance. Selling this line is difficult given that just beneath here sits the 1.29 handle, followed closely by June’s opening level at 1.2869. Whilst either line could halt further selling, it may be worth noting that the weekly timeframe shows that the bears are beginning to make an appearance from the supply zone marked at 1.3120-1.2957. In addition to this, the pair is also seen interacting with a supply zone at 1.3058-1.2979, which is essentially a partner supply to the aforementioned weekly area.
Our suggestions: Technically speaking, the path south would only be clear for selling once June’s opening level at 1.2869 is cleared. According to H4 structure, the 1.28 handle would then likely be the next hurdle on the hit list. Nevertheless, traders will need to be prepared for price to stall/reverse above this number since let’s remember that the top edge of a daily support area is located at 1.2818.
Therefore, until we see a H4 close beyond 1.2869, we are going to remain on the sidelines for the time being.
Data points to consider: UK Services PMI at 9.30am. FOMC meeting minutes at 7pm GMT+1.
Levels to watch/live orders:
- Buys: Flat (stop loss: N/A).
- Sells: Flat (stop loss: N/A).
AUD/USD:
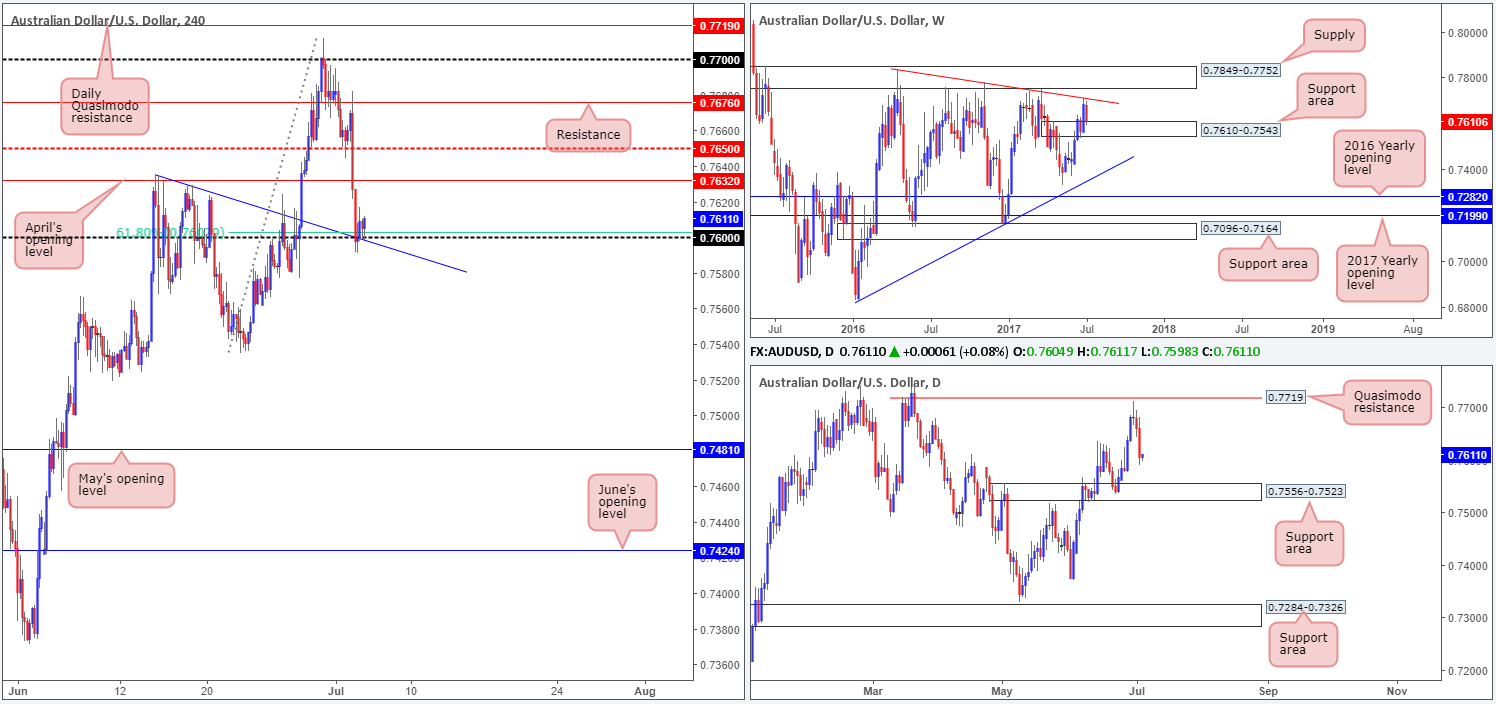
In response to the RBA’s rate statement on Tuesday the commodity currency plunged south, consequently breaking through both the H4 mid-level support at 0.7650 and April’s opening level at 0.7632. It was only once price shook hands with the H4 trendline support etched from the high 0.7635 (and its converging round number 0.76/H4 61.8% Fib support at 0.7603), did we see any sign of stabilization. What’s also notable from a technical perspective is that the recent move south brought weekly price down to the top edge of a support area coming in at 0.7610-0.7543. Daily action on the other hand shows room to continue pushing lower down to the support area formed at 0.7556-0.7523, which happens to be glued around the lower edge of the current weekly support area.
Our suggestions: The space seen on the daily timeframe for price to move lower is a little concerning. Nevertheless, the 0.76 boundary on the H4 chart not only boasts attractive H4 confluence, it is also bolstered nicely by the said weekly support area. As such, we firmly believe that this unit is going to touch gloves with 0.7632, and possibly even the 0.7650 level today.
In the event that the current H4 candle closes as is, we will long this market with stops tightly positioned beneath the candle’s tail at 0.7597, and look to ride this market up to at least 0.7650.
Data points to consider: FOMC meeting minutes at 7pm GMT+1.
Levels to watch/live orders:
- Buys: Looking to buy the current H4 candle should it close as is (stop loss: 0.7597).
- Sells: Flat (stop loss: N/A).
USD/JPY:
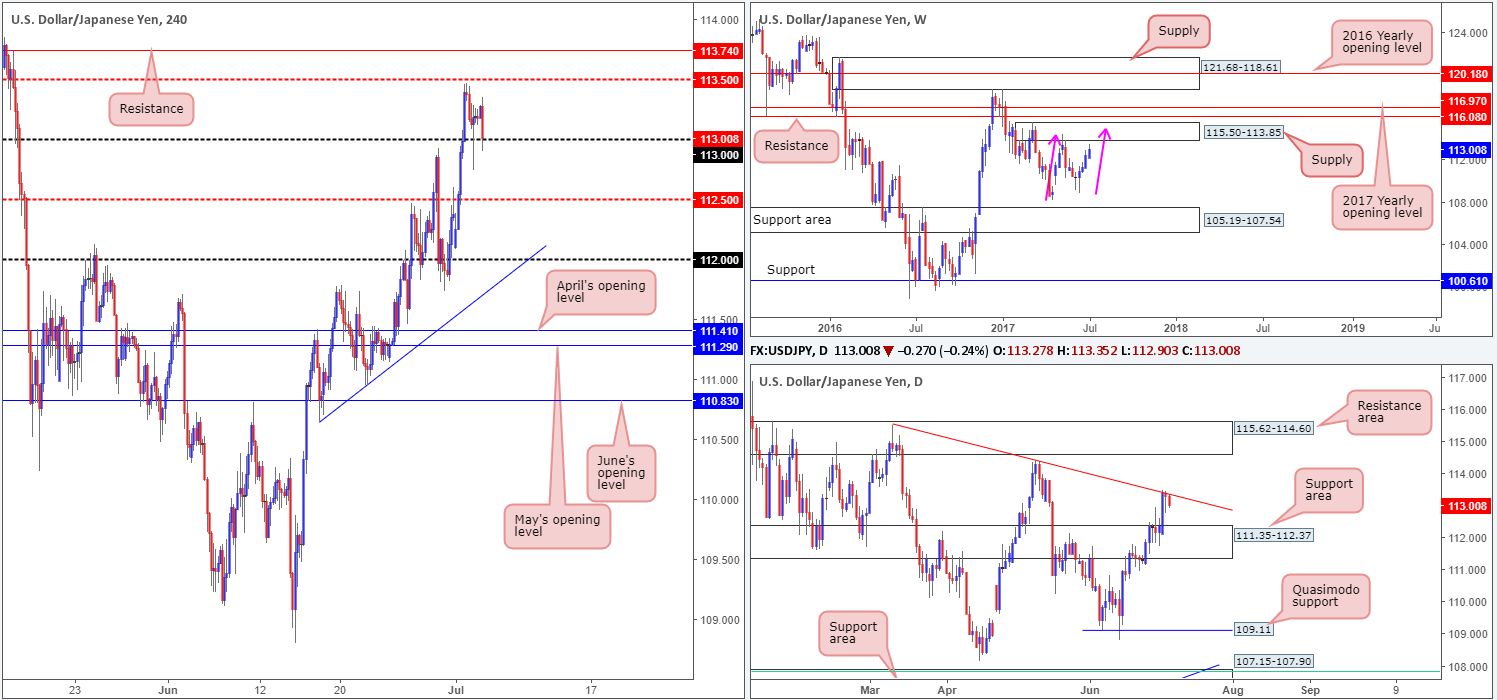
Reporting from the weekly timeframe this morning, we can see that price is currently lurking just ahead of a supply coming in at 115.50-113.85. Assuming that the unit connects with this area, it could also form a possible AB=CD correction (see pink arrows). Looking down to the daily timeframe, there’s now a trendline resistance taken from the high 115.50 in play, which could, despite what we’ve noted on the weekly timeframe, bring the pair back down to a support area seen at 111.35-112.37.
In recent hours, H4 price crossed swords with the 113 handle. Unfortunately, it’s tricky to know whether this handle will hold firm or give way, since we have conflicting signals on the higher timeframes at the moment (see above).
Our suggestions: Personally, there is very little that interests us in this market this morning. No matter which way once chooses to trade, you will be going up against higher-timeframe flow!
Data points to consider: FOMC meeting minutes at 7pm GMT+1.
Levels to watch/live orders:
- Buys: Flat (stop loss: N/A).
- Sells: Flat (stop loss: N/A).
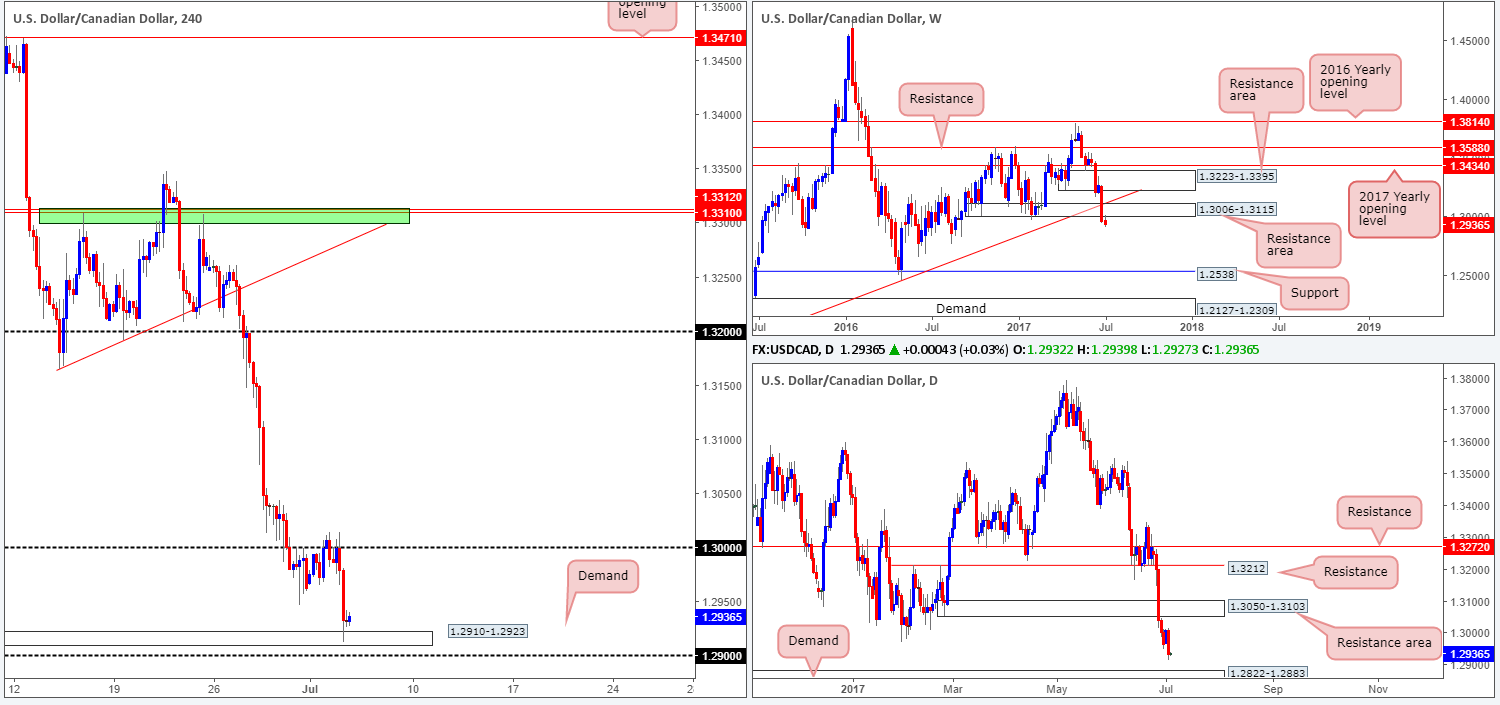
USD/CAD:
For those who read Tuesday’s report on the USD/CAD you may recall our desk suggesting that they were willing to sell this market should we see a H4 bearish close form below 1.30. As you can see this did come to fruition, consequently permitting us to sell at 1.2989, with a stop-loss order positioned a little above 1.3015. Price came within a few pips of our stop but somehow managed to survive and drive down to the H4 demand at 1.2910-1.2923: the first take-profit zone. We still have 30% of our position running in this market, since both weekly and daily charts show room for lower prices, with the closest area of support coming in at a daily demand drawn from 1.2822-1.2883. Well done to any of our readers who managed to jump aboard this move!
Our suggestions: As noted above, we still have some of our current position in the market, so we have absolutely no intention of trying to buy from the current H4 demand, or the 1.29 handle lurking below it!
Data points to consider: FOMC meeting minutes at 7pm GMT+1.
Levels to watch/live orders:
- Buys: Flat (Stop loss: N/A).
- Sells: 1.2989 ([live] stop loss: breakeven).
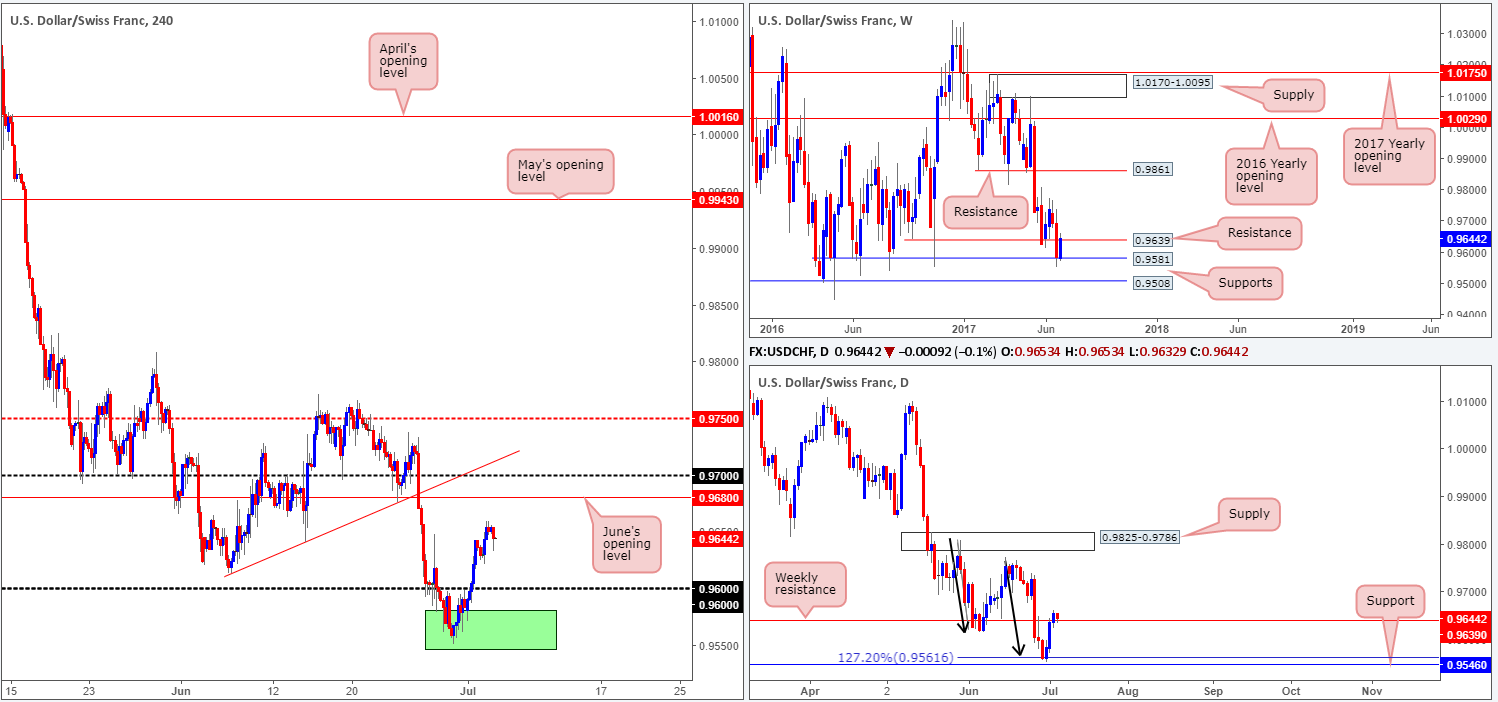
USD/CHF:
For those who have been following recent reports you may recall that our team is long from 0.9567. Our reasoning behind the position came down to the higher-timeframe picture. The green area shown on the H4 chart is comprised of a weekly support level at 0.9581 and a daily support level pegged at 0.9546.
Initially, we had our stop beneath the green zone at 0.9544, but seeing as how the Swissy recently took off north, the stop was placed at breakeven. In addition to this, we also removed 70% of the position off the table once price struck weekly resistance at 0.9639.
We’re going to hold the remaining 30% in the market since if the weekly resistance level is taken out, which we feel may well occur, June’s opening level at 0.9680 will be the next area in the firing range, thus making it an ideal place to close the remainder of our position.
Our suggestions: Apart from our current trade, we do not see a lot to hang our hat on.
Data points to consider: FOMC meeting minutes at 7pm GMT+1.
Levels to watch/live orders:
- Buys: 0.9567 ([live] stop loss: breakeven).
- Sells: Flat (stop loss: N/A).
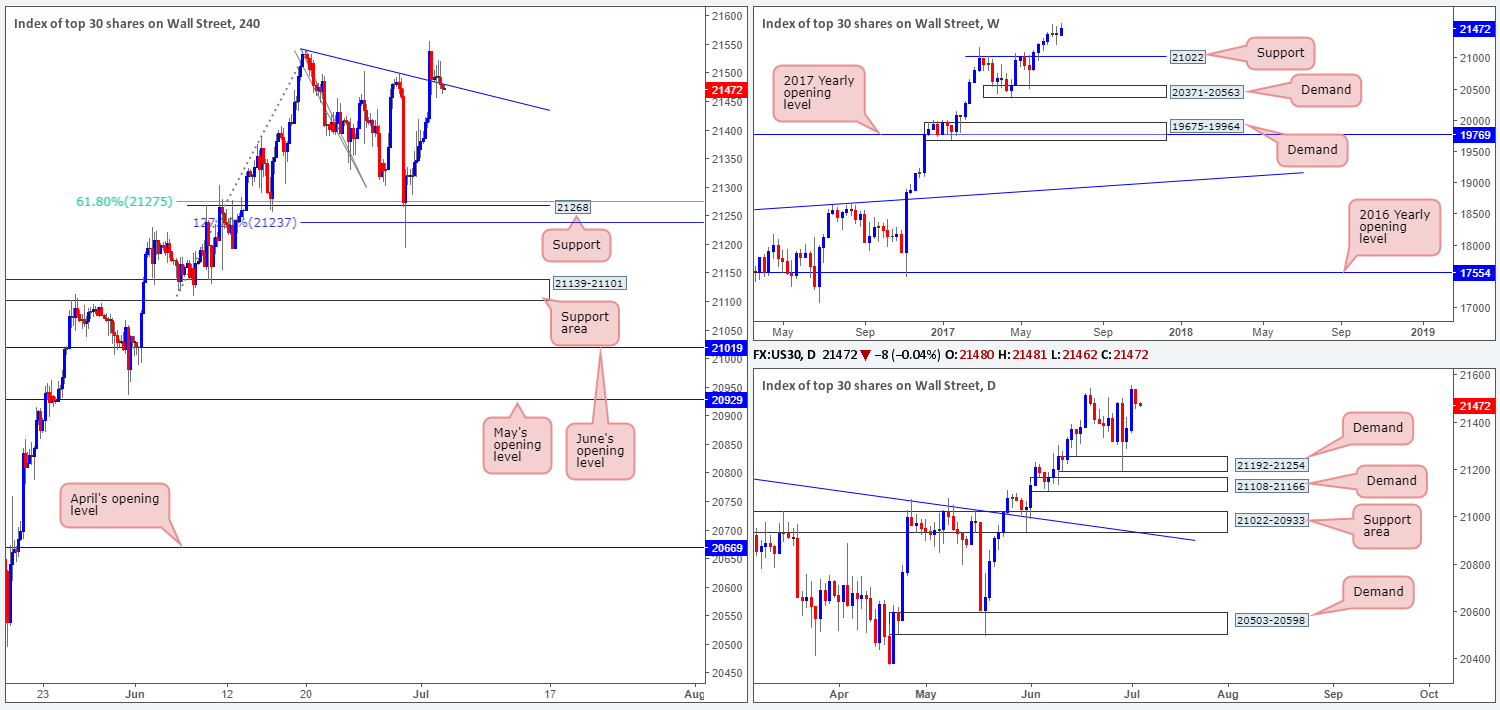
DOW 30:
The DOW 30, as you can see, is effectively unchanged this morning. Price spent yesterday loitering around the H4 trendline support extended from the high 21541. With that in mind, the following report will echo thoughts put forward in Tuesday’s analysis…
In Friday’s report, we mentioned that our desk took a long trade at 21323, following the large H4 bull candle that formed off the H4 support level marked at 21268. What attracted us to this point was that the H4 level converged with a H4 61.8% Fib support level at 21275 taken from the low 21108 as well as a H4 127.2% Fib ext. point 21237 drawn from the high 21541 and also because of the daily demand at 21192-21254. Our stop-loss order has now been moved to breakeven and 50% of our position was taken off the table once price connected with the said H4 trendline. We have left the remaining 50% in the market to run as we believe that this index has the potential to punch much higher yet!
Our suggestions: Given our current long position, our desk is watching for the H4 trendline to now hold as support. This could, given that the weekly, daily and H4 charts show absolutely no overhead resistance, also be a reasonable level to look for possible long opportunities.
Should price break into fresh highs today, however, we are going to move our stop-loss order up to the 21400 neighborhood.
Data points to consider: FOMC meeting minutes at 7pm GMT+1.
Levels to watch/live orders:
- Buys: 21323 ([live] stop loss: breakeven).
- Sells: Flat (stop loss: N/A).
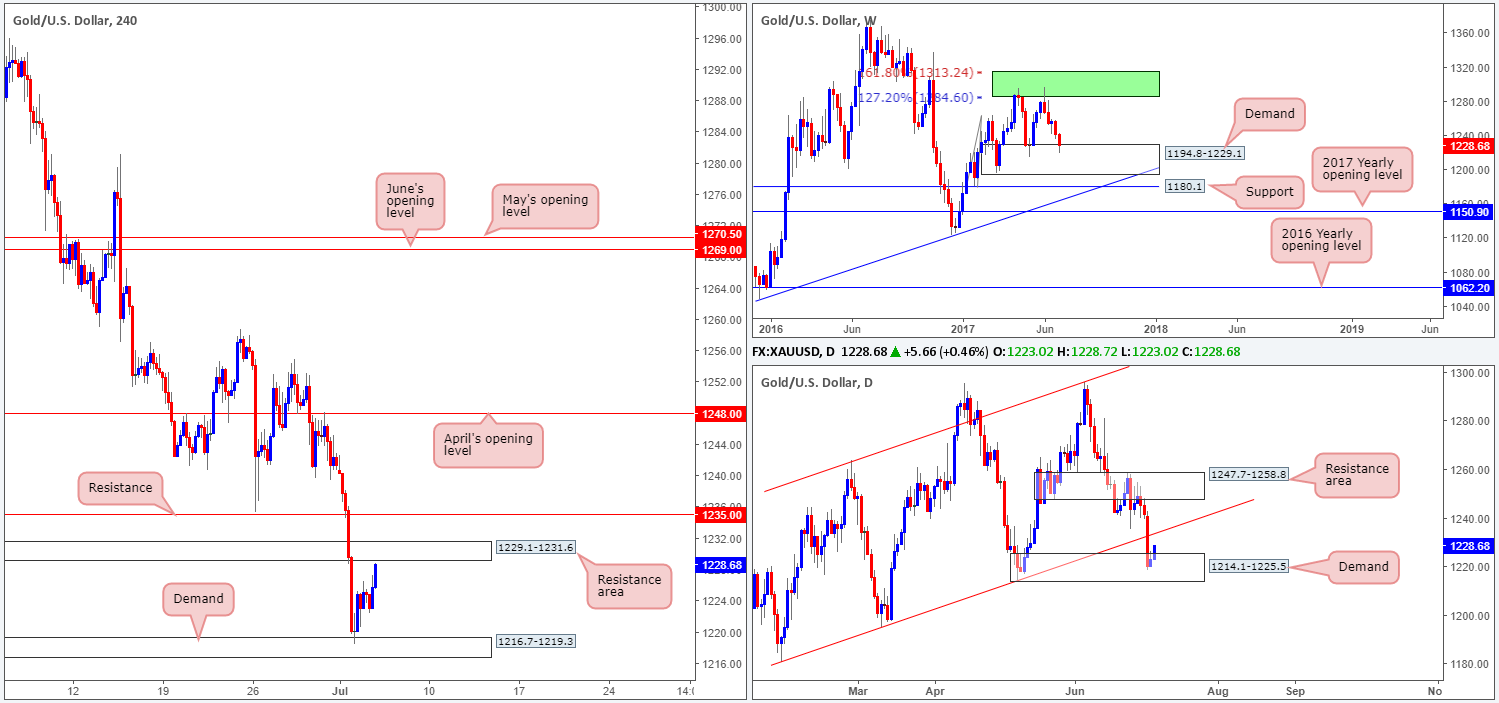
GOLD:
Recent action shows that the yellow metal extended its bounce from the H4 demand base at 1216.7-1219.3, and is now within striking distance of a H4 resistance area seen at 1229.1-1231.6. Surrounding the demand zone is both a weekly demand at 1194.8-1229.1 and a daily demand (seen within the walls of the weekly barrier) at 1214.1-1225.5.
While a bounce from the aforementioned H4 resistance area may come to fruition, we would not be keen sellers here. This is largely due to the higher-timeframe demands currently in play. A level that has sparked some interest, however, is the H4 resistance base penciled in at 1235.0, due to its connection with the daily trendline resistance seen extended from the low 1180.4. Still, shorting from this line would still entail one going against potential weekly buying power.
Our suggestions: For us personally, we are not going to be taking any trades in this market at the moment. Typically, we try to avoid trading against higher-timeframe flow.
Levels to watch/live orders:
- Buys: Flat (stop loss: N/A).
- Sells: Flat (stop loss: N/A).


