
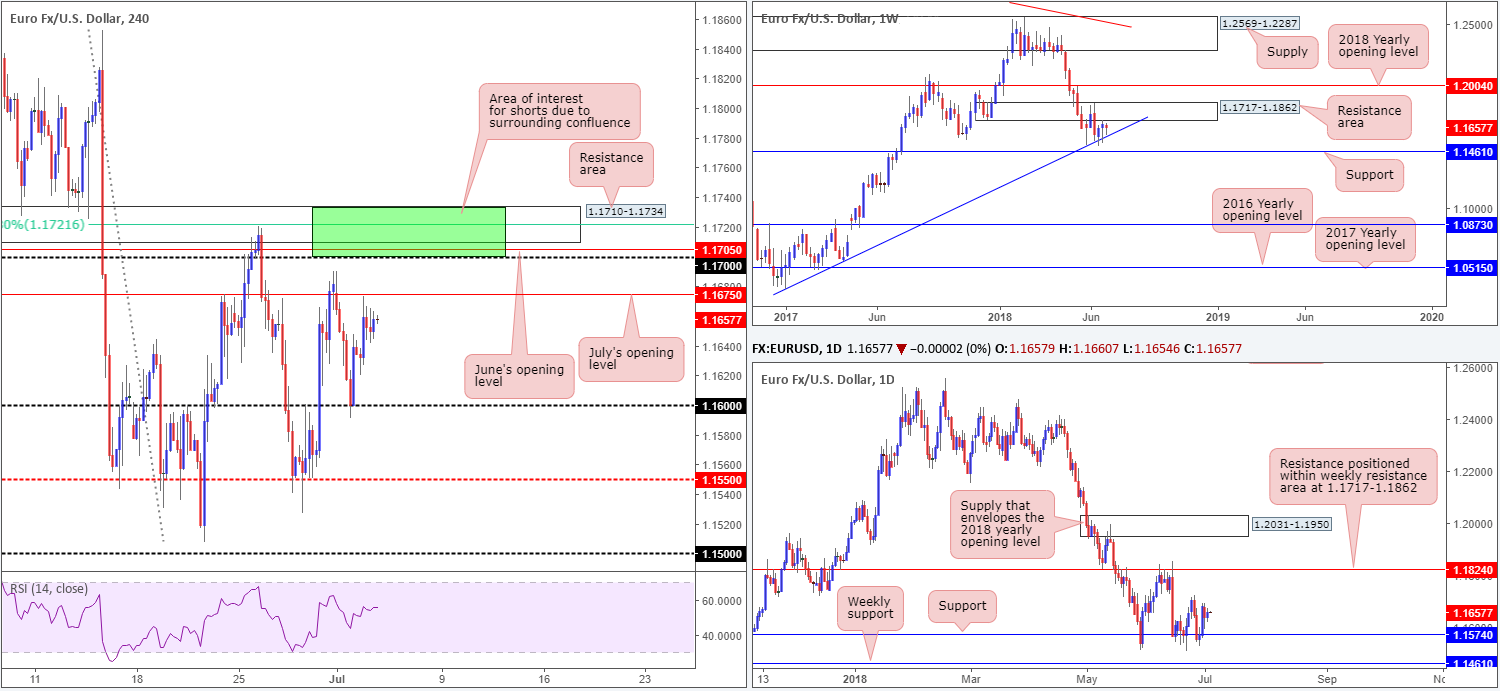
EUR/USD:
Kicking off with a look at the weekly timeframe, buyers and sellers remain battling for position amid a resistance area at 1.1717-1.1862 and a trend line support etched from the low 1.0340. Traders may also want to note that surrounding structures are seen at the 2018 yearly opening level drawn from 1.2004 and support located at 1.1461.
Daily support seen at 1.1574, as you can see, continues to bolster this market. Further upside from this point would likely call for a test of daily resistance placed at 1.1824 (positioned within the noted weekly resistance area). Across on the H4 timeframe, we can see that EUR/USD bulls managed to eke out modest gains on Tuesday. Extending Monday’s advance from the 1.16 handle, the pair concluded the day just south of July’s opening level at 1.1675.
Areas of consideration:
While July’s opening level may hold price action lower today, this base remains secondary. The reason behind this is due to an area sited a few pips above (green) at 1.1734/1.17 (comprised of June’s opening level at 1.1705, a 61.8% H4 Fib resistance value at 1.1721 and a H4 resistance area at 1.1710-1.1734). What sealed the deal for us, though, was the fact that it houses the lower edge of the weekly resistance area within at 1.1717-1.1862. Therefore, keep eyes on this zone for potential shorting opportunities today, traders.
Today’s data points: Limited. US banks are closed in observance of Independence Day.
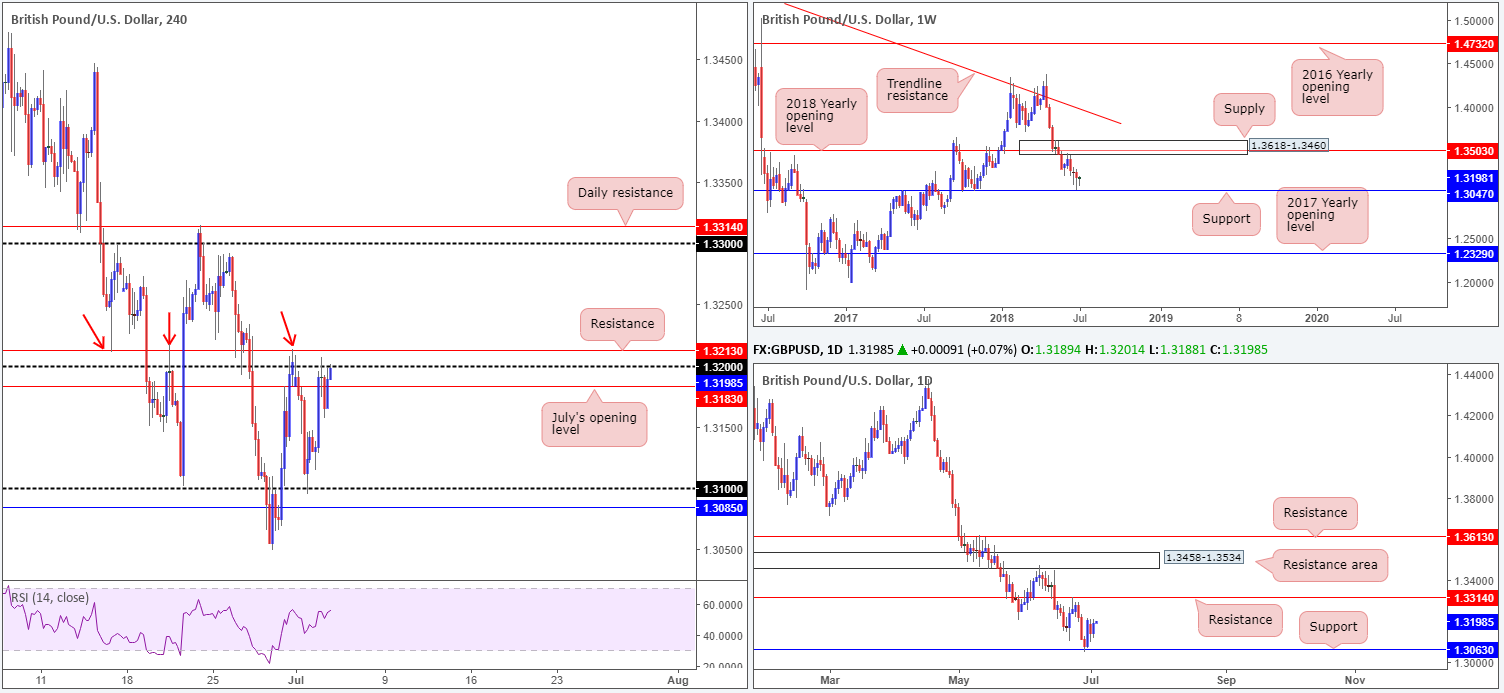
GBP/USD:
Overshadowed by Brexit headlines, Tuesday’s reaction to upbeat UK construction PMI was negligible. It did, however, aid the bulls in overcoming July’s opening level seen on the H4 timeframe at 1.3183, which, in turn, led to a test of the 1.32 handle.
Although the bulls appear determined to crack through 1.32 this morning, trouble lurks close by in the shape of a H4 resistance level at 1.3213. Note that this level held the pair lower – a to-the-pip reaction – on June 29 and has a reasonably sound history from an intraday perspective (check out the red arrows).
Higher-timeframe structure, nevertheless, reveals little in terms of resistance until we reach daily resistance posted at 1.3314. Therefore, should the unit manage to cross above the aforementioned H4 resistance level, further buying could be on the cards.
Areas of consideration:
On account of the daily timeframe, the team has noted to be wary of selling this market despite nearby H4 resistances.
As such, a decisive H4 close above 1.3213, followed up with a retest in the shape of a full or near-full-bodied H4 bull candle would, in our humble opinion, be enough evidence to suggest higher levels are on the horizon, with the nearest upside target falling in around the 1.33 handle.
Today’s data points: UK services PMI; US banks are closed in observance of Independence Day.
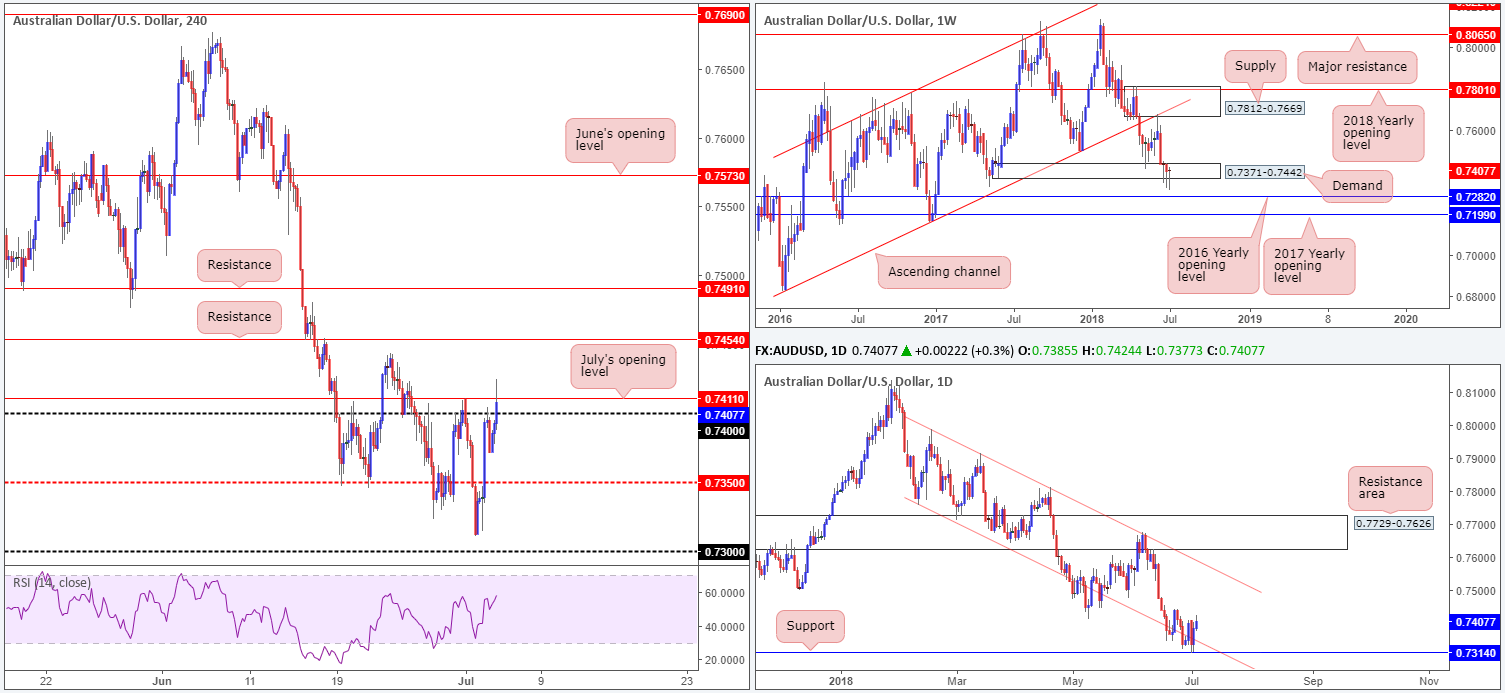
AUD/USD:
AUD/USD bulls went on the offensive in recent trade, penetrating key figure 0.74 on the back of better-than-expected Aussie retail sales. Despite a solid push to highs of 0.7424, though, the pair has been unable to close above July’s opening level at 0.7411.
Weekly demand at 0.7371-0.7442 remains in the fray, but appears to be hanging on by a thread. Last week’s push below this area likely tripped stops and cleared the path south to nearby weekly support in the shape of the 2016 yearly opening level at 0.7282. Daily action, on the other hand, found support at 0.7314, which happens to be bolstered by additional confluence in the form of a nearby daily channel support taken from the low 0.7758.
Areas of consideration:
As long as the bulls remain defensive within the current weekly demand base, traders may witness an extension to the upside.
A decisive H4 close above July’s opening level at 0.7411, therefore, would likely be sufficient enough to pull the unit towards H4 resistance plotted at 0.7454, and quite possibly much higher, as the next upside target on the daily timeframe does not come into view until we reach the daily channel resistance extended from the high 0.7988.
Therefore, longs above 0.7411 are a possibility today, targeting H4 resistance at 0.7454 as the initial take-profit zone, followed closely by another H4 resistance positioned at 0.7491.
Today’s data points: Limited. US banks are closed in observance of Independence Day.
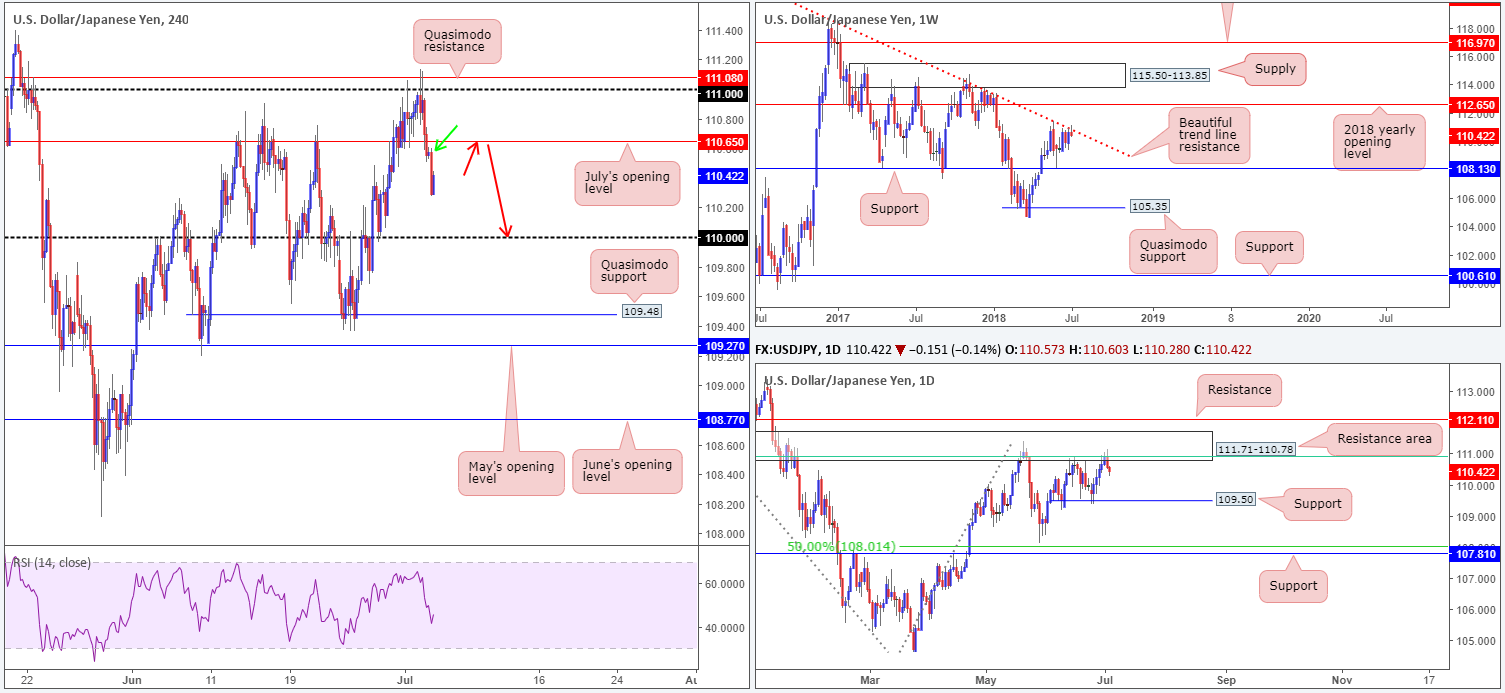
USD/JPY:
Following a strong push north last week, weekly price engaged with a trend line resistance taken from the high 123.57. Thus far, the sellers remain in the driving seat here and, in turn, could lead to a test of weekly support coming in at 108.13. Bolstering this weekly barrier is a daily resistance area seen at 111.71-110.78, which happens to house a 61.8% daily Fib resistance value at 110.91 (green line) within its limits. Note that the next downside target on this scale does not come into view until we reach the 109.50ish mark.
A closer look at price action on the H4 timeframe saw Quasimodo resistance at 111.08 (and its closely associated 111 handle) brought into play in early trade on Tuesday. Following lower US equities, along with US Treasury yields drifting beneath 2.85%, the H4 candles wiped out July’s opening level at 110.65. With little in terms of support seen until reaching the 110 handle, coupled with higher-timeframe resistances in play, lower levels are likely in the firing range today/this week.
Areas of consideration:
An idea sell setup, as far as we can see, would be for H4 price to retest the underside of July’s opening level at 110.65. Note that should this scenario come to fruition, stop-loss orders positioned above the minor H4 supply marked with a green arrow at 110.61-110.50 would be triggered. Once these stops are filled, they become buy orders, thus providing liquidity to sell from July’s opening level!
Today’s data points: Limited. US banks are closed in observance of Independence Day.
The use of the site is agreement that the site is for informational and educational purposes only and does not constitute advice in any form in the furtherance of any trade or trading decisions.
The accuracy, completeness and timeliness of the information contained on this site cannot be guaranteed. IC Markets does not warranty, guarantee or make any representations, or assume any liability with regard to financial results based on the use of the information in the site.
News, views, opinions, recommendations and other information obtained from sources outside of www.icmarkets.com.au, used in this site are believed to be reliable, but we cannot guarantee their accuracy or completeness. All such information is subject to change at any time without notice. IC Markets assumes no responsibility for the content of any linked site. The fact that such links may exist does not indicate approval or endorsement of any material contained on any linked site.
IC Markets is not liable for any harm caused by the transmission, through accessing the services or information on this site, of a computer virus, or other computer code or programming device that might be used to access, delete, damage, disable, disrupt or otherwise impede in any manner, the operation of the site or of any user’s software, hardware, data or property.


