
A note on lower timeframe confirming price action…
Waiting for lower timeframe confirmation is our main tool to confirm strength within higher timeframe zones, and has really been the key to our trading success. It takes a little time to understand the subtle nuances, however, as each trade is never the same, but once you master the rhythm so to speak, you will be saved from countless unnecessary losing trades. The following is a list of what we look for:
- A break/retest of supply or demand dependent on which way you’re trading.
- A trendline break/retest.
- Buying/selling tails – essentially we look for a cluster of very obvious spikes off of lower timeframe support and resistance levels within the higher timeframe zone.
- Candlestick patterns. We tend to only stick with pin bars and engulfing bars as these have proven to be the most effective.
For us, lower timeframe confirmation starts on the M15 and finishes up on the H1, since most of our higher timeframe areas begin with the H4.
EUR/USD:
Beginning with the weekly timeframe this morning, we can see that the EUR remains bid from support at 1.0796 (blue line) which has capped the downside to this market since the beginning of Dec 2015. The next upside target from here can be seen at 1.0983, a resistance that has also capped upside since the beginning of Dec last year.
Moving down into the pits of the daily timeframe, it’s clear to see that price is still consolidating between supply drawn from 1.0992-1.0951 and support fixed at 1.0813, and has been since the 11th Jan 2016. As can be seen from the chart, price is nearing the aforementioned supply and could very well cross swords with this barrier today. As such, traders looking to buy this market may want to bear this in mind…
Turning our attention to the H4 timeframe, psychological support 1.0900 was recently retested and looks to be well-bid for now. Given the room seen to move higher in the bigger picture (see above), we expect offers to be filled around the mid-level resistance at 1.0950 and quite possibly the supply area sitting just above it at 1.0992-1.0973. Both of these zones are on our watch list today for possible shorts, with the aforementioned supply being the more attractive of the two. The reason for why is that not only does this area sit within the extremes of the daily supply zone discussed above, but it also encapsulates the weekly level of resistance at 1.0983. Despite this, our team has pointed out that they would not consider placing pending orders at either of the above sell zones, due to the amount of times each barrier has been visited. ‘The more a tree is chopped at the weaker it becomes!’
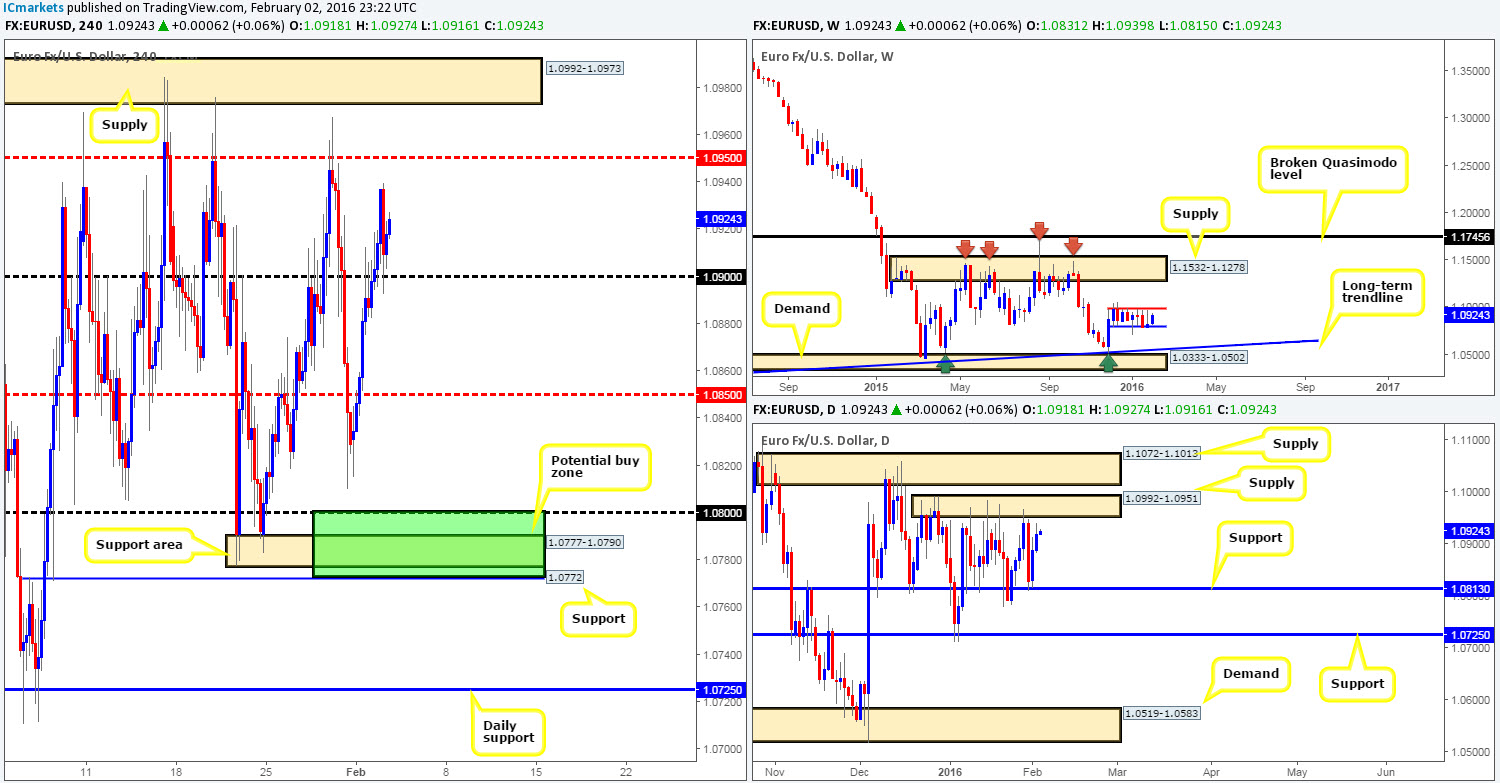
Levels to watch/live orders:
- Buys: Flat (Stop loss: N/A).
- Sells: 1.0950 [Tentative – confirmation required] (Stop loss: dependent on where one confirms this level). 1.0992-1.0973 [Tentative – confirmation required] (Stop loss: dependent on where one confirms this area).
GBP/USD:
Starting from the weekly timeframe this morning, resistance at 1.4429 recently came into play which was a level we mentioned to have on your radar this week. Down on the daily timeframe, however, supply at 1.4445-1.4360 (surrounds the current weekly resistance barrier) appears to be struggling to hold. Monday’s rather aggressive surge of buying saw the GBP cross paths with the extremes of this zone, and yesterday’s action saw very little selling interest. In the event that a push above this area takes place, traders need to be prepared for the possibility of an attack on resistance penciled in at 1.4535.
Zooming in and looking at the H4 shows that Cable recently sold off from supply seen at 1.4445-1.4409 (surrounds weekly resistance level at 1.4429), tested bids around support at 1.4351 and aggressively bounced back up to within supply. Owing to the strength of this rebound, and the fact that price action is not showing much in the way of bearish intent from the aforementioned daily supply at the moment, shorting right now is a little too risky for our liking. Nevertheless, should this unit CLOSE below H4 support today, this would, in our estimation, not only confirm selling strength from the higher-timeframe levels (see above), but also likely open the gates for further downside to at least mid-level support 1.4250. For us to be given the green light to short, however, a retest of this level as resistance would need to be seen together with a lower timeframe confirming signal.
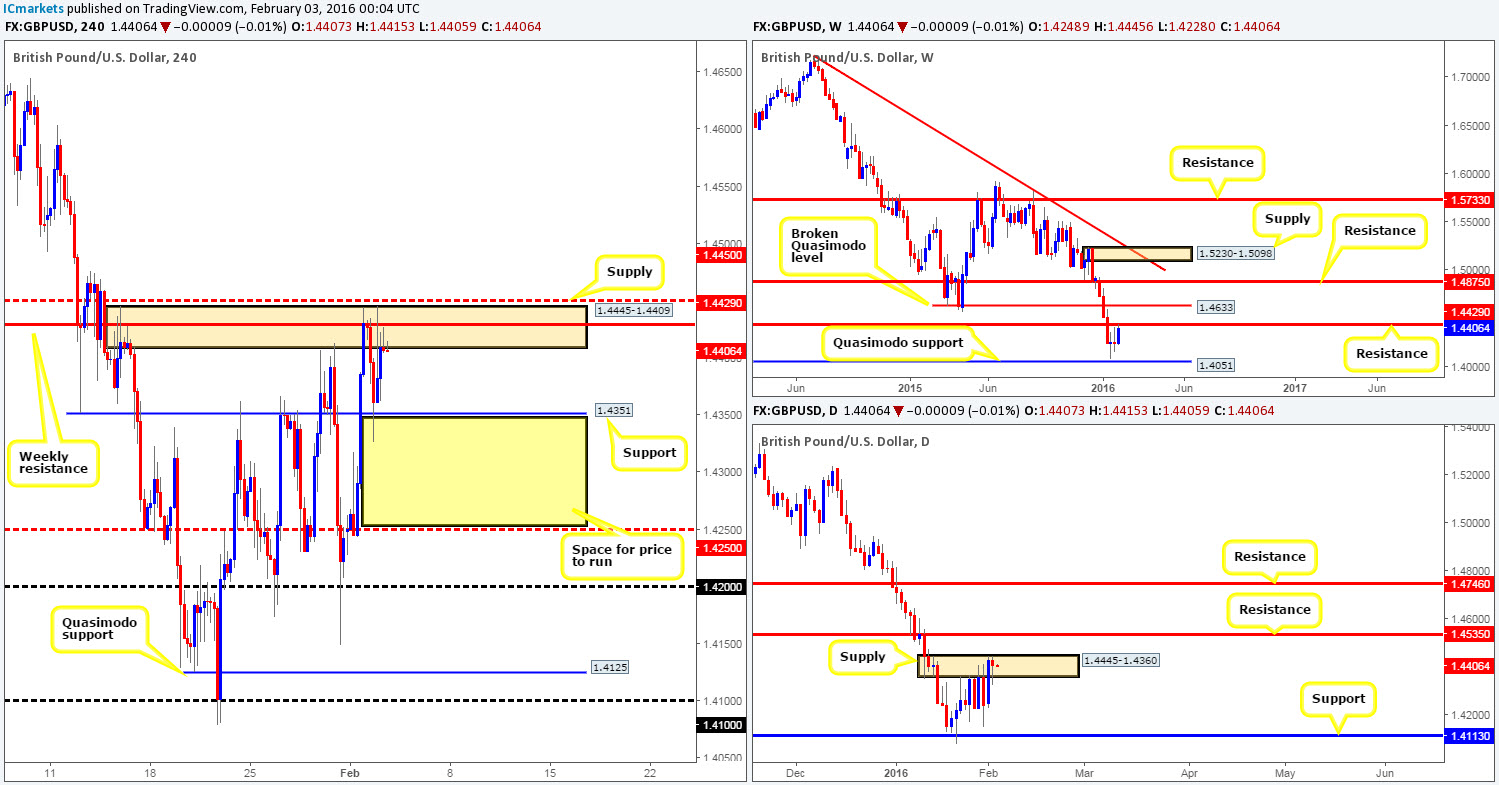
Levels to watch/live orders:
- Buys: Flat (Stop loss: N/A).
- Sells: Watch for bids to be consumed around 1.4351 and look to trade any retest of this level seen thereafter (lower timeframe confirmation required).
AUD/USD:
Based on recent price action, there appears to be a nice-looking buy setup forming. Friday’s rebound from the 61.8% Fibonacci resistance at 0.7135, coupled with Monday and Tuesday’s movement has chalked up what appears to be a H4 AB=CD pattern. What makes this pattern so attractive are the following converging structures:
- H4 support at 0.7025.
- 38.2% Fibonacci support at 0.7020 (taken from the low 0.6863).
- Weekly support at 0.7035 (fixed levels should be considered as zones rather than a definite price level in the market).
- The large psychological support number seen just below at 0.7000.
However, our buy zone for this trade is seen between the 127.2%/161.8% Fibonacci extensions of the AB=CD pattern (yellow area at 0.6978/0.7013). Should price hit our zone of interest today, we would, if there is no high-impacting news on the docket, look to go long at market from here owing to the confluence currently being seen. Stops, at least for us, would be best placed beyond the 161.8% Fibonacci level around the 0.6070 mark. In regards to targets, we’re looking at the mid-level resistance 0.7050 as our first take-profit level, followed by the 0.7100 figure as a close second.
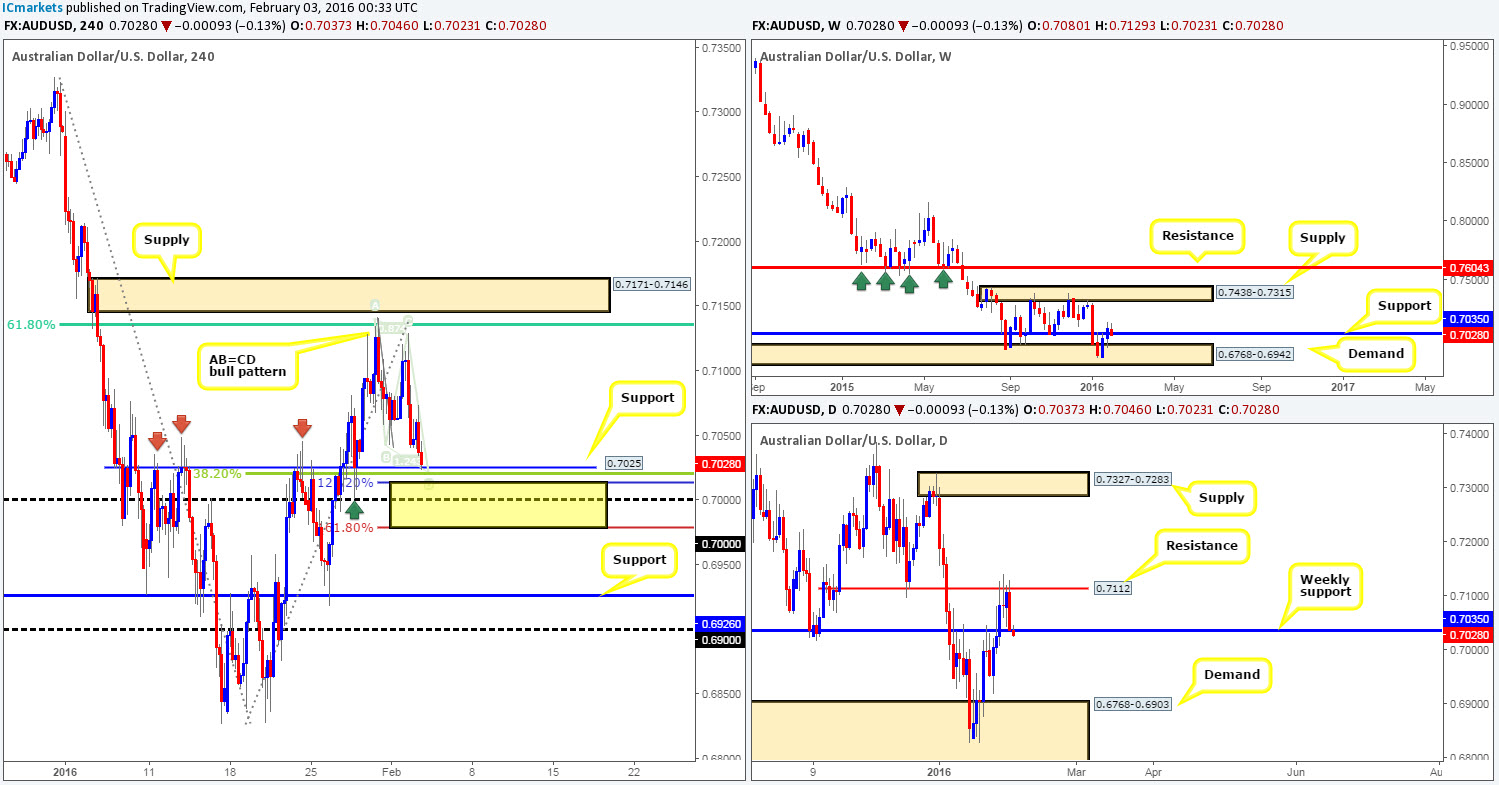
Levels to watch/live orders:
- Buys: 0.6978/0.7013 [Market buys] (Stop loss: 0.6970).
- Sells: Flat (Stop loss: N/A).
USD/JPY:
The USD/JPY has been incredibly bearish since the beginning of the week. From a technical standpoint, this is no surprise since price connected with weekly resistance at 121.62 by last week’s close. Downside targets from this angle fall in at support drawn from 118.84, followed by another support seen below it at 116.71.
During yesterday’s daily session a near full-bodied bearish candle was chalked up, consequently engulfing support (now potential resistance) at 120.16. As a result of this, further selling is possible in this market down to at least weekly support at 118.84.
Looking at the H4 chart, nevertheless, the buyers and sellers are currently seen battling for position within demand fixed from 119.69-119.43. Judging by what has been registered on the higher-timeframe picture (see above), this demand is not likely going to hold for very long. That being the case, we are currently eyeing the psychological support 119.00 and the H4 demand area seen just below it at 118.48-118.77. Not only is this a strong demand area by and of itself, it has the added advantage of sitting on top of daily demand at 117.65-118.62, and just below weekly support at 118.84. We’re sure you’ll agree with us in saying that this area has far more confluence than the H4 demand seen above it!
Given the points made above, our team is prepared to wait and see if price reaches the 119.00 region today. If it does, we’d begin hunting for lower timeframe buy entries within this market between this number and the H4 demand. You may be wondering why we would still require lower timeframe confirmation with such a confluent zone… Well, the only reason we are opting for the safe route here is simply because price could still drive lower (a low lower) into the daily demand before buyers step in.
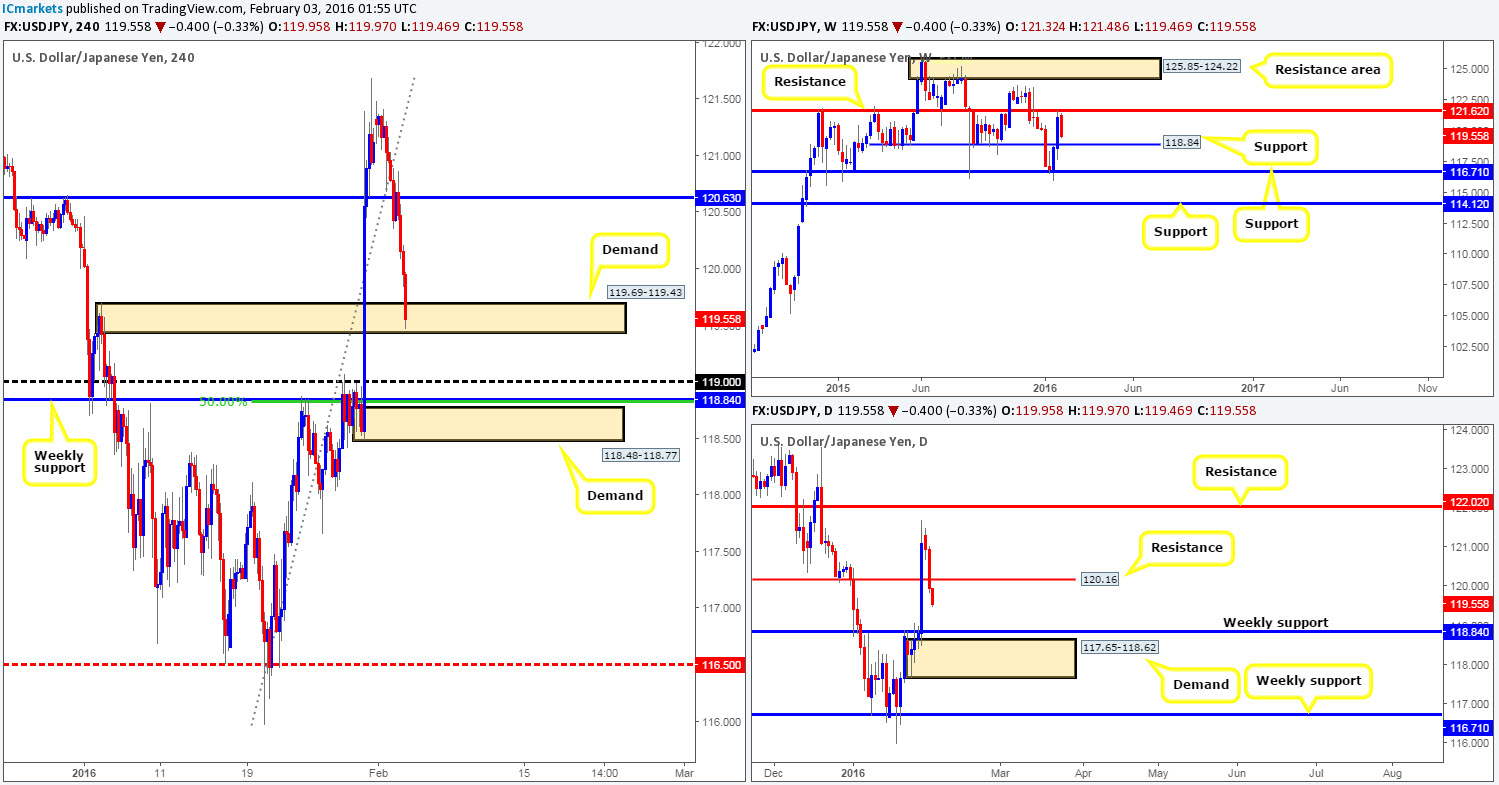
Levels to watch/live orders:
- Buys: 119.00/118.48 [Tentative – confirmation required] (Stop loss: dependent on where one confirms this area).
- Sells: Flat (Stop loss: N/A).


