
A note on lower timeframe confirming price action…
Waiting for lower timeframe confirmation is our main tool to confirm strength within higher timeframe zones, and has really been the key to our trading success. It takes a little time to understand the subtle nuances, however, as each trade is never the same, but once you master the rhythm so to speak, you will be saved from countless unnecessary losing trades. The following is a list of what we look for:
- A break/retest of supply or demand dependent on which way you’re trading.
- A trendline break/retest.
- Buying/selling tails/wicks – essentially we look for a cluster of very obvious spikes off of lower timeframe support and resistance levels within the higher timeframe zone.
- Candlestick patterns. We tend to stick with pin bars and engulfing bars as these have proven to be the most effective.
We search for lower timeframe confirmation between the M15 and H1 timeframes, since most of our higher-timeframe areas begin with the H4. Stops are usually placed 5-10 pips beyond confirming structures.
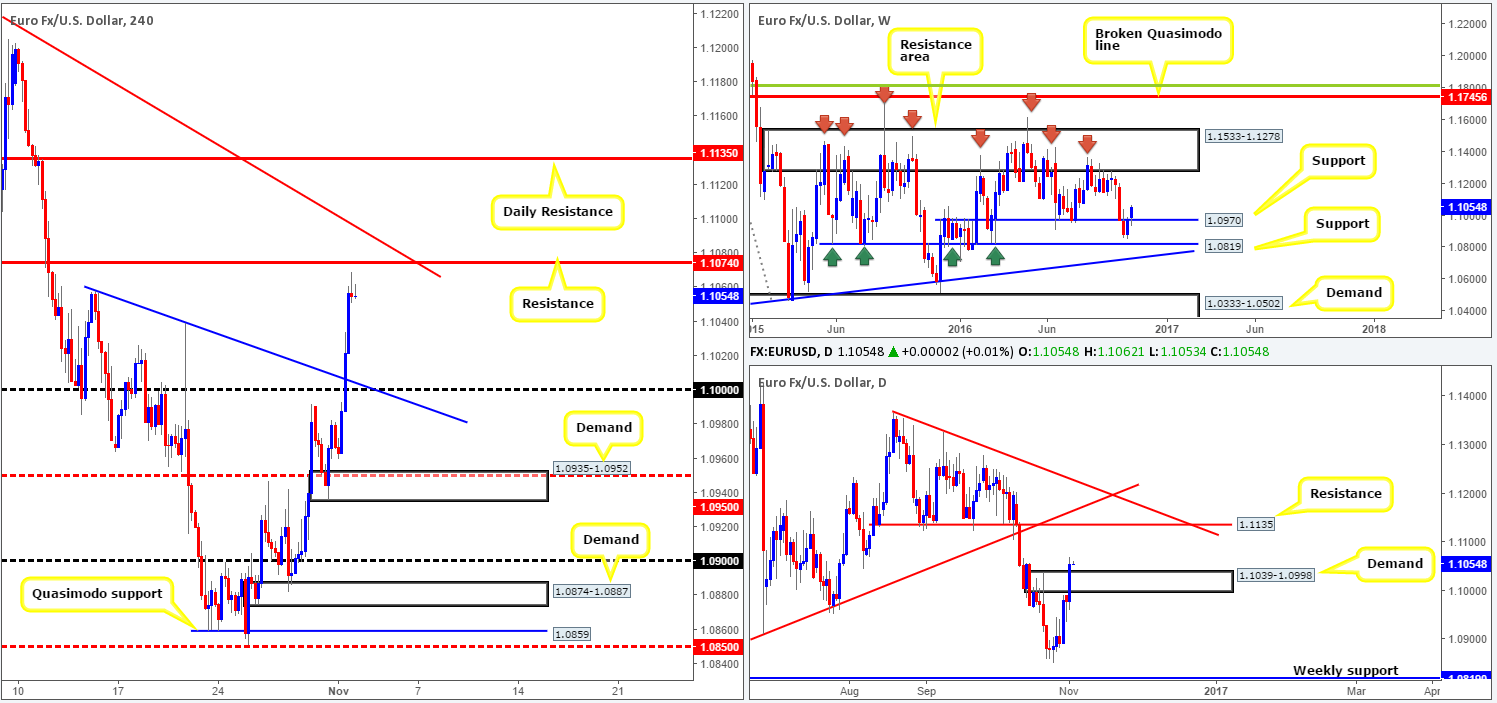
EUR/USD:
(Trade update: took a loss at 1.1025 – for details see Tuesday’s report)
Across the board, we saw the US dollar aggressively decline in value as the latest US election polls shows the gap between Trump and Clinton has shortened. In consequence to this recent move, the US dollar index is now seen kissing a H4 support at 97.69.
The dollar selling, as you can see, prompted the EUR to break above the key figure 1.10, consequently sending the pair to fresh highs of 1.1068 on the day. What this recent bout of buying also did was engulf daily supply at 1.1039-1.0998 (now acting demand), which, as we mentioned in previous reports, would need to be consumed before we’d consider last week’s close above weekly resistance at 1.0970 (now acting support) to be genuine. As a result of this, the next higher-timeframe target to have an eyeball on right now is the daily resistance drawn from 1.1135.
Although the higher-timeframe picture suggests buying right now, the H4 candles unfortunately topped out just ahead of a resistance level coming in at 1.1074. Not only this, but there’s also a nearby H4 trendline resistance seen lurking just above (1.1279).
Our suggestions: We see two options here:
- Wait and see if the H4 chart reverses and retests the 1.10 figure. This could, given that it boasts H4 trendline support extended from the high 1.1056, potentially be a nice barrier to look for longs from (H4 bullish close required since a fakeout is likely).
- Wait for a close to form above both the current H4 resistance and H4 trendline resistance. That way, the path would, as far as we can see, be clear up to the above said daily resistance at 1.1135. To trade this move, we’d advise waiting for a retest of the broken barriers as support followed by a H4 bull candle.
Data points to consider: US ADP employment change at 12.15pm along with the decision and statement from the FOMC at 6pm GMT.
Levels to watch/live orders:
- Buys: 1.10 ([H4 bullish close required) stop loss: ideally beyond the trigger candle). Watch for a close above both the current H4 resistance and H4 trendline resistance and then look to trade any retest seen thereafter (H4 bullish close required – stop loss: ideally beyond the trigger candle).
- Sells: Flat (stop loss: N/A).
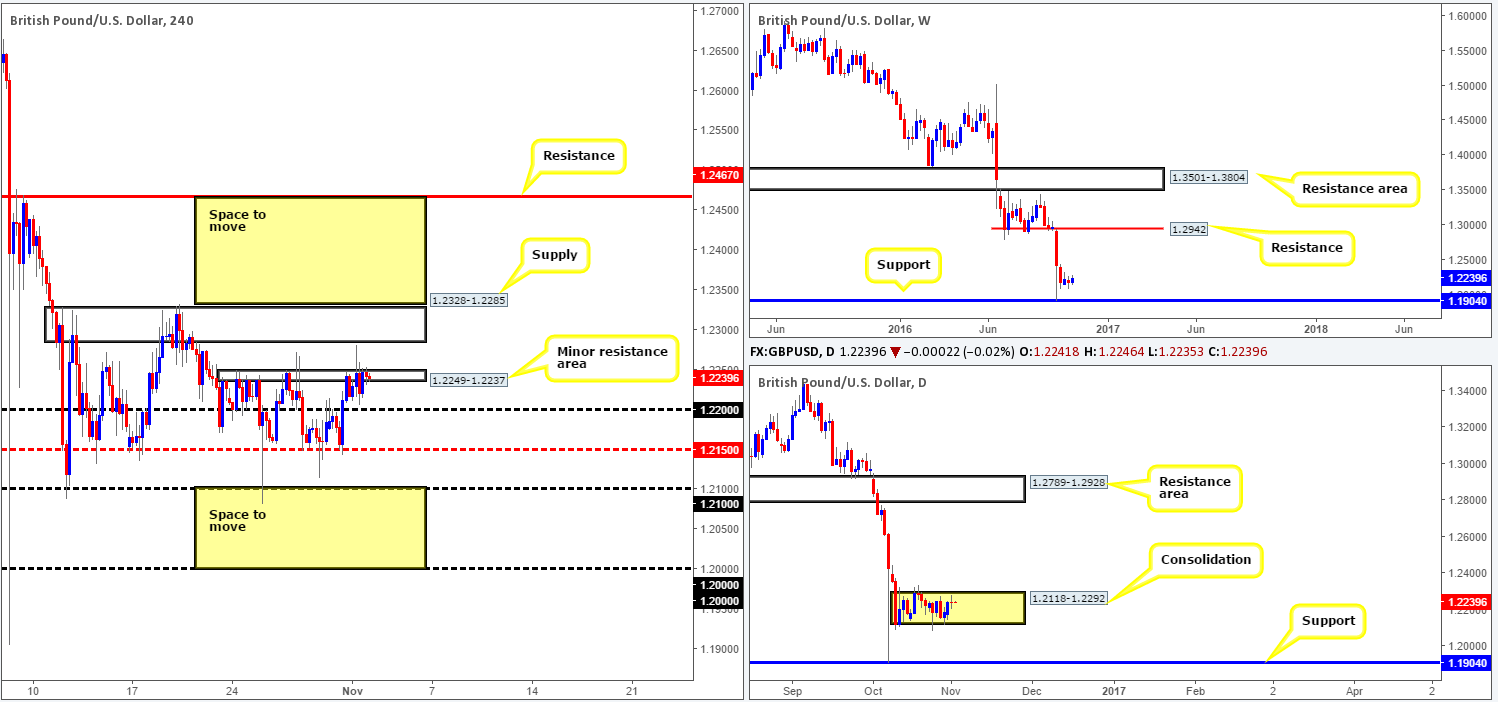
GBP/USD:
Sterling saw little response to yesterday’s manufacturing PMI report, as the pair spent the day hugging the underside of a minor H4 resistance area coming in at 1.2249-1.2237, resulting in a daily indecision candle being formed. As far as the H4 chart is concerned, our outlook remains the same: unless a decisive close is seen above both the aforementioned H4 minor resistance area, and the H4 supply sitting directly above it at 1.2328-1.2285, our team would not be comfortable buying this market. A close above this supply would also take out the top edge of the daily range (1.2292), thus potentially clearing the path north toward H4 resistance at 1.2467. To become sellers, however, a close below the 1.21 neighborhood would be ideal, since this takes out the lower edge of the daily consolidation (1.2118) and opens up downside to the key figure 1.20. Nevertheless, do keep in mind that by shorting here, you’re effectively selling into a large monthly demand which can be seen here:
Our suggestions: Once a close takes shape (see above in bold), we would require a subsequent retest of that area to be seen followed up by a H4 candle close to permit a trade. Patience is key here as this is not the most attractive market to trade right now!
Data points to consider: UK construction PMI at 9.30am, US ADP employment change at 12.15pm along with the decision and statement from the FOMC at 6pm GMT.
Levels to watch/live orders:
- Buys: Watch for a close above the H4 supply at 1.2328-1.2285 and then look to trade any retest seen thereafter (H4 bullish close required – stop loss: ideally beyond the trigger candle).
- Sells: Watch for a close below the 1.21 handle and then look to trade any retest seen thereafter (H4 bearish close required – stop loss: ideally beyond the trigger candle).
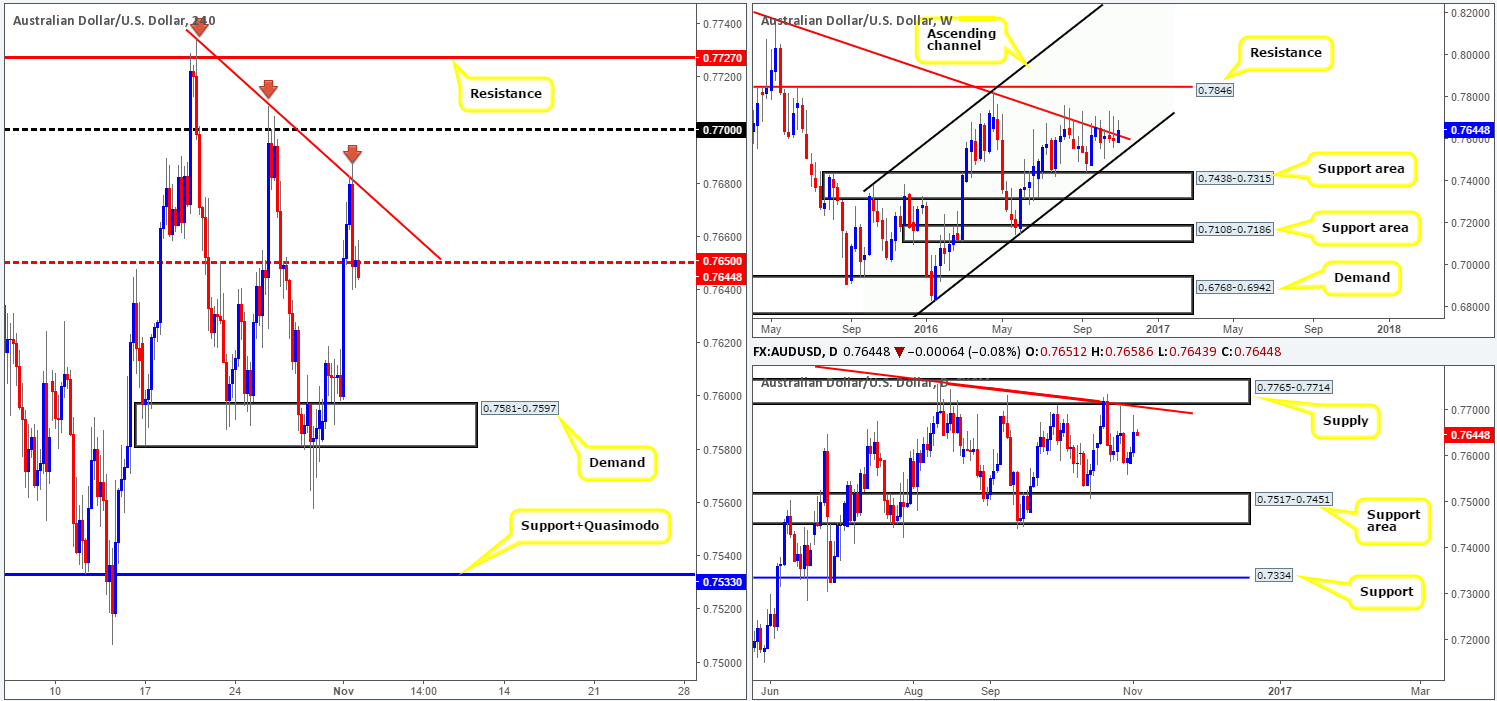
AUD/USD:
The after-effects of the RBA (Reserve Bank of Australia) leaving monetary policy unchanged coupled with better than expected Chinese manufacturing data, saw the commodity currency stage a rather impressive rally yesterday. The H4 mid-way resistance 0.7650 was taken out, leaving price free to tag in offers from a H4 trendline resistance extended from the high 0.7734, which, as you can see, was respected going into the early hours of US trading, consequently bringing the unit back down to the 0.7650 region by the close.
Our suggestions: As of current price, there’s very little that sparks our interest. The reason for why is that over on the weekly chart, the candle is seen trading above the trendline resistance drawn from the high 0.8295, and daily price is effectively loitering mid-range between a support area at 0.7517-0.7451 (intersects with the weekly ascending channel support line drawn from the low 0.6827 – the next downside target on the weekly timeframe), and a supply coming in at 0.7765-0.7714 (boasted by a trendline resistance taken from the high 0.7835).
However, should the pair slip below bids at 0.7650 today and touch gloves with the H4 demand at 0.7581-0.7597, our team will then be watching for a continuation move below this H4 demand. Should this come into view, wait for a retest to the underside of this zone followed up by a H4 bearish close. Once this has been satisfied, a short from here is, at least in our book, valid down to the combined H4 support/Quasimodo at 0.7533 that sits directly above the aforementioned daily support area.
Data points to consider: AUD building approvals at 12.30am, US ADP employment change at 12.15pm along with the decision and statement from the FOMC at 6pm GMT.
Levels to watch/live orders:
- Buys: Flat (stop loss: N/A).
- Sells: Watch for a close below the H4 demand at 0.7581-0.7597 and then look to trade any retest seen thereafter (H4 bearish close required – stop loss: ideally beyond the trigger candle).
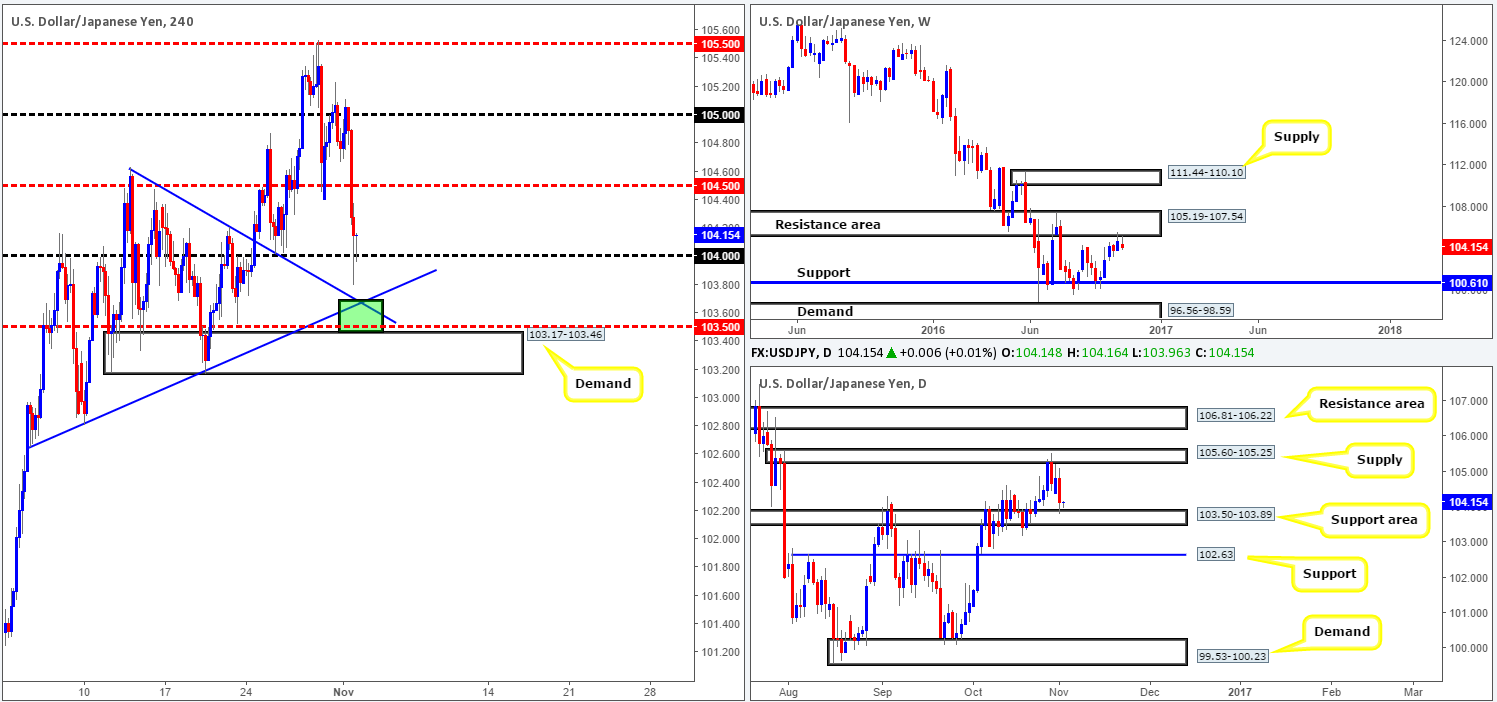
USD/JPY:
Fueled by losses seen in the US equity market coupled with the latest US election polls showing the gap between Trump and Clinton has shortened, the USD/JPY pair sold off from the 105 handle going into yesterday’s London segment. H4 mid-way support 104.50 was wiped out, allowing price to cross swords with the 104 handle by the day’s end.
While the 104 handle is currently holding ground, there’s a particularly attractive H4 buy zone seen just below it at 103.46/103.68 (green zone) comprising of two converging H4 trendlines (104.63/102.65), the top edge of a H4 demand at 103.46 and a H4 mid-way support drawn from 103.50. Furthermore, this base is also bolstered by a daily support area coming in at 103.50-103.89. The only grumble our desk has here is the fact that weekly action is seen selling off from supply given at 105.19-107.54.
Our suggestions: Although there’s a possibility that weekly sellers may overshadow the aforementioned H4 buy zone, a bounce from this area is still feasible. To be on the safe side, nonetheless, we would require a reasonably sized H4 bullish close to take shape before pulling the trigger, as in our view this indicates buying interest at out chosen area.
Data points to consider: US ADP employment change at 12.15pm along with the decision and statement from the FOMC at 6pm GMT.
Levels to watch/live orders:
- Buys: 103.46/103.68 area ([H4 bullish close required) stop loss: ideally beyond the trigger candle).
- Sells: Flat (stop loss: N/A).
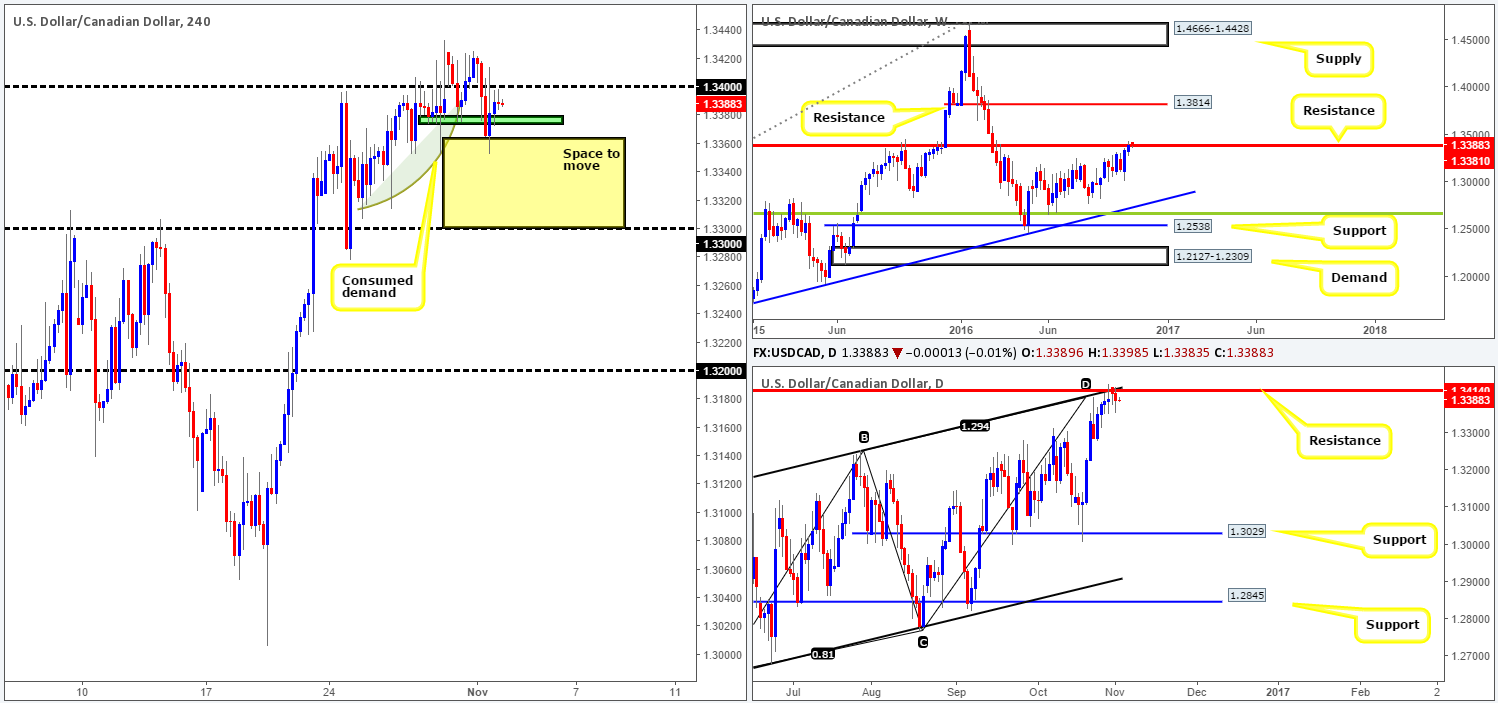
USD/CAD:
During the course of yesterday’s sessions, the H4 candles slipped below the 1.34 neighborhood and pierced through the (green zone) minor H4 support area at 1.3374-1.3379. The bears, however, as you can see, were unable to sustain this momentum as price reversed from lows of 1.3353 and retested the underside of 1.34 as resistance.
Given that the daily resistance at 1.3414, which boasts an AB=CD completion point around the 1.3384ish range and a channel resistance taken from the high 1.3241, remains intact, our desk is still bearish this market UNTIL we see a daily close printed above this level.
Our suggestions: If price closes beyond the H4 green shaded area at 1.3374-1.3379, we see little active H4 demand stopping prices from challenging the 1.33 band. We would, however, only consider this a tradable move following a retest to the underside of 1.3374-1.3379 along with a H4 bearish close.
Data points to consider: US ADP employment change at 12.15pm along with the decision and statement from the FOMC at 6pm GMT.
Levels to watch/live orders:
- Buys: Flat (stop loss: N/A).
- Sells: Watch for a close below the H4 area at 1.3374-1.3379 and then look to trade any retest seen thereafter (H4 bearish close required – stop loss: ideally beyond the trigger candle).
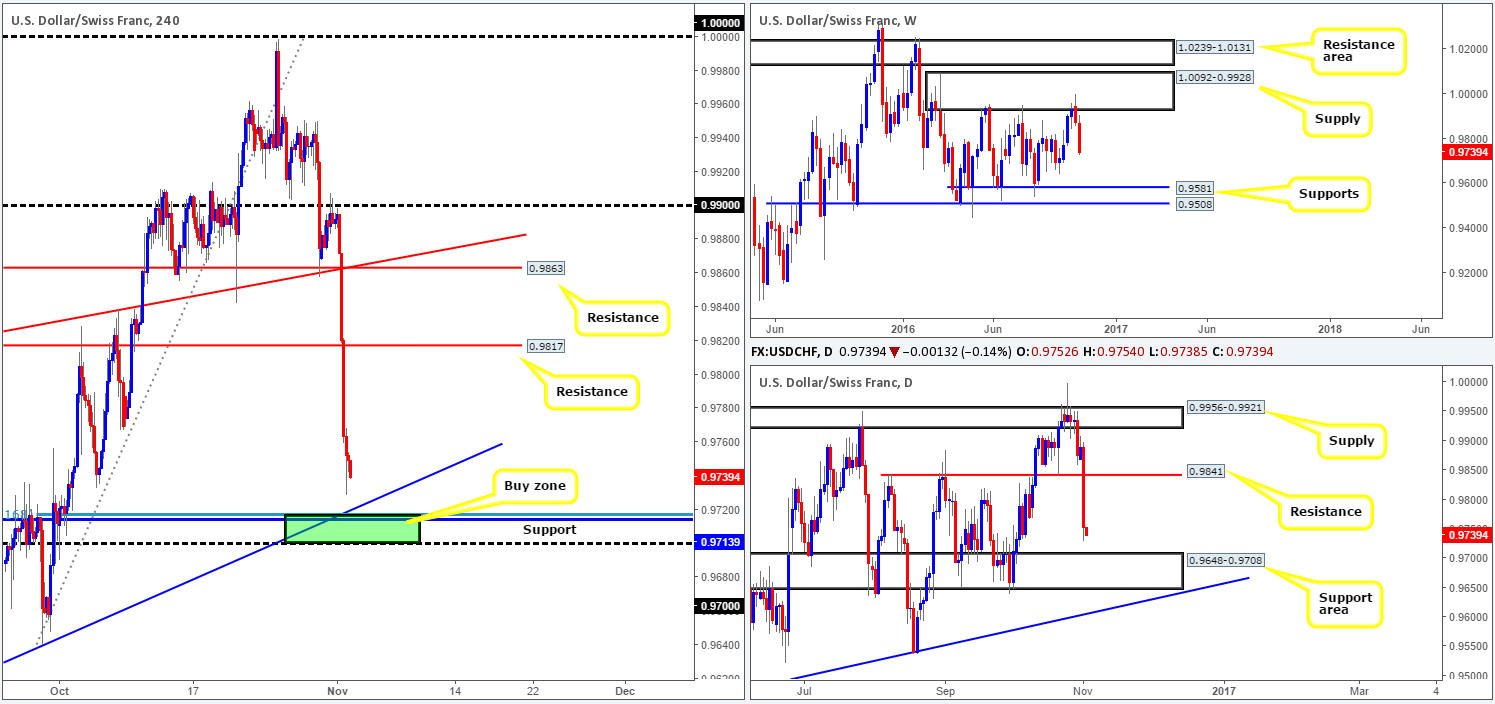
USD/CHF:
Kicking things off with a look at the weekly chart this morning, we can see that price extended last week’s bounce from the supply at 1.0092-0.9928 down to lows of 0.9728 yesterday. In the event that the bears remain in the driving seat here, the next barrier of interest falls in at 0.9581: a support level. Slipping down to the daily chart, yesterday’s bearish descent took out support at 0.9841 (now acting resistance), and now looks to be on course to connect with a support area coming in at 0.9648-0.9708.
After our analysis of the EUR/USD pair (see above), it should not come as much of a surprise to see that the Swissy took a tumble yesterday given how inversely correlated these two markets are. This rather aggressive drop in value was due to the latest US election polls showing the gap between Trump and Clinton has tightened.
Our suggestions: Even though the weekly chart suggests further selling may be on the cards, our desk has noted a particularly interesting H4 buy zone. Consisting of a H4 support level at 0.9713, a H4 78.6% Fib at 0.9716, a H4 trendline support taken from the low 0.9537 and the 0.97 handle, which is topped off by being housed within the top edge of the above mentioned daily support area. For that reason, we feel a bounce from this region will likely take place. However, knowing that we are effectively buying against weekly sellers here, it would be prudent to wait for at least a H4 bullish close to form prior to pulling the trigger.
Data points to consider: US ADP employment change at 12.15pm along with the decision and statement from the FOMC at 6pm GMT.
Levels to watch/live orders:
- Buys: 0.97/0.9716 area ([H4 bullish close required) stop loss: ideally beyond the trigger candle).
- Sells: Flat (stop loss: N/A).
DOW 30:
Equities took a pounding yesterday over concerns surrounding the upcoming US elections and the possibility of a US rate hike. The DOW snowballed south going into the early hours of the US segment, taking out bids at a H4 support drawn from 18066, and just recently the H4 Quasimodo support at 17999 (both now acting resistances). With the path seen clear down to H4 demand penciled in at 17867-17911, an area that held price beautifully on the 12/09, we could be in for further downside today.
Turning our attention over to the bigger picture, the weekly candle is seen toying with a support level at 17977, while down on the daily chart, support at 18018 was taken out, consequently opening up the gates for prices to challenge demand at 17710-17863.
Our suggestions: On account of how well respected the H4 demand at 17867-17911 was in September, and the fact that it sits directly on top of the aforementioned daily demand and is also located nearby the current weekly support, we feel a long from this boundary is valid. Be that as it may, with US elections only a week away, volatile moves are possible. Therefore, we would advise waiting for at least a H4 bullish close to form before looking to enter long here.

Levels to watch/live orders:
- Buys: 17867-17911 ([H4 bullish close required] stop loss: ideally beyond the trigger candle).
- Sells: Flat (stop loss: N/A).
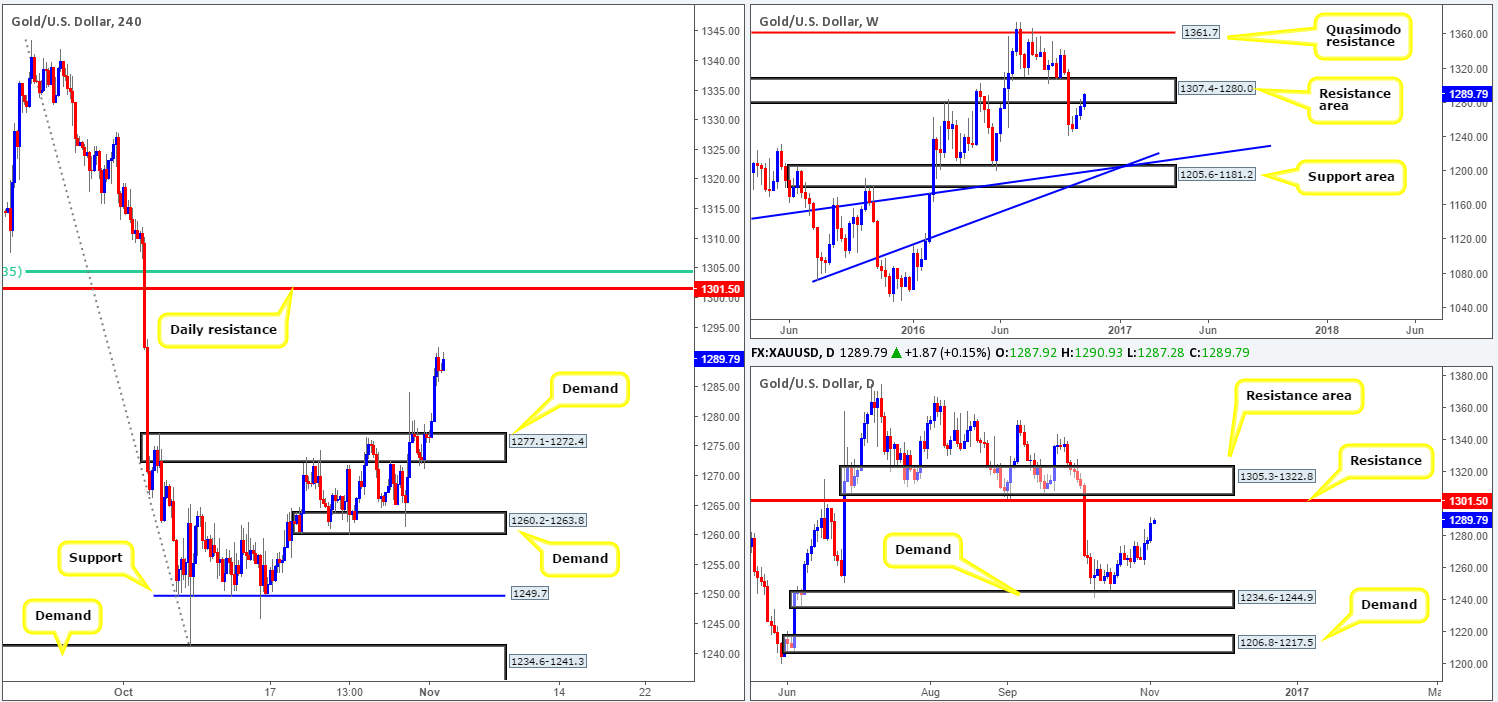
GOLD:
With the US dollar taking a hit yesterday, we saw the yellow metal react by rallying higher. H4 supply at 1277.1-1272.4 (now acting demand) was taken out as a result, and this allowed bullion to clock a high of 1291.7 into the close. We initially reported that should price retest this H4 boundary as demand followed by a reasonably sized H4 bull candle, one could look to go long from here targeting the daily resistance level at 1301.5. Unfortunately, there was no retest seen.
Our suggestions: Ok, on the weekly chart we know that price currently occupies a resistance area coming in at 1307.4-1280.0. Additionally, we know that the above said daily resistance level sits within the top edge of this weekly resistance area. Following on from this, we can see from the H4 chart that the highway north is relatively ‘resistance free’ up to that said daily resistance. On account of these points, our team is now watching the daily resistance level at 1301.5 very carefully, as between here and the H4 61.8% Fib resistance at 1304.5 (green line), a bounce is likely to take place.
Of course, it is down to the individual trader how he/she wishes to enter short here. Considering ourselves to be relatively conservative we’re opting to wait for a H4 bearish close to form, prior to pulling the trigger.
Levels to watch/live orders:
- Buys: Flat (stop loss: N/A).
- Sells: 1304.5-1301.5 ([H4 bearish close required] stop loss: ideally beyond the trigger candle).


