
Waiting for lower timeframe confirmation is our main tool to confirm strength within higher timeframe zones, and has really been the key to our trading success. It takes a little time to understand the subtle nuances, however, as each trade is never the same, but once you master the rhythm so to speak, you will be saved from countless unnecessary losing trades. The following is a list of what we look for:
- A break/retest of supply or demand dependent on which way you’re trading.
- A trendline break/retest.
- Buying/selling tails/wicks – essentially we look for a cluster of very obvious spikes off of lower timeframe support and resistance levels within the higher timeframe zone.
We typically search for lower-timeframe confirmation between the M15 and H1 timeframes, since most of our higher-timeframe areas begin with the H4. Stops are usually placed 1-3 pips beyond confirming structures.
EUR/USD:
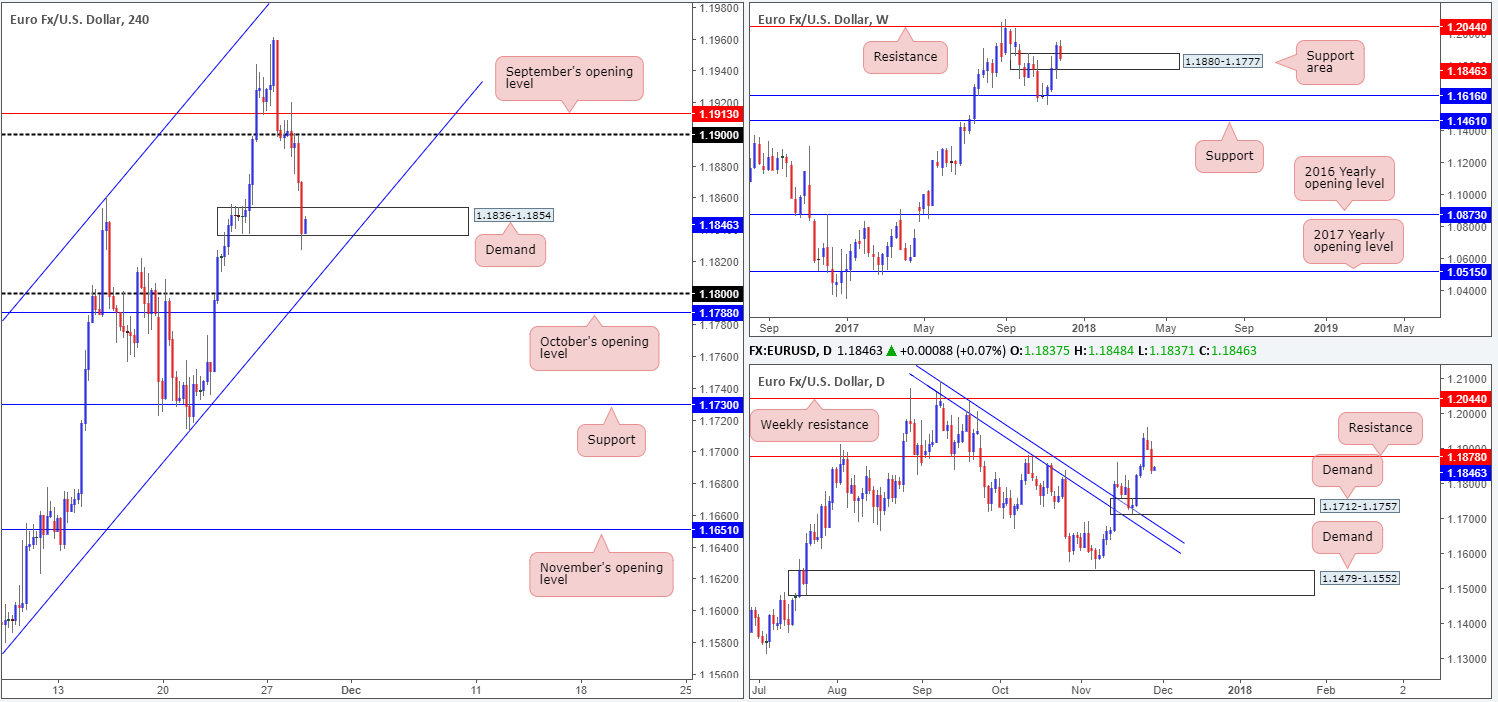
The EUR/USD sustained further losses during Tuesday’s sessions following a retest of the 1.19 handle as resistance. As you can see, the day ended with H4 price ripping through the lower edge of a H4 demand pegged at 1.1836-1.1854. One can almost feel the pain caused by this move as stop-loss orders were highly likely triggered here. Better-than-expected US consumer confidence, a strong dollar and comments from Fed Chair designate Powell regarding a possible interest rate hike in December, all contributed to yesterday’s selloff.
Although the pair crossed below daily support at 1.1878 yesterday, which according to the daily timeframe shows further downside could be possible to as far south as daily demand seen at 1.1712-1.1757, let’s keep in mind that there is a weekly support area at 1.1880-1.1777 also in play.
Suggestions: To our way of seeing things this is a difficult market to trade. It would be a chancy move to sell into the current weekly support area, regardless of where daily and H4 price is trading. Likewise, we would feel uncomfortable buying this unit knowing that H4 demand was recently whipsawed, alongside daily action showing room to press lower after crossing below daily support.
Considering the above, the team has decided to remain on the sidelines for the time being.
Data points to consider: German prelim CPI m/m; Spanish flash CPI y/y at 8am; US prelim GDP q/q and FOMC member Dudley speech at 1.30pm; Fed Chair Yellen testifies and US pending home sales m/m at 3pm GMT.
Levels to watch/live orders:
- Buys: Flat (stop loss: N/A).
- Sells: Flat (stop loss: N/A).
GBP/USD:
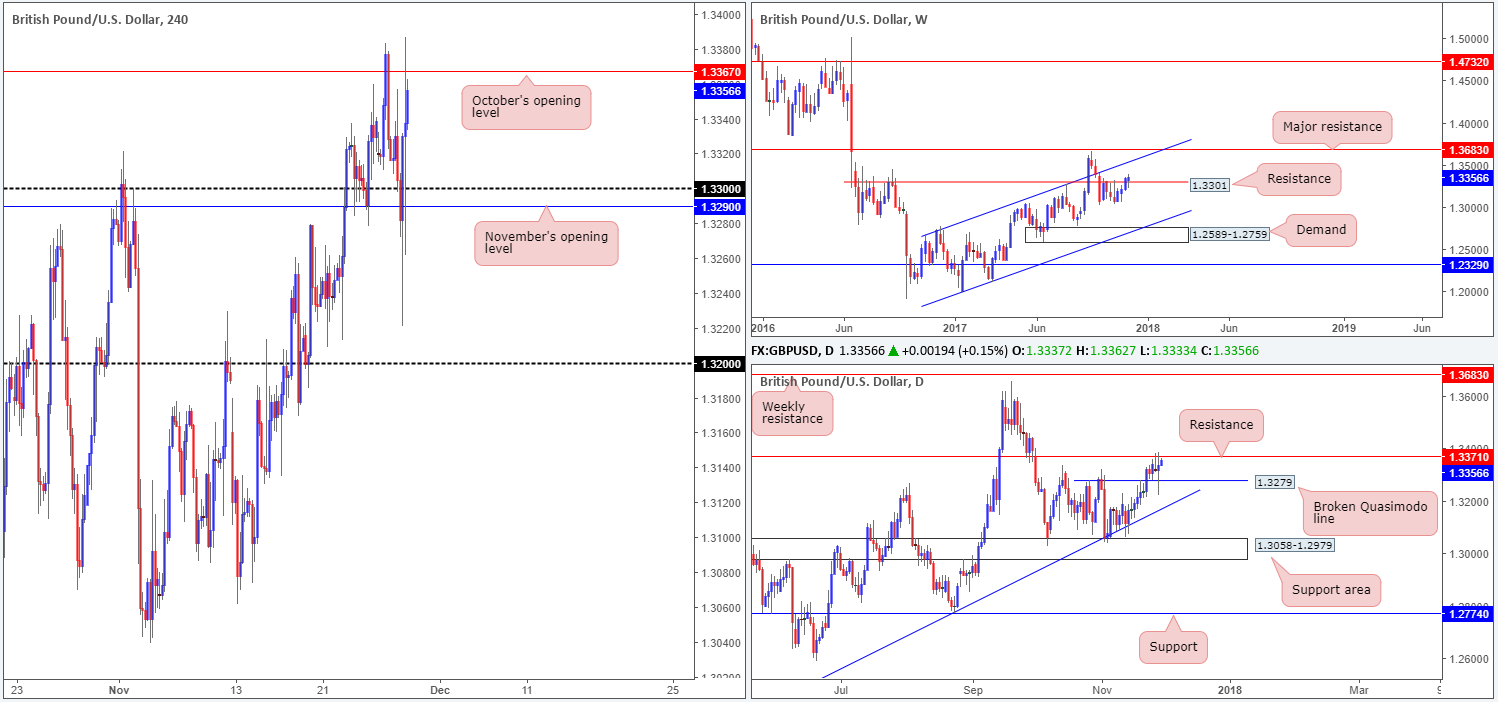
The GBP/USD fluctuated wildly amid Tuesday’s US morning segment. According to the Telegraph newspaper, British and EU negotiators had reached a deal over the Brexit bill. The impact of this report drove the British pound aggressively north in a matter of minutes, reaching highs of 1.3386 on the day. The pair, however, struggled to extend its gains after a British government official told Reuters that they did not recognize the newspaper’s account on the matter.
As we write, upside is capped by October’s opening level seen on the H4 timeframe at 1.3367, as well as a nearby daily resistance line at 1.3371. On the other side of the field, nevertheless, we can see that weekly price remains hovering above weekly resistance at 1.3301. Further buying from this point would likely bring the weekly channel resistance line extended from the high 1.2673 into the fray.
Entering long in this market on the basis of where weekly price is currently trading is not something we would advise. Not only is it far too early to discredit the current weekly resistance, you would also effectively be buying into both H4 and daily resistance. A sell from Oct’s open level would, in our humble view, have better odds given its connection to daily resistance. Despite this, we are not willing to trade from here knowing that weekly price was able to close (albeit marginal) above weekly resistance.
Suggestions: On account of the above findings, we’ll be remaining on the sidelines for the time being.
Data points to consider: UK net lending to individuals m/m at 9.30am; BoE Gov. Carney speaks at 2pm; MPC member Ramsden speaks at 2.45pm; US prelim GDP q/q and FOMC member Dudley speech at 1.30pm; Fed Chair Yellen testifies and US pending home sales m/m at 3pm GMT.
Levels to watch/live orders:
- Buys: Flat (stop loss: N/A).
- Sells: Flat (stop loss: N/A).
AUD/USD:
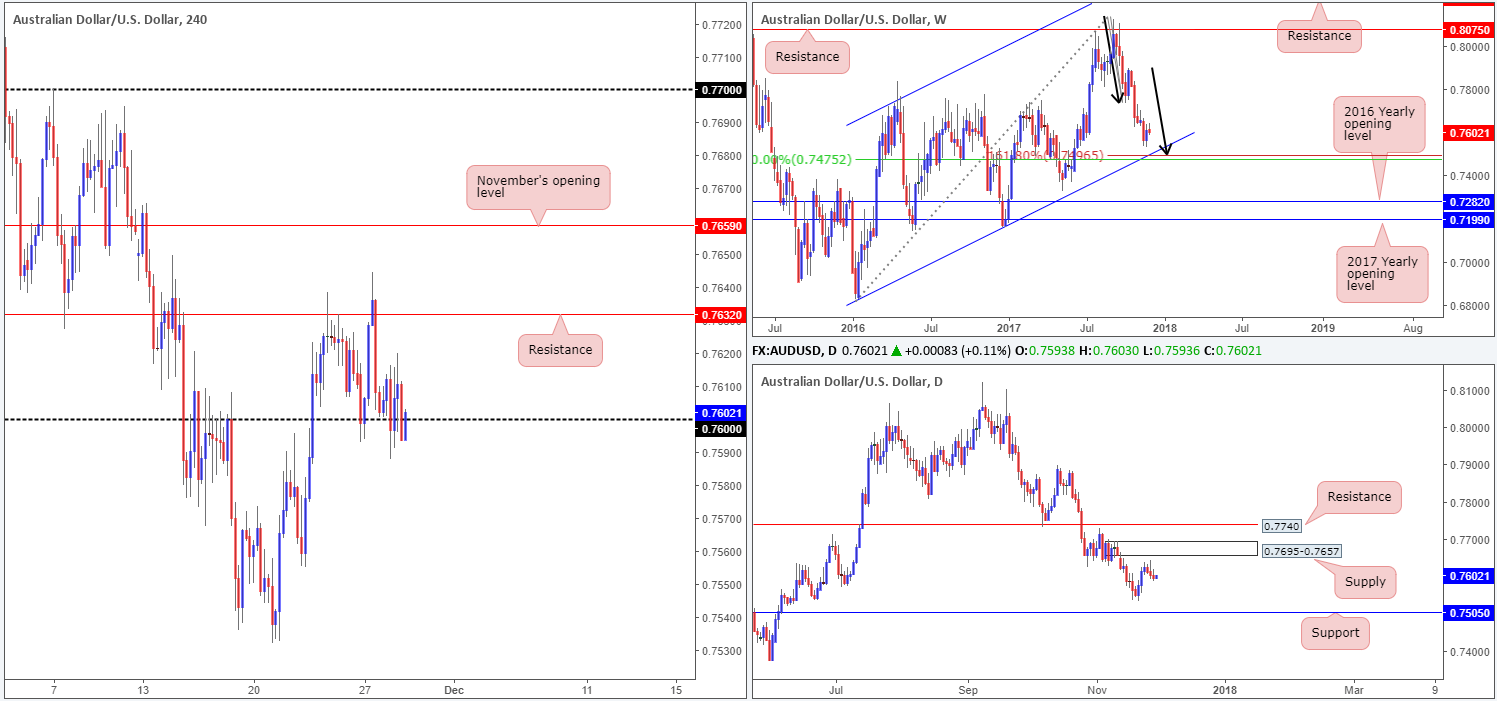
AUD/USD prices are effectively unchanged again this morning, down just 0.01% on Tuesday. The commodity currency was somewhat directionless as it seesawed back and forth between the 0.76 handle. Given yesterday’s lackluster performance, much of the following report will echo a similar outlook to Tuesday’s analysis.
Although the commodity currency recouped some of its recent losses last week, weekly structure, in our view, remains unchanged from the previous weekly outlook. To the downside there is a particularly interesting weekly support we have our eye on. Merging with a weekly channel support extended from the low 0.6827, there’s a nice-looking weekly AB=CD (see black arrows) 161.8% Fib ext. point at 0.7496 that also aligns with a weekly 50.0% value at 0.7475 taken from the high 0.8125.
The story on the daily timeframe, nevertheless, shows that there is room for price to advance up to a nearby daily supply area coming in at 0.7695-0.7657. Looking to the downside, we do not see much stopping price from challenging the 21/11 low at 0.7532, followed closely by daily support penciled in at 0.7505.
Suggestions: Although the higher timeframes shows space to move to the downside (see above), H4 sellers will need to prove themselves before we’d consider a short in this market. A decisive H4 close below 0.76, followed up with a retest and a reasonably sized H4 full or near-full-bodied bearish candle would, in our book, be enough to warrant a sell, with an ultimate target set at 0.75 (a strong buy zone).
Data points to consider: US prelim GDP q/q and FOMC member Dudley speech at 1.30pm; Fed Chair Yellen testifies and US pending home sales m/m at 3pm GMT.
Levels to watch/live orders:
- Buys: Flat (stop loss: N/A).
- Sells: Watch for H4 price to engulf 0.76 and then look to trade any retest seen thereafter ([waiting for a reasonably sized H4 bearish candle to form following the retest – preferably a full or near-full-bodied candle – is advised] stop loss: ideally beyond the candle’s wick).
USD/JPY:
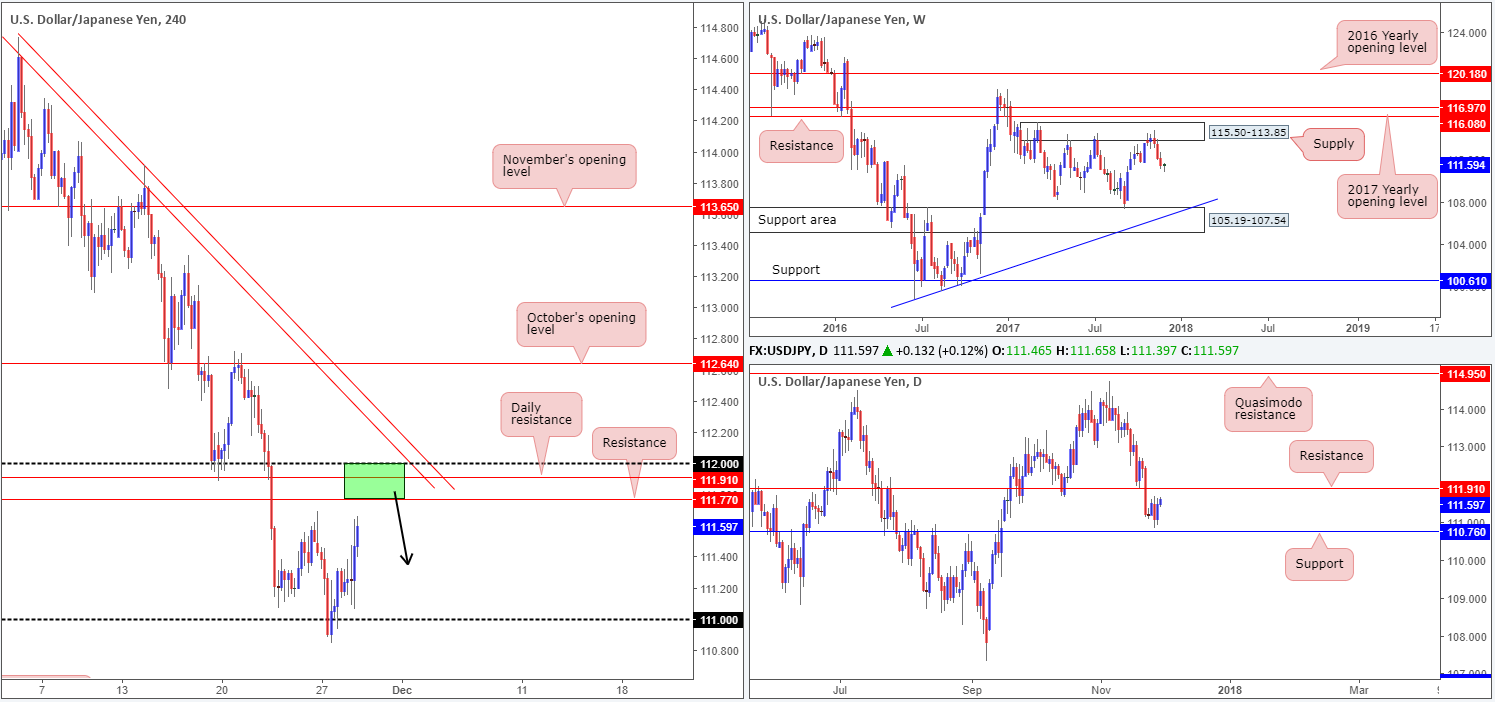
Despite a heavily bid US equity market on Tuesday and a hawkish Powell testimony, the USD/JPY had a relatively subdued session, up 0.42% on the day. As is evident from the H4 timeframe, H4 price is nearing Monday’s highs at 111.69, shadowed closely by H4 resistance at 111.70 and the daily resistance level at 111.91/112 handle. This – coupled with weekly price chalking up three back-to-back weekly bearish candles from weekly supply at 115.50-113.85 – is an incredibly bearish market, in our view. On top of this, weekly price also shows room to trade as far south as the weekly support area at 105.19-107.54, which aligns with a weekly trendline support taken from the low 98.78.
Suggestions: Given the current landscape, the green area on the H4 timeframe at 112/111.77 is a zone we expect the sellers to respond from. We would not recommend placing pending orders here since the psychological band 112 could attract a fakeout. Instead, consider exercising some patience. Wait for a H4 full or near-full-bodied bear candle to form within/around the area. This will help avoid an unnecessary loss.
Data points to consider: US prelim GDP q/q and FOMC member Dudley speech at 1.30pm; Fed Chair Yellen testifies and US pending home sales m/m at 3pm GMT.
Levels to watch/live orders:
- Buys: Flat (stop loss: N/A).
- Sells: 112/111.77 ([waiting for a reasonably sized H4 bearish candle to form – preferably a full or near-full-bodied candle – is advised] stop loss: ideally beyond the candle’s wick).
USD/CAD:
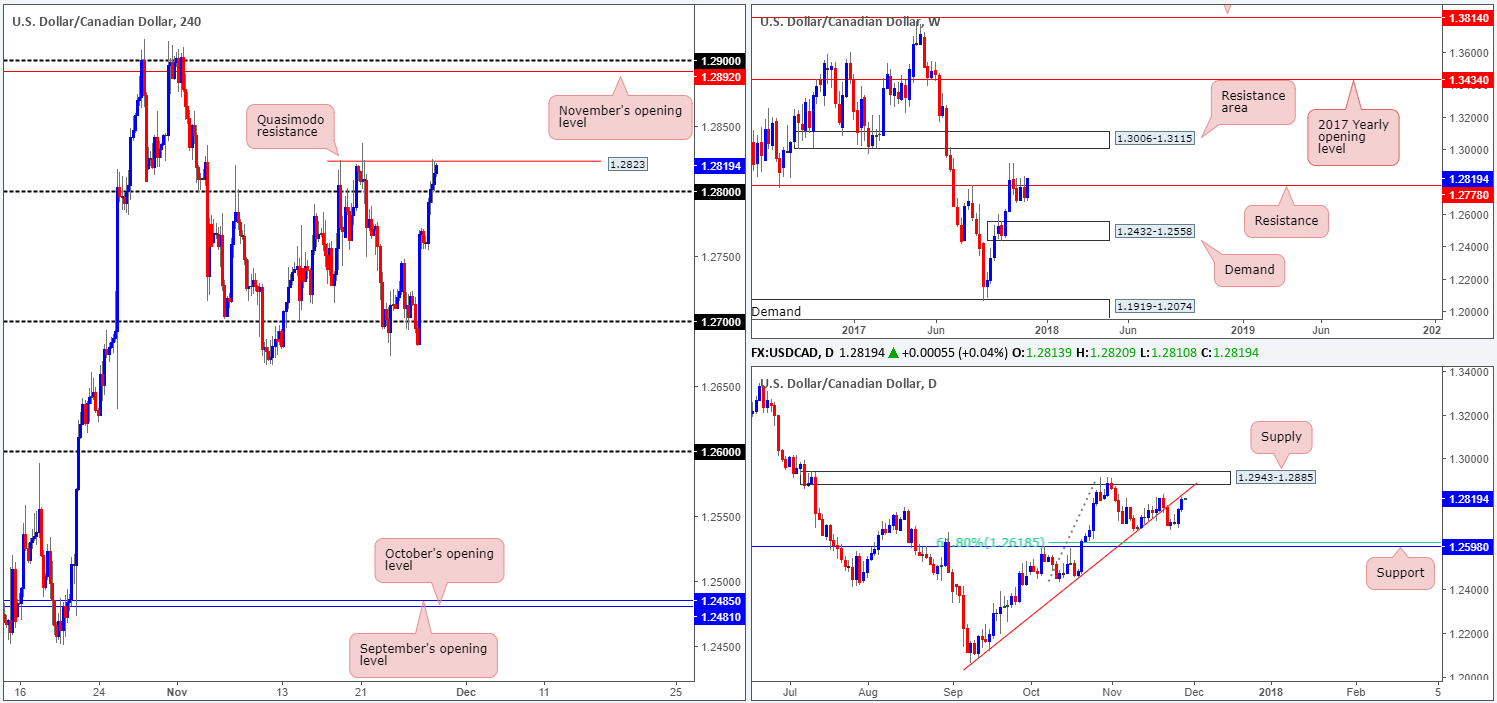
The USD/CAD bulls went on the offensive on Tuesday, eventually breaking through the 1.28 handle and connecting with a H4 Quasimodo resistance planted at 1.2823. The Quasimodo line was highlighted in yesterday’s report as a potential sell zone, but we were looking for H4 price to chalk up a bearish selling wick that pierced through 1.28 and tapped orders around 1.2833 as a way of trade confirmation (a bearish pin bar). As you can see this did not happen, so we passed. 1.2823 responded nicely on the m30 intraday chart, nonetheless, which brought the candles back down to the 1.28 neighborhood.
On the weekly timeframe, it is likely a concerning time for sellers as weekly price recently crossed back above weekly resistance at 1.2778. Turning our attention to the daily timeframe, however, daily price is seen trading within shouting distance of a daily trendline resistance drawn from the low 1.2061. Could this daily line be enough to halt buying above weekly resistance?
Suggestions: A sell at the noted H4 Quasimodo resistance level is considered a risk at the moment. Besides 1.28 being a potential support, one also has to take into account the position of price on the weekly timeframe (see above). A buy at current prices, nevertheless, would be just as risky, in our view. This is largely due to the daily trendline resistance mentioned above, and also we believe that it is far too early to tell if the weekly resistance level is consumed or not.
Data points to consider: US prelim GDP q/q and FOMC member Dudley speech at 1.30pm; Fed Chair Yellen testifies and US pending home sales m/m at 3pm GMT. We also have OPEC meetings all day.
Levels to watch/live orders:
- Buys: Flat (stop loss: N/A).
- Sells: Flat (stop loss: N/A).
USD/CHF:
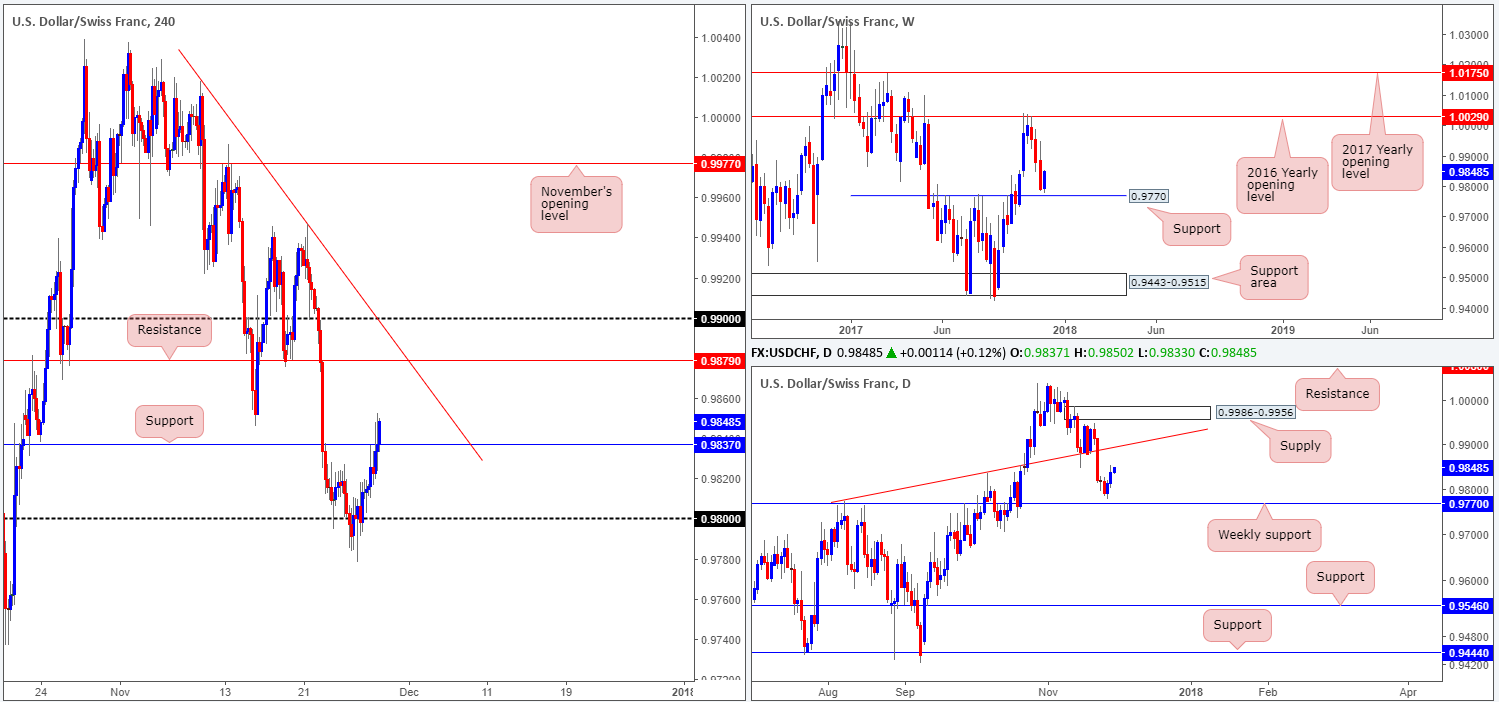
Building on Monday’s recovery, the USD/CHF managed to extend its gains on Tuesday, up 0.23% and reaching a high of 0.9852 on the day. The H4 resistance at 0.9837 eventually gave way, despite an earnest attempt from the sellers to hold things lower amid the London open. A continued push to the upside from here could see the H4 candles shake hands with H4 resistance penciled in at 0.9879, which happens to unite with a H4 trendline resistance taken from the high 1.0017. On the daily timeframe, the next upside target does not come onto the radar until we reach the trendline resistance extended from the high 0.9773.
Suggestions: In the event that H4 price retests 0.9837 as support today, an intraday long opportunity could be an option. Considering that the H4 level boasts little surrounding confluence, other than higher-timeframe direction, the team requires additional confirmation prior to pulling the trigger. Waiting for a lower-timeframe buy signal to form following the retest is advised (for ideas on how to locate such a signal please see the top of this report). Assuming that a trade comes to fruition here, the first take-profit target can be seen around the H4 resistance mentioned above at 0.9879.
Data points to consider: US prelim GDP q/q and FOMC member Dudley speech at 1.30pm; Fed Chair Yellen testifies and US pending home sales m/m at 3pm GMT.
Levels to watch/live orders:
- Buys: 0.9837 region (waiting for a lower-timeframe buy signal to form is advised] stop loss: dependent on where one confirms this level).
- Sells: Flat (stop loss: N/A).
DOW 30:
The DJIA soared to unchartered territory on Tuesday, climbing to highs of 23847. Renewed tax reform hopes boosted US stocks, with the financial sector recording strong gains.
Given the velocity of yesterday’s upside move, there’s little nearby support on the radar to buy this market from. The closest area of support can be seen on the H4 timeframe at 23622-23579, which happens to be positioned directly above a daily support level coming in at 23565.
Suggestions: Unless price reclaims all of Tuesday’s gains and retests the noted H4 support area, there is very little we can do today on the higher timeframes. Should you wish to drill down to the lower timeframes, it is highly likely that you’ll come across something tradable there. However, remain aware that at current price there is absolutely no higher-timeframe confluence!
Data points to consider: US prelim GDP q/q and FOMC member Dudley speech at 1.30pm; Fed Chair Yellen testifies and US pending home sales m/m at 3pm GMT.

Levels to watch/live orders:
- Buys: Flat (stop loss: N/A).
- Sells: Flat (stop loss: N/A).
GOLD:
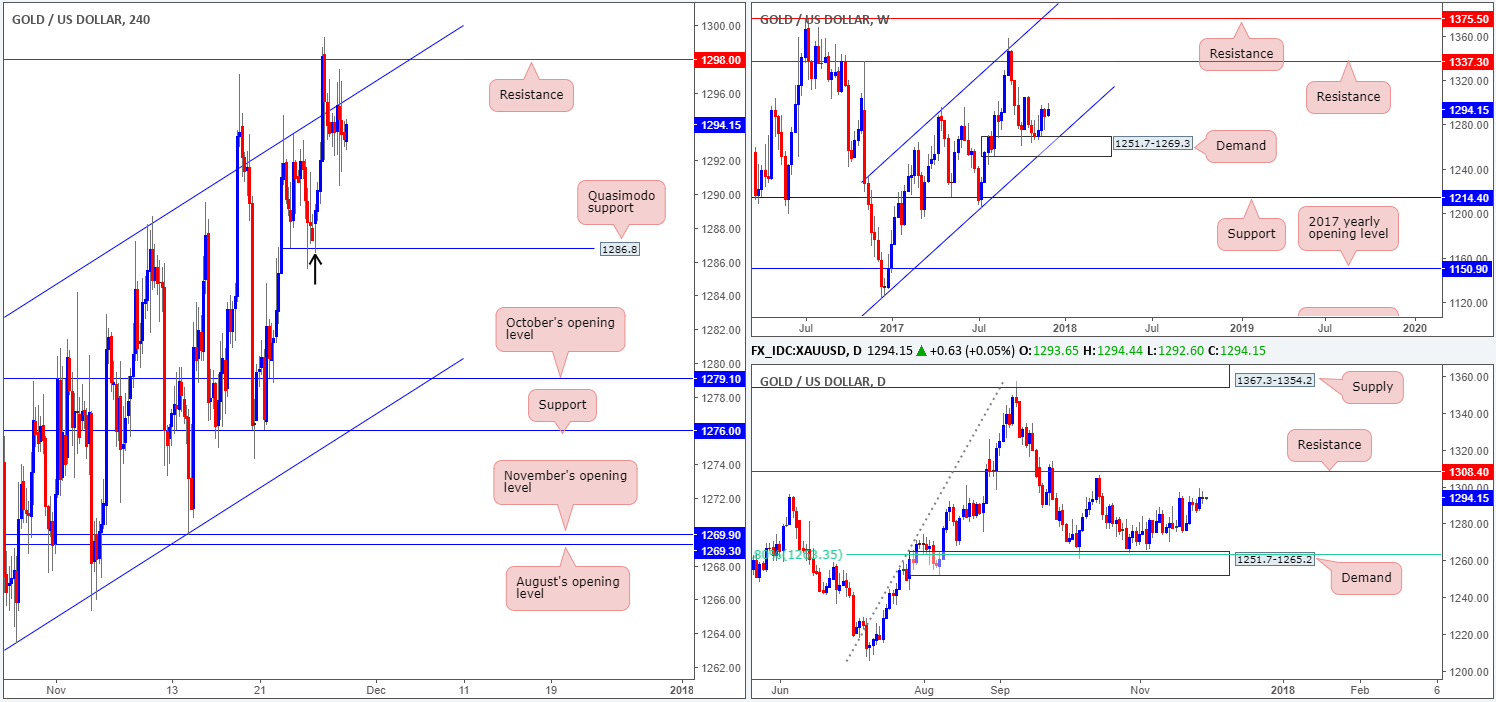
It was a quiet day in the gold market on Tuesday, despite the US dollar climbing to fresh highs. The metal maintained its position below the H4 channel resistance extended from the high 1282.5. A push lower from this angle will likely bring the H4 candles down to a H4 Quasimodo support level pegged at 1286.8. However, we feel that this level may be somewhat fragile due to the H4 candle tail marked with a black arrow at 1286.5. It’s possible that this candle’s tail consumed the majority of unfilled buy orders here before taking off north, and will therefore not be a base we’d consider buying from.
Over on the bigger picture, further upside remains favored. We say this because the unit is seen trading from a weekly demand at 1251.7-1269.3, and shows room to push as far north as daily resistance located at 1308.4. Until the current H4 resistance at 1298.0 is taken out, nevertheless, we would be wary of buying this market.
Suggestions: Unless H4 price crosses above 1298.0 today, we see very little to hang our hat on right now.
Levels to watch/live orders:
- Buys: A H4 close above 1298.0 is considered a bullish signal.
- Sells: Flat (stop loss: N/A).


