
Waiting for lower timeframe confirmation is our main tool to confirm strength within higher timeframe zones, and has really been the key to our trading success. It takes a little time to understand the subtle nuances, however, as each trade is never the same, but once you master the rhythm so to speak, you will be saved from countless unnecessary losing trades. The following is a list of what we look for:
- A break/retest of supply or demand dependent on which way you’re trading.
- A trendline break/retest.
- Buying/selling tails/wicks – essentially we look for a cluster of very obvious spikes off of lower timeframe support and resistance levels within the higher timeframe zone.
We typically search for lower-timeframe confirmation between the M15 and H1 timeframes, since most of our higher-timeframe areas begin with the H4. Stops are usually placed 1-3 pips beyond confirming structures.
EUR/USD:
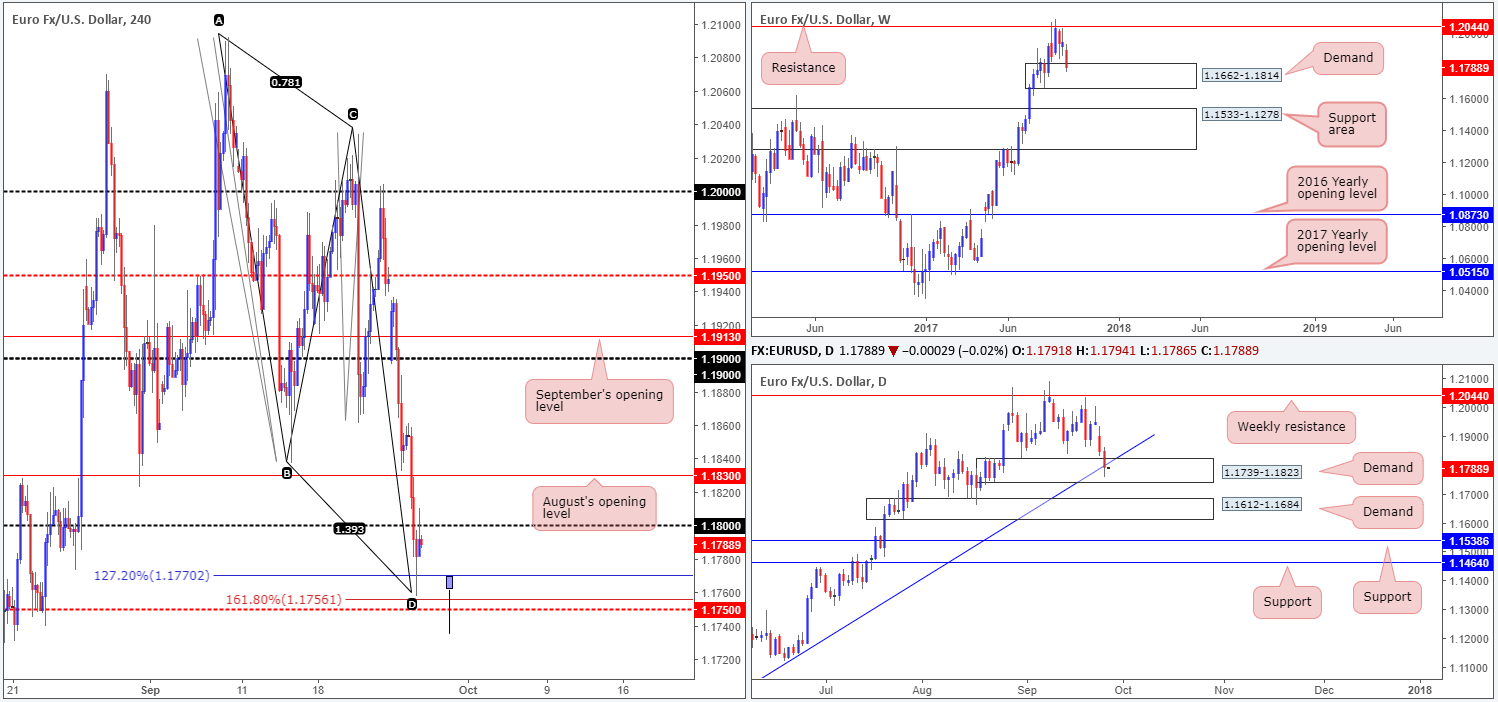
In recent trading, the single currency cruised south for a second consecutive session on Tuesday. Bids at August’s opening level (1.1830) and the 1.18 handle were wiped out, leaving H4 price free to challenge an AB=CD 127.2% ext. point at 1.1770 (taken from the high 1.2092)/161.8% ext. point at 1.1756 extended from the high 1.2034.
Further bolstering the aforementioned Harmonics is a H4 mid-level support at 1.1750, a minor weekly demand planted at 1.1662-1.1814, a daily demand at 1.1739-1.1823 and a trendline support taken from the low.
Suggestions: On account of this, the EUR boasts strong support at the moment which could lead to a rally north this week. H4 bulls have already made an appearance but seem troubled by the nearby 1.18 handle.
Although we are looking to buy this market, we’re wary of pulling the trigger given 1.18 resistance. To combat this, we would like to see price pullback from 1.18, fake below both yesterday’s low at 1.1757 and the 1.1750 line, and close higher (much like our bullish pin-bar drawing). A setup such as this would give us at least one times our risk to the 1.18 hurdle, thus allowing us to reduce risk to breakeven should the bulls fail to breach 1.18.
Data points to consider: US Core durable goods orders at 1.30pm; US New pending home sales at 3pm; FOMC member Brainard speaks at 7pm GMT+1.
Levels to watch/live orders:
- Buys: Watching for H4 price to whipsaw through 1.1750 before a long is considered (stop loss: beneath the candle’s tail).
- Sells: Flat (stop loss: N/A).
GBP/USD:
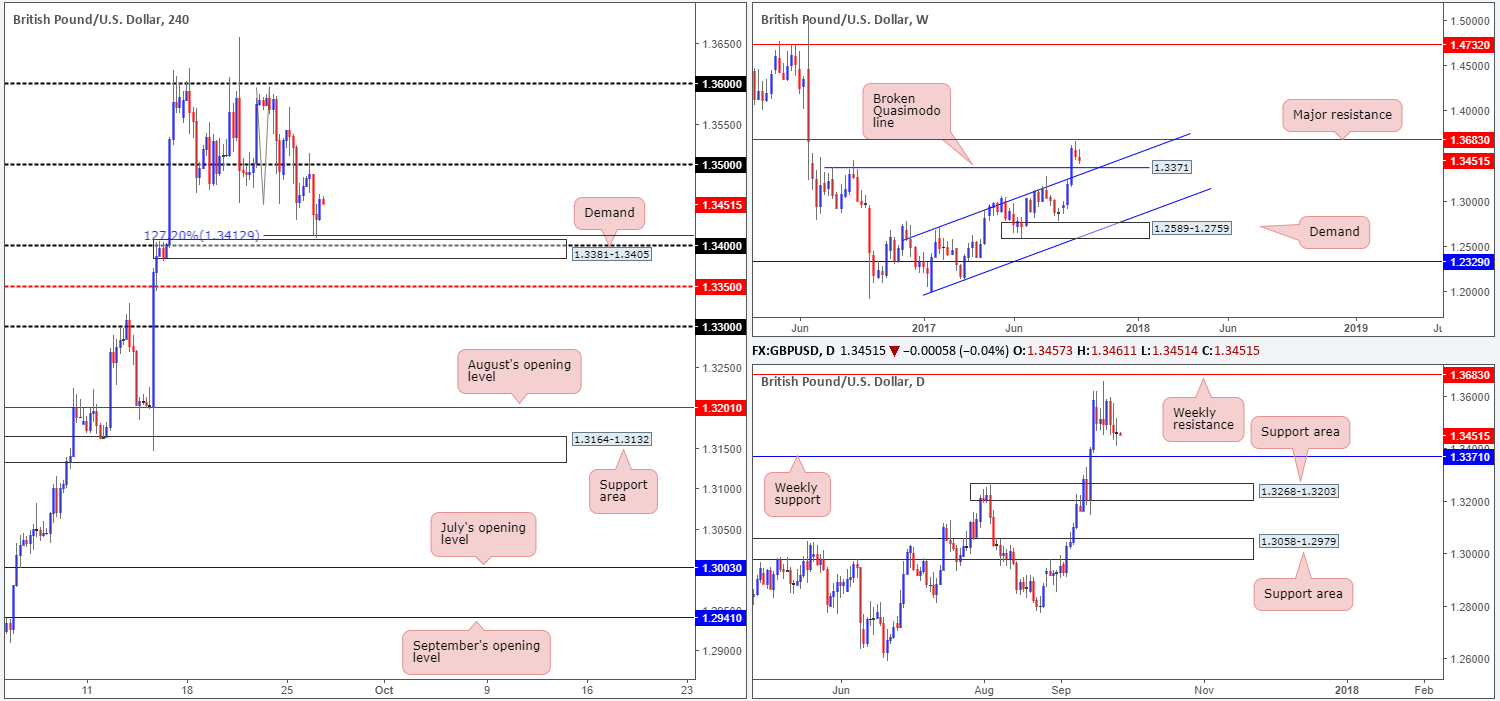
Offers at 1.35 held firm on Tuesday, consequently pushing the H4 candles down to a 127.2% ext. point at 1.3413 (extended from the high 1.3595) that is positioned just ahead of a demand pegged at 1.3381-1.3405/1.34 handle. Although the bulls have registered some interest from 1.3413, there’s still a strong possibility that this move may be a short-lived one, as weekly price looks poised to shake hands with a broken weekly Quasimodo line at 1.3371/channel resistance-turned support extended from the high 1.2706 (seen directly below the H4 demand). As such, if you are currently long from 1.3413, it may be a good idea to begin reducing risk to breakeven since the unit may be heading lower.
Suggestions: Wait for H4 price to fake through the current H4 demand and connect with the aforementioned weekly supports. This, in our opinion, is a high-probability buy since there are highly likely a truckload of stops planted beneath the current H4 demand which is exactly where we’ll be looking to buy!
Data points to consider: US Core durable goods orders at 1.30pm; US New pending home sales at 3pm; FOMC member Brainard speaks at 7pm GMT+1.
Levels to watch/live orders:
- Buys: Watching for H4 price to whipsaw through 1.3381-1.3405 to tap 1.3371 weekly support before a long is considered (stop loss: beneath the candle’s tail).
- Sells: Flat (stop loss: N/A).
AUD/USD:
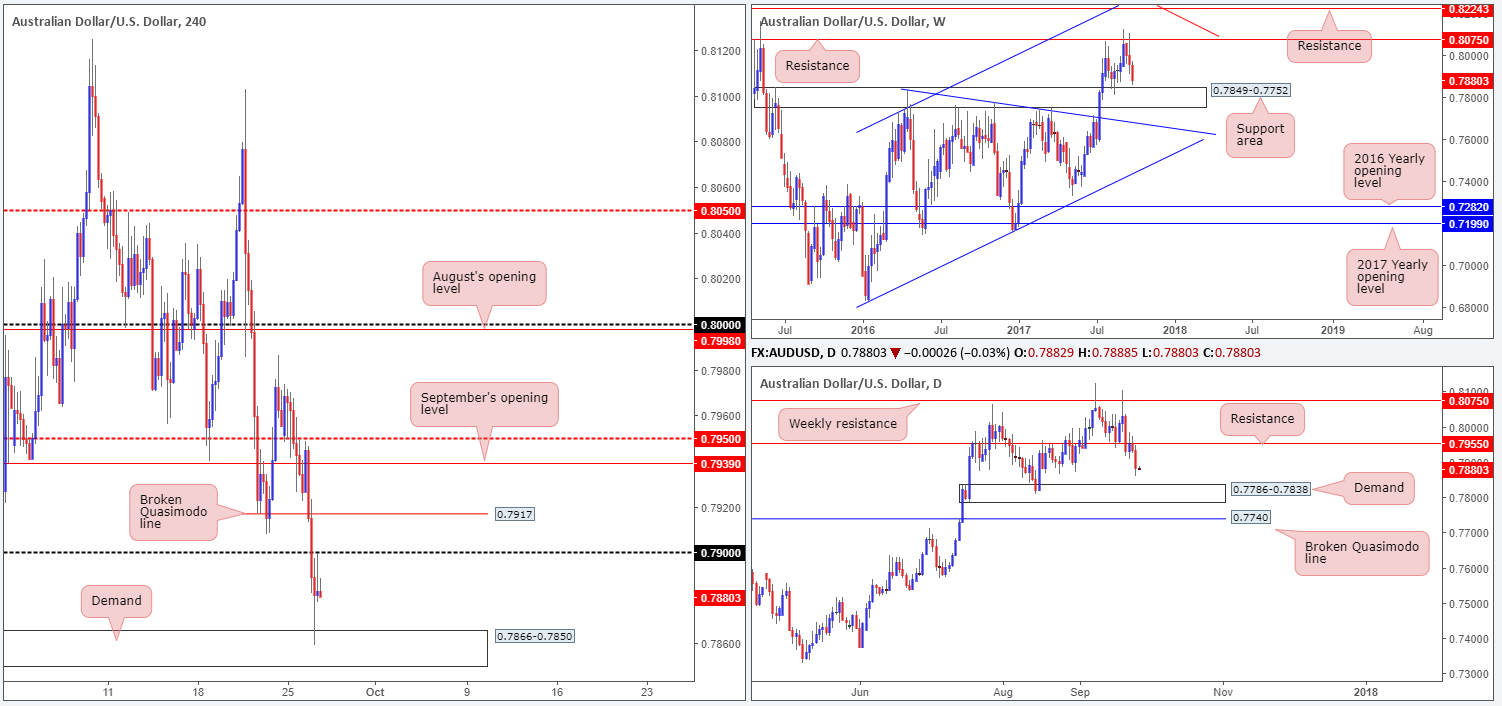
Kicking this morning’s report off with a look at the weekly timeframe, we can clearly see that price is now within shouting distance of connecting with a support area marked at 0.7849-0.7752. Meanwhile, daily action shows the recently engulfed support at 0.7955 is holding ground as resistance. Provided that the bears continue to defend this line, daily demand at 0.7786-0.7838 is likely going to be the next port of call on this scale (seen plotted within the walls of the noted weekly support area).The story on the H4 timeframe, nevertheless, shows price responded beautifully to H4 demand pegged at 0.7866-0.7850 on Tuesday, but has failed to sustain this momentum beyond the nearby 0.79 handle.
Suggestions: Considering that both weekly and daily price show room to decline further, our team has absolutely no interest in buying from current price or the H4 demand base. The H4 Quasimodo support seen plotted below the current demand at 0.7839, however, is of interest (not seen on the screen). Not only does 0.7839 align nicely with the top edge of daily demand at 0.7838 and nearby the top edge of the weekly support area at 0.7849, we also have the benefit of all the juicy stop-loss orders planted below the current H4 demand. Remember, when a buyer’s stop is triggered it becomes a sell order, which is ideal liquidity to buy!
Given the above, we have set a pending buy order at 0.7839, with a stop placed below the apex of the Quasimodo formation (0.7807) at 0.7805. This equates to a 34-pip stop. As the first take-profit target does not come into view until 0.79, this allows the trader to nearly double his/her initial risk!
Data points to consider: US Core durable goods orders at 1.30pm; US New pending home sales at 3pm; FOMC member Brainard speaks at 7pm GMT+1.
Levels to watch/live orders:
- Buys: 0.7839 (stop loss: 0.7805).
- Sells: Flat (stop loss: N/A).
USD/JPY:
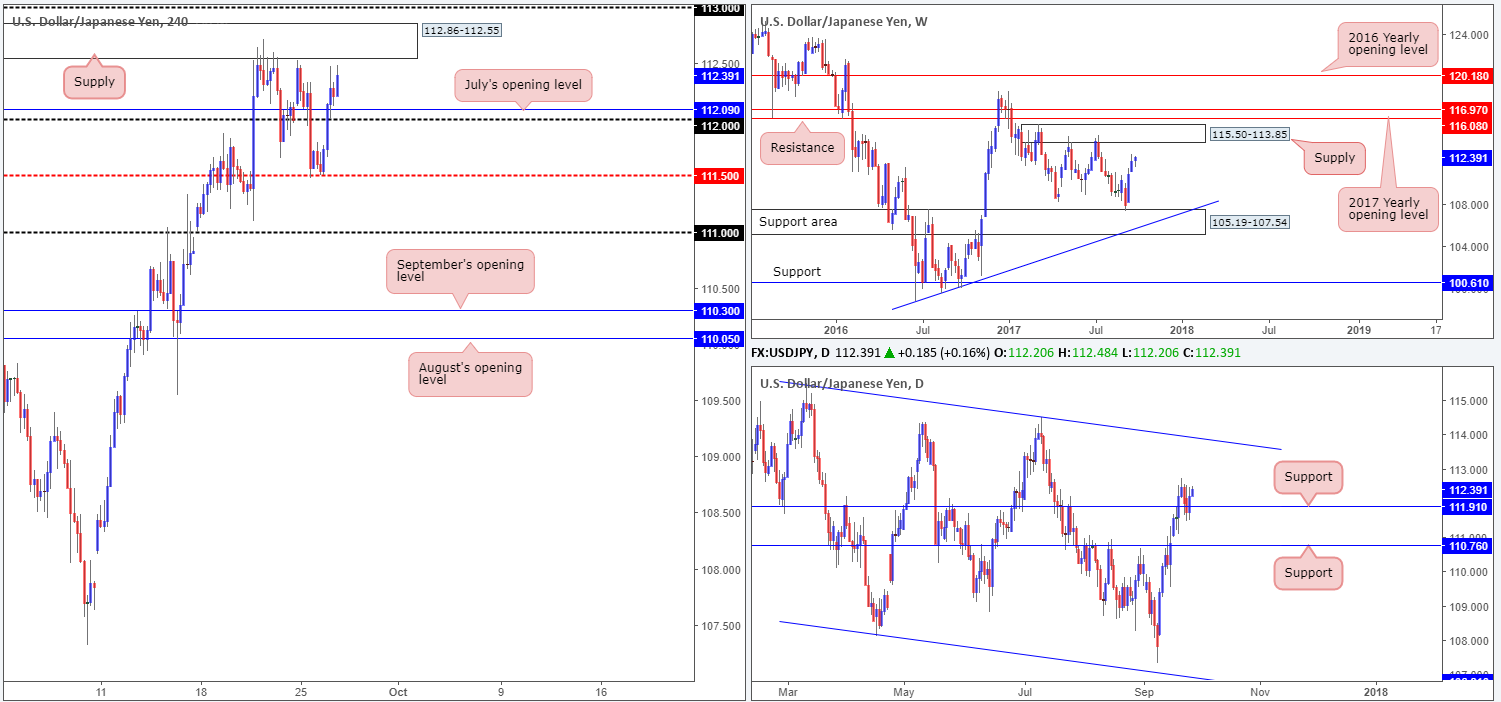
Higher-timeframe direction currently shows weekly price heading for a supply zone coming in at 115.50-113.85. In conjunction with weekly flow, daily action is also seen holding ground at support drawn from 111.91. Should price continue to push higher from here, the next upside target is seen at a channel resistance extended from the high 115.50, which happens to intersect with the noted weekly supply.
Across on the H4 timeframe, price recently climbed above the 112 handle/nearby July’s opening level at 112.09, and now looks poised to challenge supply at 112.86-112.55. According to H4 structure, entering long is a tricky beast right now. Not only is there the current H4 supply to contend with, there’s also the 113 handle plotted just above this area and another nearby supply seen at 113.57-113.38.
Suggestions: In light of nearby H4 resistances, our team has no interest in buying this market today, despite what the higher-timeframe charts suggest.
Data points to consider: US Core durable goods orders at 1.30pm; US New pending home sales at 3pm; FOMC member Brainard speaks at 7pm GMT+1.
Levels to watch/live orders:
- Buys: Flat (stop loss: N/A).
- Sells: Flat (stop loss: N/A).
USD/CAD:
During the course of Tuesday’s sessions, H4 price drove higher into supply at 1.2415-1.2379 and filled offers at 1.24. As can be seen on the chart, the pair was unable to sustain gains beyond 1.24 and ended the day pushing down to the mid-level support 1.2350. As we mentioned in yesterday’s report, both of these H4 barriers are sited within a daily resistance area pegged at 1.2303-1.2423. What we also mentioned, however, is that weekly price shows room to extend above the daily area to a long-term weekly trendline resistance extended from the low 0.9633.
Suggestions: Given the threat of further upside on the weekly scale, the team remains reluctant to sell at current prices. An area we would be interested in selling, nonetheless, is the H4 supply seen at 1.2491-1.2461. Not only is it surrounded by both September/August’s opening levels at 1.2497/1.2481 and the 1.25 handle, it also intersects nicely with the noted weekly trendline resistance.
As H4 price could potentially fake above 1.2491-1.2461 to attack offers at 1.25, we would advise waiting for a reasonably sized H4 bear candle to take shape from here (preferably a full, or near-full-bodied candle), before pulling the trigger.
Data points to consider: US Core durable goods orders at 1.30pm; US New pending home sales at 3pm; FOMC member Brainard speaks at 7pm GMT+1.

Levels to watch/live orders:
- Buys: Flat (stop loss: N/A).
- Sells: 1.2491-1.2461 area ([waiting for a reasonably sized H4 bearish candle to form – preferably a full, or near-full-bodied candle – is advised] stop loss: ideally beyond the candle’s wick).
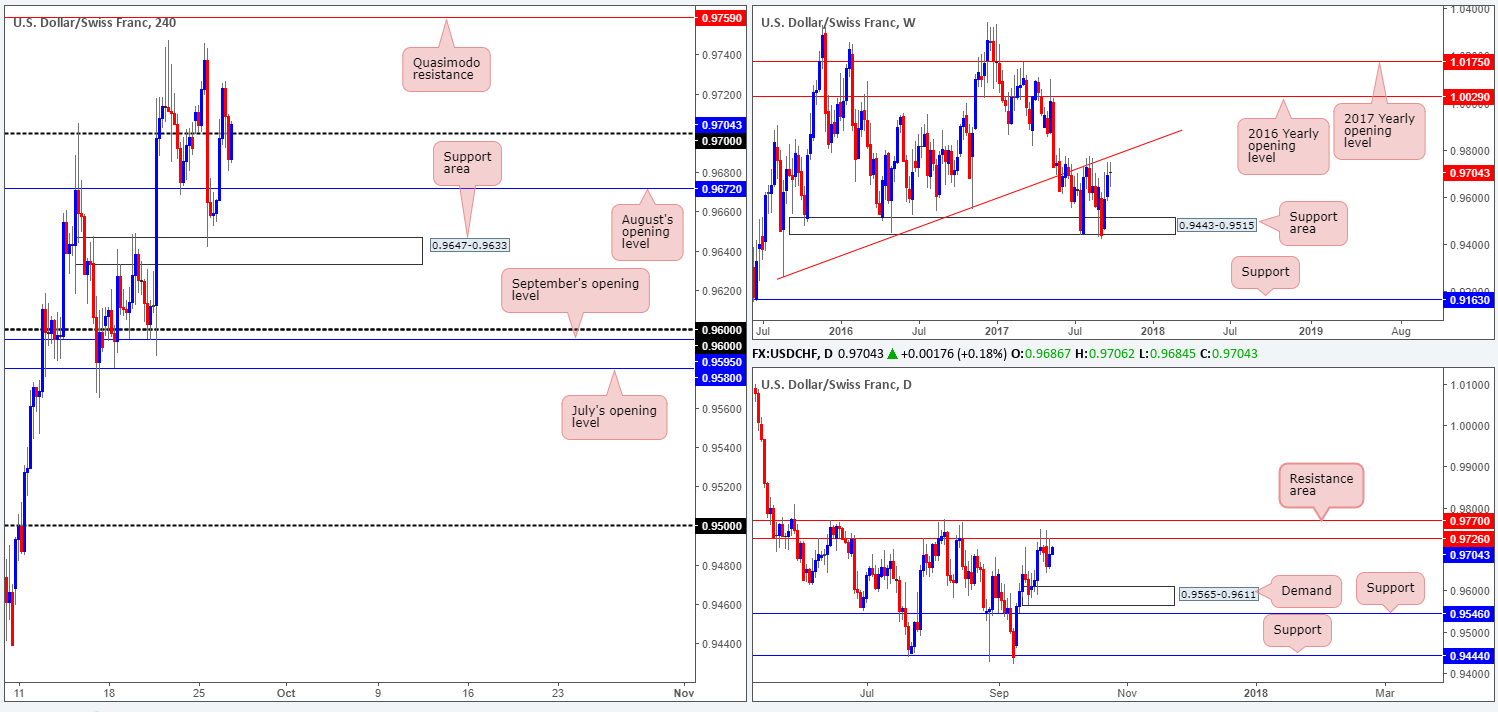
USD/CHF:
The bounce from the H4 support area at 0.9647-0.9633 forced H4 price above both August’s opening level at 0.9672 and the 0.97 handle. This has, as far as we can see, potentially opened up the path north to a H4 Quasimodo resistance level pegged at 0.9759.
Scanning the weekly timeframe, however, shows that the unit is seen closing in on the trendline resistance extended from the low 0.9257. Alongside this, we can also see that daily price is currently trading from a resistance area pegged at 0.9770/0.9726 and shows room to decline down to at least demand located at 0.9565-0.9611.
Suggestions: Instead of trying to long the market above 0.97 when the unit is trading nearby weekly/daily structures, you could simply wait and see if price challenges the noted H4 Quasimodo resistance and look to sell. Positioned within the upper limits of the noted daily resistance area and intersecting with a weekly trendline resistance, this H4 level is, in our opinion, enough to warrant a sell without the need for additional confirmation.
Data points to consider: US Core durable goods orders at 1.30pm; US New pending home sales at 3pm; FOMC member Brainard speaks at 7pm GMT+1.
Levels to watch/live orders:
- Buys: Flat (stop loss: N/A).
- Sells: 0.9759 area (stop loss: 0.9776).
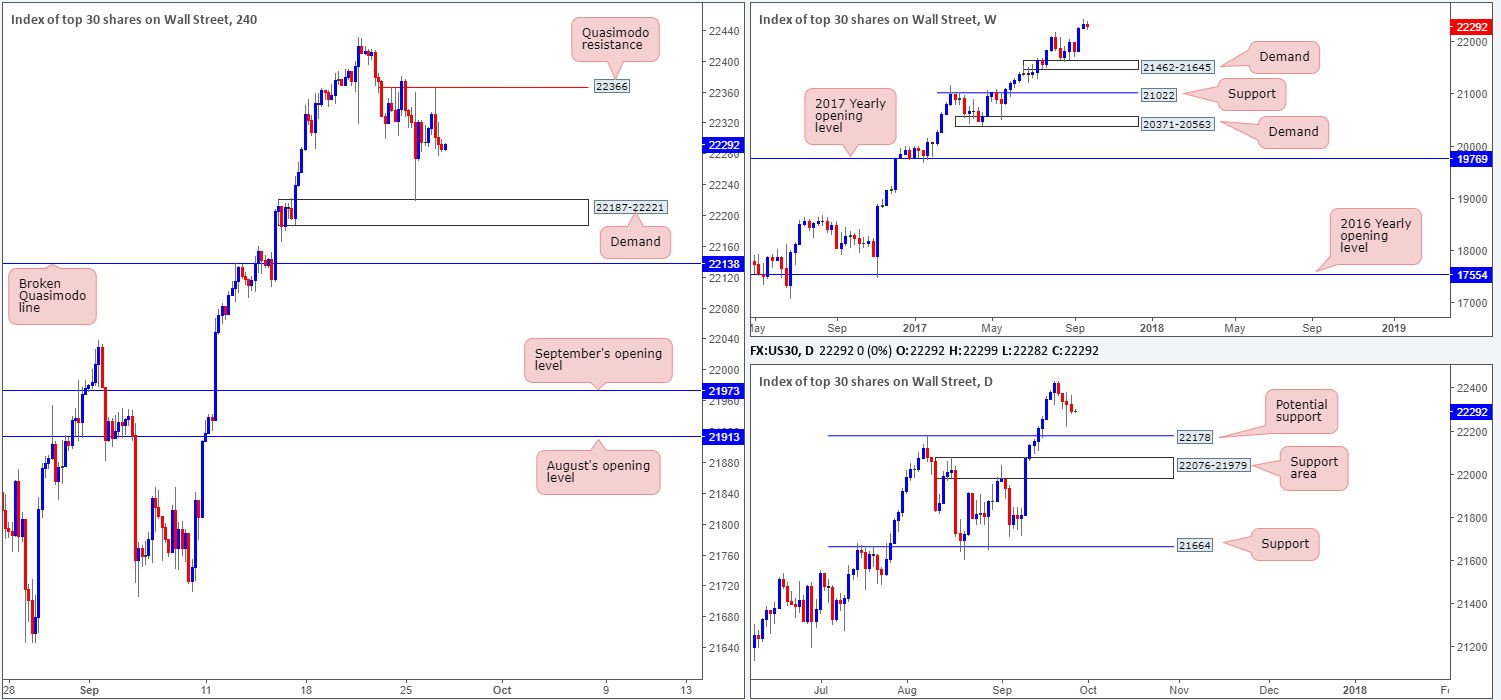
DOW 30:
US equities printed a fourth consecutive bearish close on Tuesday, down from a record high of 22431. According to daily structure, the unit could continue pushing lower until we reach potential support marked at 22178. Up on the weekly timeframe, nevertheless, we can see that price could possibly pullback as far as the demand area at 21462-21645.
As can be seen on the H4 chart this morning, intraday movement came within a few points of tapping the minor Quasimodo resistance level at 22366, before collapsing lower. Assuming that the bears remain in the driving seat for a fifth consecutive session, this could lead to the H4 candles retesting demand seen at 22187-22221, or even the broken Quasimodo line seen just below it at 22138.
Suggestions: The key thing to remember here is this market remains entrenched within a strong uptrend, and is trading from record highs as we write. Therefore, a decisive H4 push above the aforesaid H4 Quasimodo resistance would, in our opinion, be a strong indication that the bulls are ready to press to fresh record highs. And this is something we want to be a part of! Therefore, what we’re looking for is a H4 close beyond 22366, followed by a retest and a reasonably strong H4 bull candle in the shape of a full, or near-full-bodied candle.
Data points to consider: US Core durable goods orders at 1.30pm; US New pending home sales at 3pm; FOMC member Brainard speaks at 7pm GMT+1.
Levels to watch/live orders:
- Buys: Watch for H4 price to close beyond 22366 and then look to trade any retest seen thereafter ([waiting for a H4 bullish rotation candle to form following the retest is advised] stop loss: ideally beyond the candle’s tail).
- Sells: Flat (stop loss: N/A).
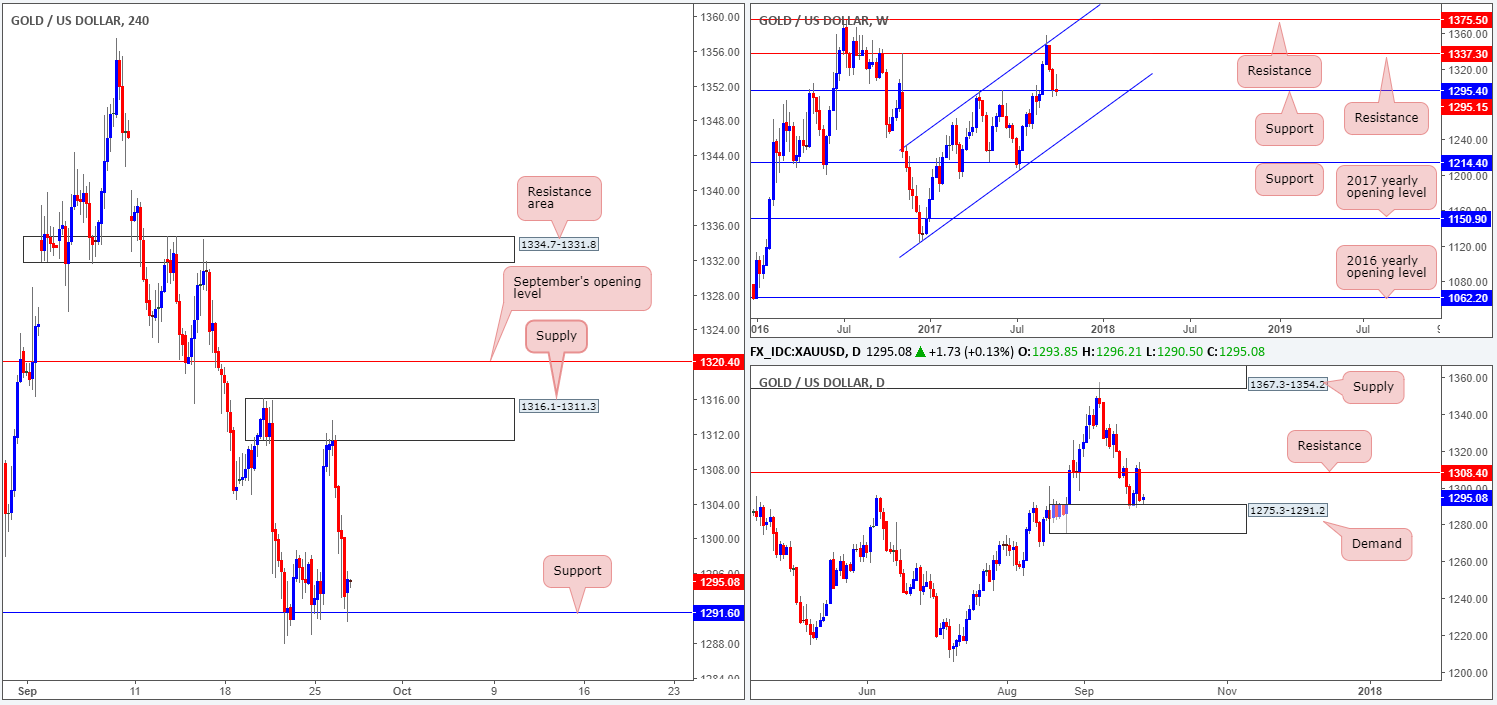
GOLD:
Across the board, the US dollar rallied higher on Tuesday, thereby forcing the price of gold lower from H4 supply coming in at 1316.1-1311.3. Yesterday’s aggressive selloff, as you can see, brought the yellow metal down to a H4 support at 1291.6, which also denotes the top edge of a daily demand area penciled in at 1275.3-1291.2. Also noteworthy is weekly price remains trading around support drawn from 1295.4.
With the USDX H4 candles now trading from resistance at 11907, and daily price closing in on supply at 11969-11938, we believe that there’s a firm chance gold could rotate from the current H4 support/daily demand area today.
Suggestions: One could, given the above notes, look for long opportunities at the current H4 support. In the event that price remains bid from here, we would be looking to trail the position back up to the daily resistance at 1308.4, followed closely by the aforementioned H4 supply and September’s opening level at 1320.4.
Levels to watch/live orders:
- Buys: Possible long opportunities from H4 support at 1291.6 (stop loss: ideally below 21/09 low 1287.8).
- Sells: Flat (stop loss: N/A).


