
Key risk events today:
US Core Durable Goods Orders m/m; US Durable Goods Orders m/m; US Prelim GDP q/q; Chicago PMI; US Core PCE Price Index m/m and Personal Spending m/m; Crude Oil Inventories.
EUR/USD:
(Italics – previous analysis).
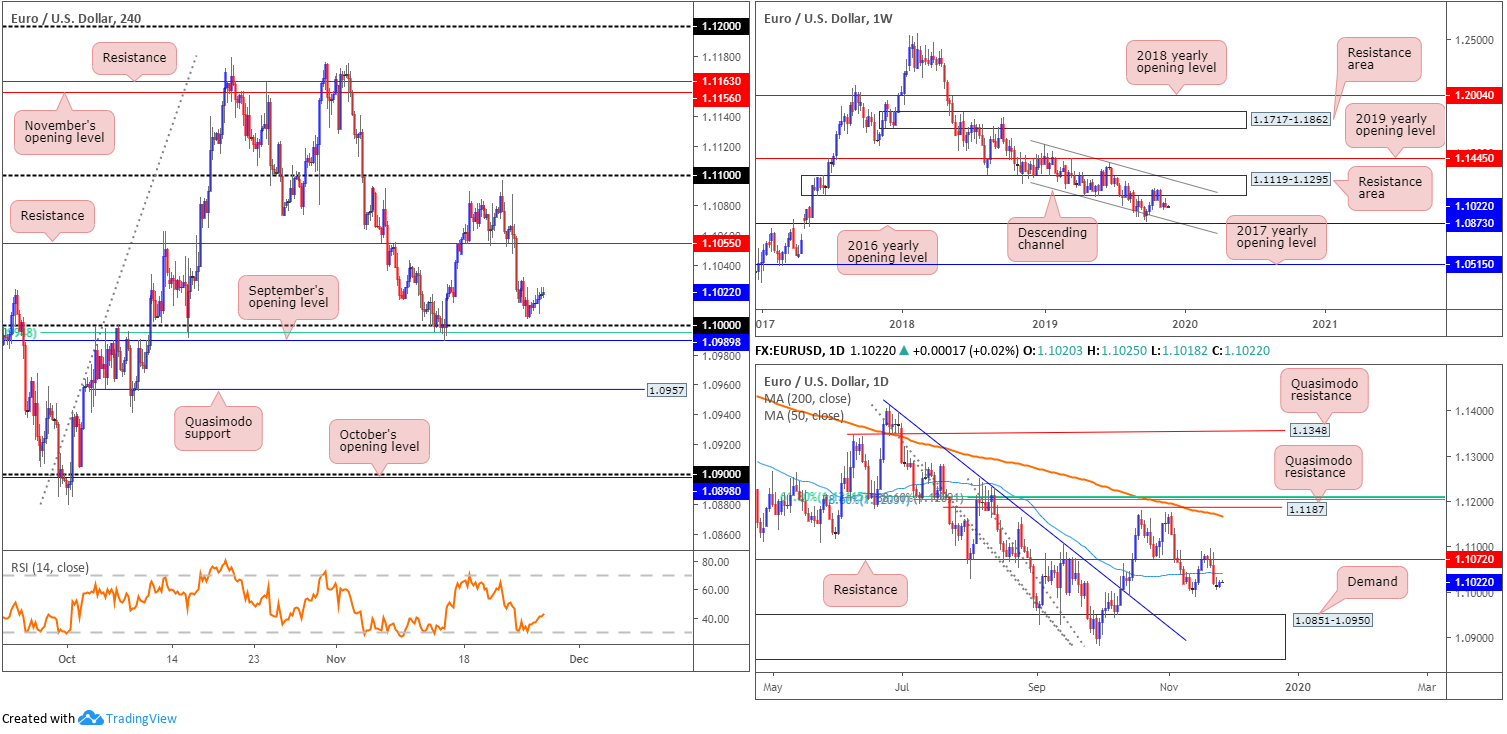
Leaving the key figure 1.10 unopposed, EUR/USD movement turned sluggishly higher Tuesday, aided by weaker-than-anticipated US consumer confidence data. According to The Conference Board, the Consumer Confidence Index decreased in November, following a slight decline in October. The Index now stands at 125.5 (1985=100), down from 126.1 in October.
Although the recent upturn snapped a four-day bearish phase, the move appears to lack technical substance: limited support. H4 flow has support stationed nearby between September’s opening level at 1.0989, a 61.8% Fibonacci retracement at 1.0994 and the 1.10 key figure. The next noticeable resistance hurdle here falls in around the 1.1055 neighbourhood, while south of 1.10, Quasimodo support at 1.0957 lies in wait.
Longer-term action retains a bearish tone, languishing south of a long-standing weekly resistance area at 1.1119-1.1295. Further selling has the lower boundary of a weekly descending channel to target (extended from the low 1.1109), merging closely with the 2016 yearly opening level at 1.0873. Concerning trend direction, the primary downtrend has been in motion since topping in early 2018 at 1.2555.
A closer reading of price action on the daily timeframe shows price remains south of its 50-day SMA value (blue – 1.1040). The 1.0989 November 14 low is seen as potential support, followed by daily demand at 1.0851-1.0950. Note the said demand base holds the 2016 yearly opening level at 1.0873 within its lower boundary.
Areas of consideration:
Despite yesterday’s advance, traders still likely have their crosshairs fixed on 1.0989/1.10 as a possible buy zone. However, whipsaws are common viewing around psychological levels; waiting for additional candlestick confirmation to form before pulling the trigger is, therefore, an idea worth considering (entry/risk can be defined according to the selected candlestick pattern).
A decisive close beneath 1.0989 opens the door to an intraday bearish theme, targeting H4 Quasimodo support at 1.0957 as the initial downside take-profit area. Keep in mind, though, weekly price suggests the 2016 yearly opening level at 1.0873 could eventually make an appearance, so keeping a portion of the position open is certainly an idea.
GBP/USD:
(Italics – previous analysis).
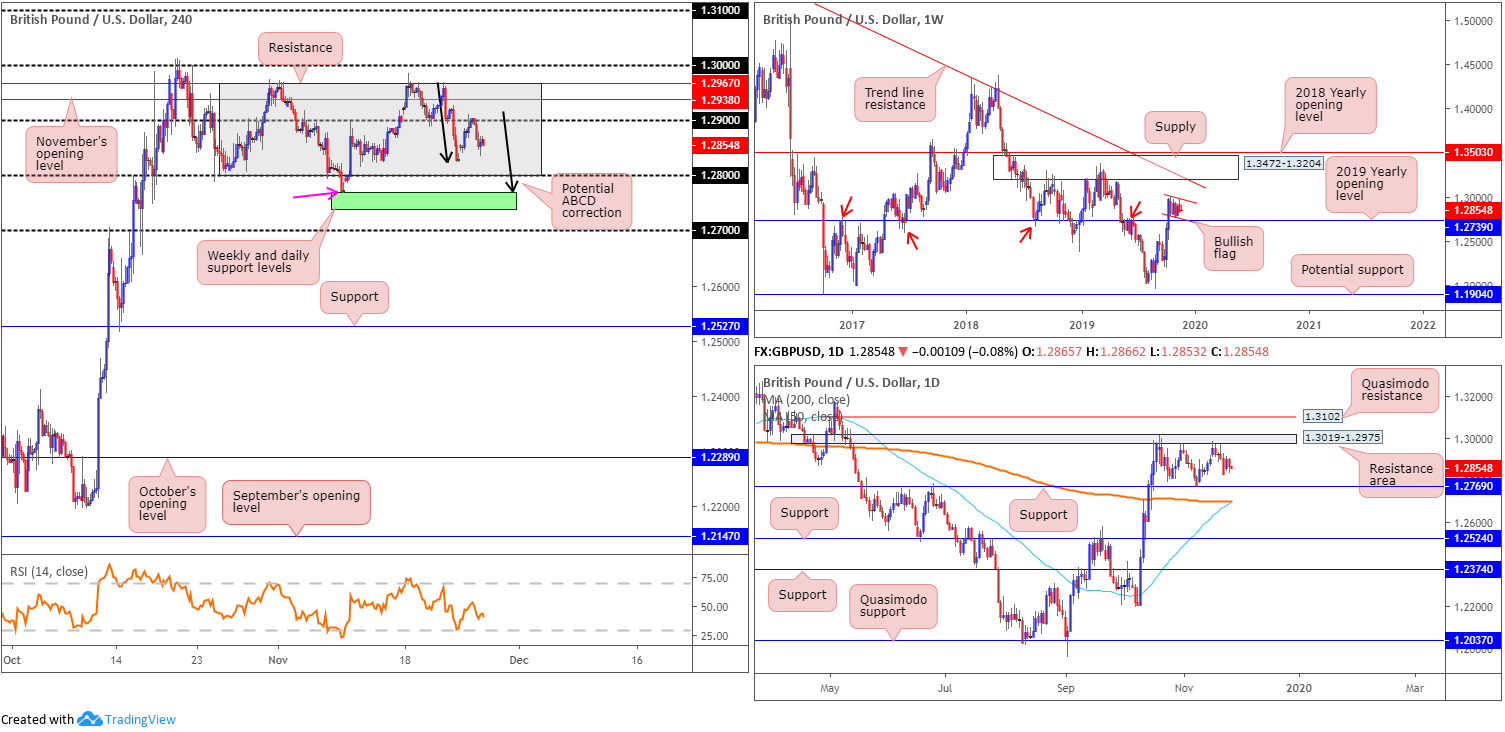
Sterling eased Tuesday as UK polls narrow. GBP/USD failed to sustain gains beyond the 1.29 handle in recent trade, dipping to lows of 1.2834 and reclaiming much of Monday’s upside.
From a technical standpoint, the H4 candles continue to trade rangebound between resistance at 1.2967 and the 1.28 handle (grey). Within the range falls the 1.29 handle and November’s opening level at 1.2938. Outside of the consolidation, traders may want to acknowledge the key figure 1.30, and an interesting area of support in green comprised of weekly support (2019 yearly opening level) and daily support at 1.2739 and 1.2769, respectively. Traders may also want to acknowledge a potential H4 ABCD (black arrows) bullish formation that completes at the aforementioned higher-timeframe supports.
Structurally, the view on the weekly timeframe remains optimistic, exhibiting scope to extend north until crossing swords with supply at 1.3472-1.3204 and long-term trend line resistance etched from the high 1.5930. What’s also notable is the bullish flag (typically considered a continuation pattern) forming just north of the 2019 yearly opening level 1.2739. Regarding the immediate trend, the market faces a downward trajectory from 1.4376, with a break of the 1.1904 low (labelled potential support) confirming the larger downtrend from 1.7191.
Since mid-October, candle action on the daily timeframe has been carving out a consolidation between a resistance area plotted at 1.3019-1.2975 and a well-placed support level at 1.2769. Beyond this range, Quasimodo resistance lies at 1.3102, whereas south of 1.2769, the 200-day SMA (orange – 1.2699) and 50-day SMA (blue – 1.2696) offer support and are, at the time of writing, seen closing in on each other for a possible cross higher (sometimes referred to as a ‘Golden Cross’).
Areas of consideration:
Currently, the technical landscape symbolises an uncertain market, with all three highlighted timeframes emphasising a ranging motion.
The 1.30 handle based on the H4 timeframe is likely of interest to sellers, knowing a violation of the upper H4 range limit at 1.2967 potentially trips a number of buy stops to sell into. However, judging by recent price action, this level is unlikely to enter the fight this week.
In addition, the weekly and daily support levels at 1.2739 and 1.2769 (green) placed on the H4 scale are also likely of interest, which forms part of a ‘bear trap’ beyond the lower H4 range limit, 1.28. Notice this scenario worked favourably at the beginning of November (pink arrow).
AUD/USD:
(Italics – previous analysis).
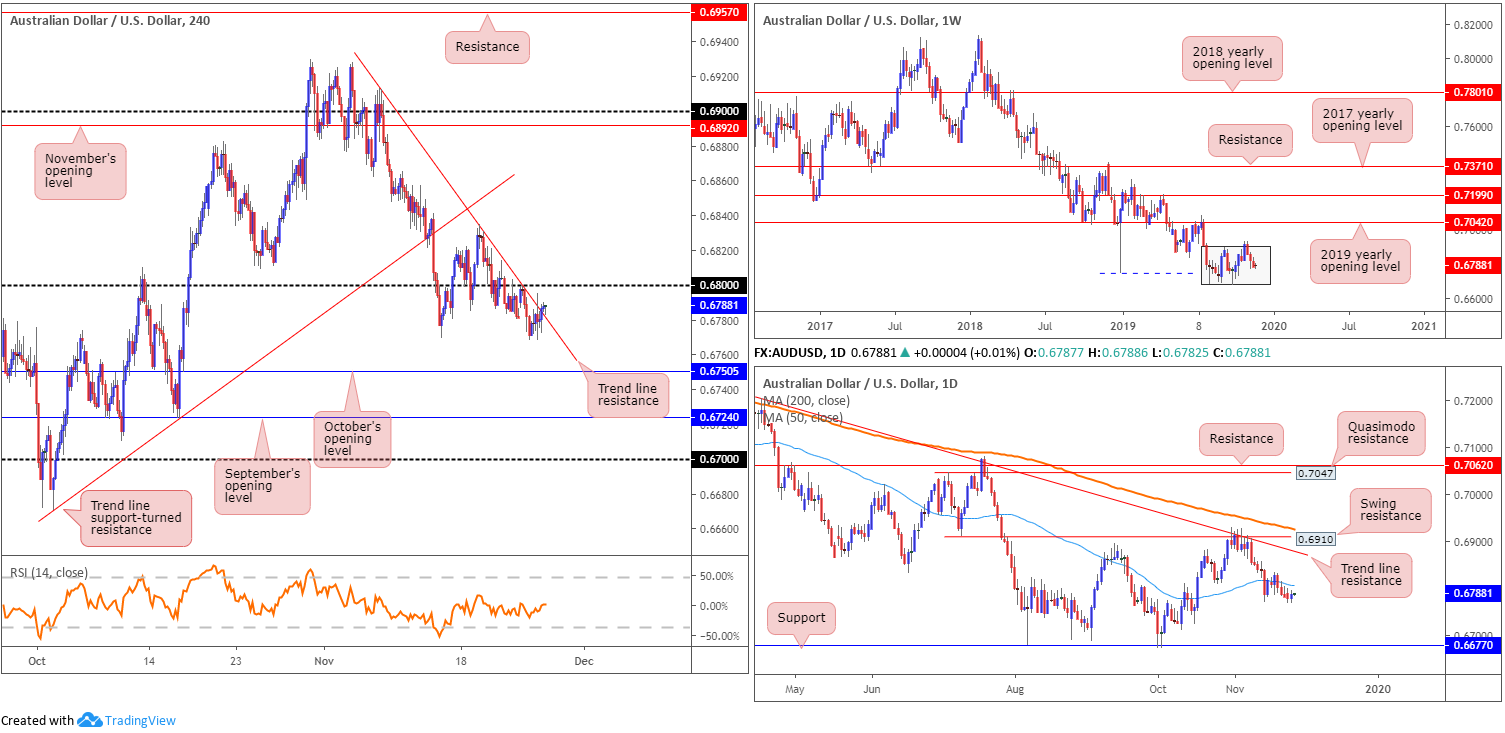
Chart studies reveal the Australian dollar was bid higher against the buck Tuesday, consequently snapping a four-day losing streak. Earlier in the day, AUD/USD spiked to highs of 0.6795 following comments from Reserve Bank of Australia Governor Lowe regarding monetary policy – Lowe pushed back on QE and unconventional monetary policy measures.
Technical research on the H4 timeframe witnessed a breach of trend line resistance extended from the high 0.6913, highlighting the likelihood of a retest at 0.68 playing out today. October’s opening level at 0.6750 still represents the next downside target on the H4 timeframe, closely shadowed by September’s opening level at 0.6724 and then the 0.67 handle.
With respect to higher-timeframe action, limited change is seen. Weekly price remains trading mid-range between 0.6894/0.6677 (light grey). With a primary downtrend in play since early 2018, breaking through the lower edge of the said range is likely, with the next support target not visible until around 0.6359.
In terms of the daily timeframe, price continues to explore ground beneath the 50-day SMA (blue – 0.6805). Although support may develop around the 0.6728ish region, traders likely have their crosshairs fixed on support pencilled in from 0.6677.
Areas of consideration:
A retest at 0.68 is a likely scenario today, which, technically speaking, should hold for at least a bounce, given its connection with the 50-day SMA based on the daily timeframe (0.6805). A H4 bearish candlestick formation printed from 0.68 could, therefore, be something sellers consider. Waiting for additional candlestick confirmation not only helps confirm seller intent, it also provides entry and risk levels to work with.
USD/JPY:
(Italics – previous analysis).
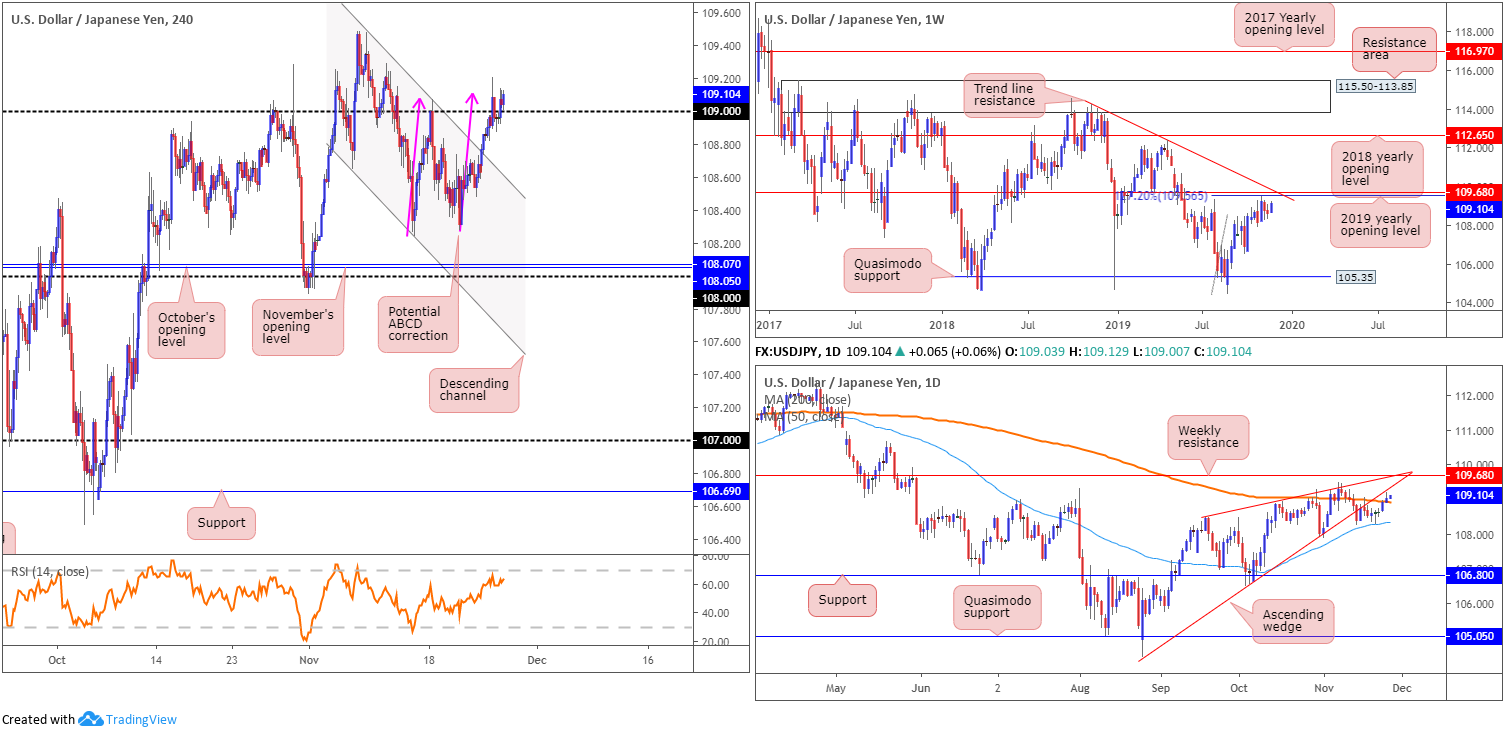
USD/JPY remained resilient despite less-than-stellar US consumer confidence data. Buyers and sellers continue to square off just north of the 109 handle, with buyers, according to H4 movement, appearing the victor, as of writing. Holding above 109 will naturally draw in additional buyers, though the H4 ABCD formation (pink arrows – 109.11) as well as higher-timeframe resistances could pose a problem.
Technical research based on the weekly timeframe has resistance close by in the form of the 2019 yearly opening level at 109.68 and a 127.2% Fibonacci ext. point at 109.56 (taken from the low 104.44). Also sited nearby is trend line resistance extended from the high 114.23. In regards to the market’s primary trend, the pair has been entrenched within a range since March 2017, spanning 115.50/105.35.
Price edged a touch above the 200-day SMA (orange – 108.92) on the daily timeframe yesterday, though the unit remains trading just south of the lower edge of a recently broken ascending wedge formation (104.44).
Areas of consideration:
Should H4 buyers manage to withstand the selling pressure derived from the noted H4 ABCD bearish pattern, a move higher might be on the cards. However, it is unlikely to be enough to get excited about, with an upside limit likely stationed nearby weekly resistance mentioned above at 109.68. That is, of course, if daily buyers overcome the underside of the current wedge.
A DECISIVE H4 close south of 109, on the other hand, serves as an initial cue to weakness in this market. A daily close below the said 200-day SMA would further confirm the bearish theme and open the possibility of selling, targeting the top edge of the H4 descending channel (109.47)/the 50-day SMA (blue – 108.33).
USD/CAD:
(Italics – previous analysis).
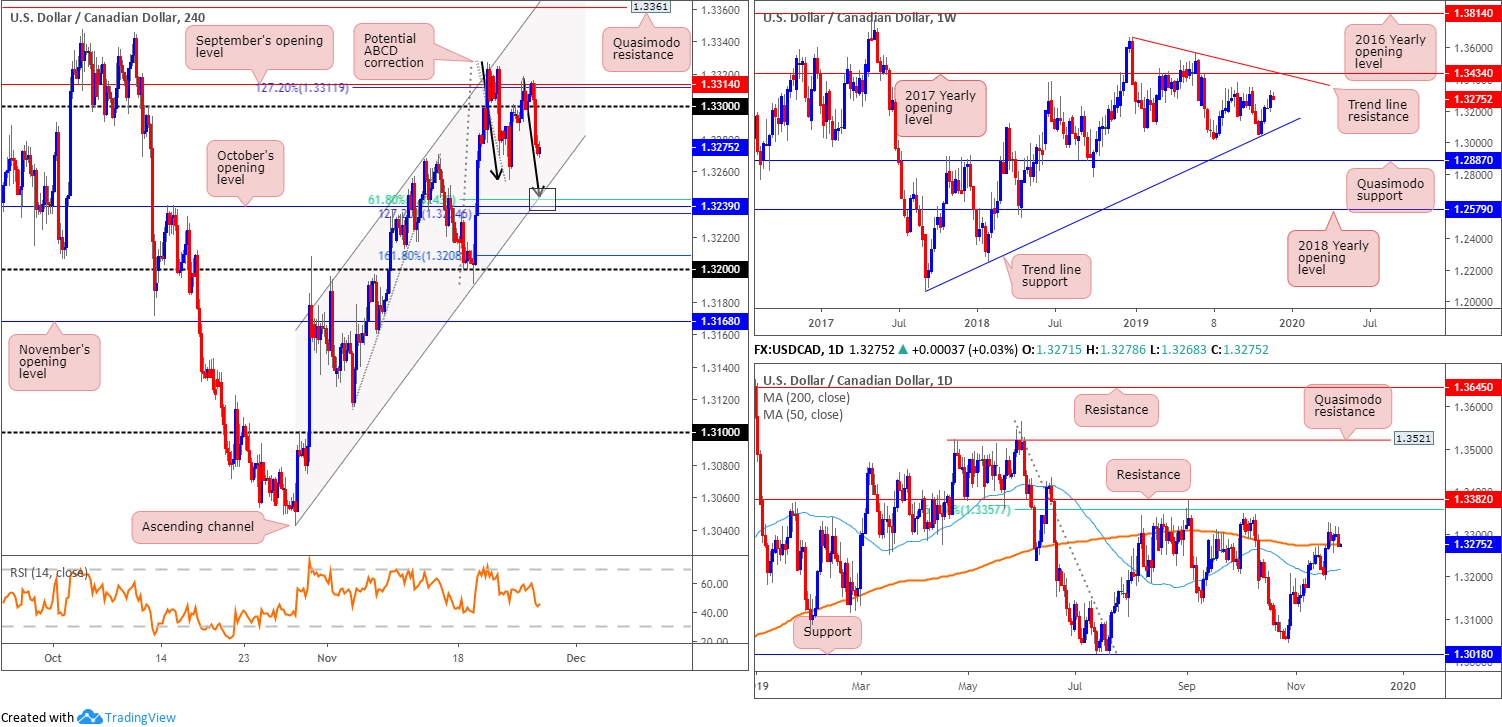
After a brief spell above the 1.33 handle, H4 activity dipped lower amid a modest recovery in crude oil prices. Channel support extended from the low 1.3042 is viewed as the next base of support, followed closely by October’s opening level at 1.3239. In the event the market continues to reflect a bearish tone today, an ABCD formation may take shape, which, as you can see, converges with the said channel support, a 61.8% Fibonacci support at 1.3243 and October’s opening level.
Interestingly, daily action crossed marginally beneath its 200-day SMA (orange – 1.3276) yesterday, opening the possibility of a run towards the 50-day SMA (blue – 1.3216).
With respect to the weekly timeframe, price chalked up a healthy bullish candle last week. Adding more than 75 points, the unit has tops around 1.3342 in sight, closely followed by the 2017 yearly opening level at 1.3434 and trend line resistance taken from the peak at 1.3661. Overall, the immediate trend faces north since bottoming in September 2017, though this move could also be considered a deep pullback in a larger downtrend from the 1.4689 peak in early January 2016.
Areas of consideration:
The H4 channel support, along with its aligning ABCD function, the 61.8% Fibonacci level and October’s opening level, boasts a reasonably strong area of support to watch today for a bounce higher. In terms of take-profit levels, using the 38.2% and 61.8% based from leg A-D is an option, and one widely followed among ABCD traders. Locating protective stop-loss orders beneath the 127.2% Fibonacci ext. at 1.3234 is certainly an idea; others may prefer using the 161.8% Fibonacci ext. point at 1.3208, or the 1.32 handle.
USD/CHF:
(Italics – previous analysis).
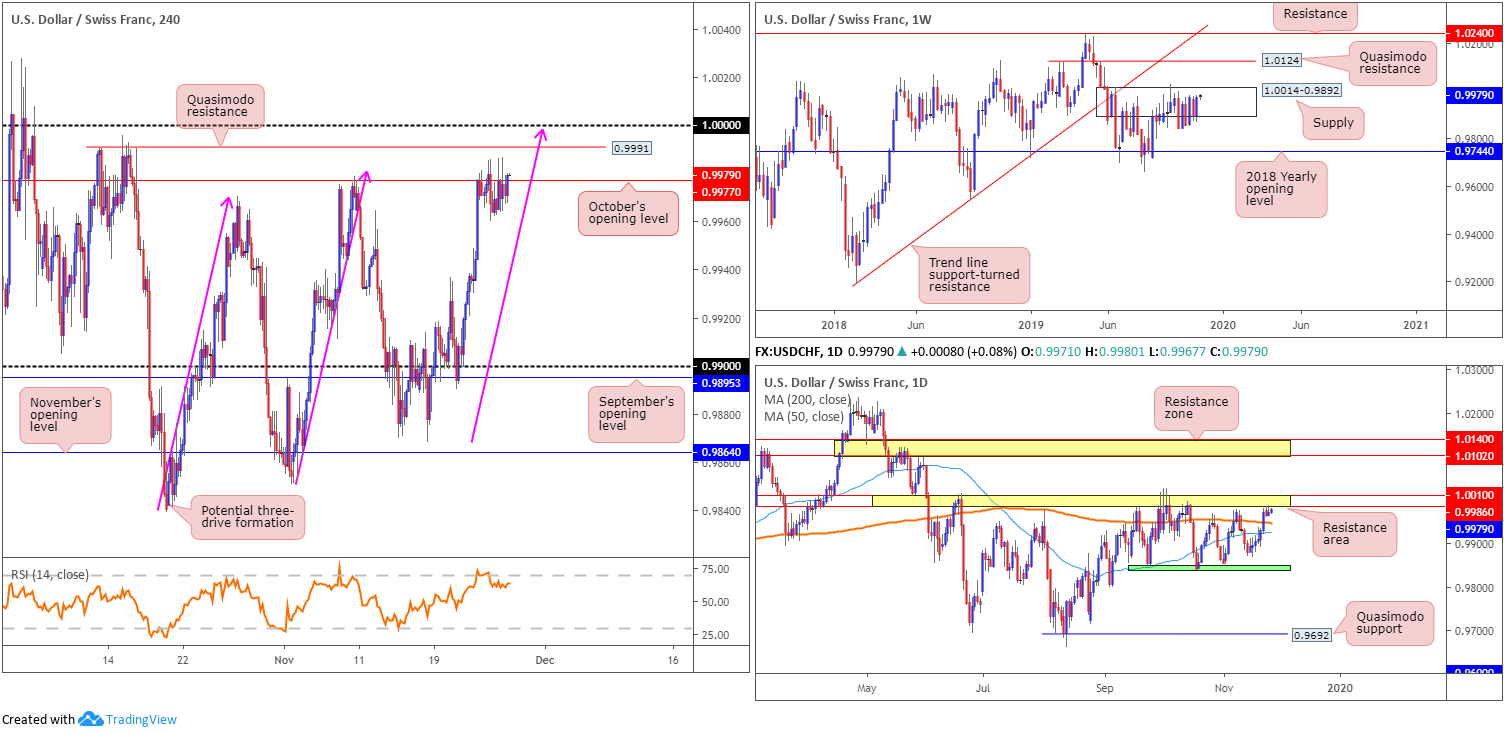
Kicking off with a look at the weekly timeframe, we can see the unit remains nestled within supply at 1.0014-0.9892. As highlighted in previous reports, the beginning of October witnessed a penetration to the outer edge of the supply area’s limit, possibly tripping a portion of buy stops and weakening sellers. An upside move out of the said supply may draw in Quasimodo resistance at 1.0124, while downside has the 2018 yearly opening level at 0.9744 in sight. According to the primary trend, price also reflects a slightly bullish tone; however, do remain aware we have been rangebound since the later part of 2015 (0.9444/1.0240).
As evident from the daily timeframe, recent buying absorbed both the 50-day SMA (blue – 0.9925) and 200-day SMA (orange – 0.9947). Traders may also want to acknowledge that since mid-September, the unit has been busy carving out a consolidation between support around the 0.9845ish region (green) and a resistance area coming in at 1.0010/0.9986. Note price is seen toying with upper edge of the said range, as we write.
Quasimodo resistance at 0.9991 and 1.0000 (parity) shines bright as the next valid ceiling on the H4 timeframe. Buy stops plotted above October’s opening level at 0.9977 make Quasimodo resistance at 0.9991 incredibly attractive for shorts, though stop-loss placement is vitally important here given 1.0000 may also act as a magnet. This is further emphasised by a potential three-drive formation (pink arrows) at 0.9998.
Areas of consideration:
The higher-probability sell zone likely resides around the 1.0000 vicinity. Not only is the level stationed within weekly supply at 1.0014-0.9892, it merges closely with a three-drive H4 pattern and also inhabits the daily resistance area at 1.0010/0.9986. From 1.0000, traders have the option of positioning protective stop-loss orders above the top edge of the daily resistance area, targeting 0.9977 as the initial take-profit zone.
Dow Jones Industrial Average:
Major US equity indexes notched additional gains Tuesday amid renewed hopes of a US/China trade deal, and upbeat assessment of the economy from Federal Reserve Chairman Jerome Powell. The Dow Jones Industrial Average advanced 55.21 points, or 0.20%; the S&P 500 added 6.86 points, or 0.22% and the tech-heavy Nasdaq 100 added 13.82 points, or 0.17%.
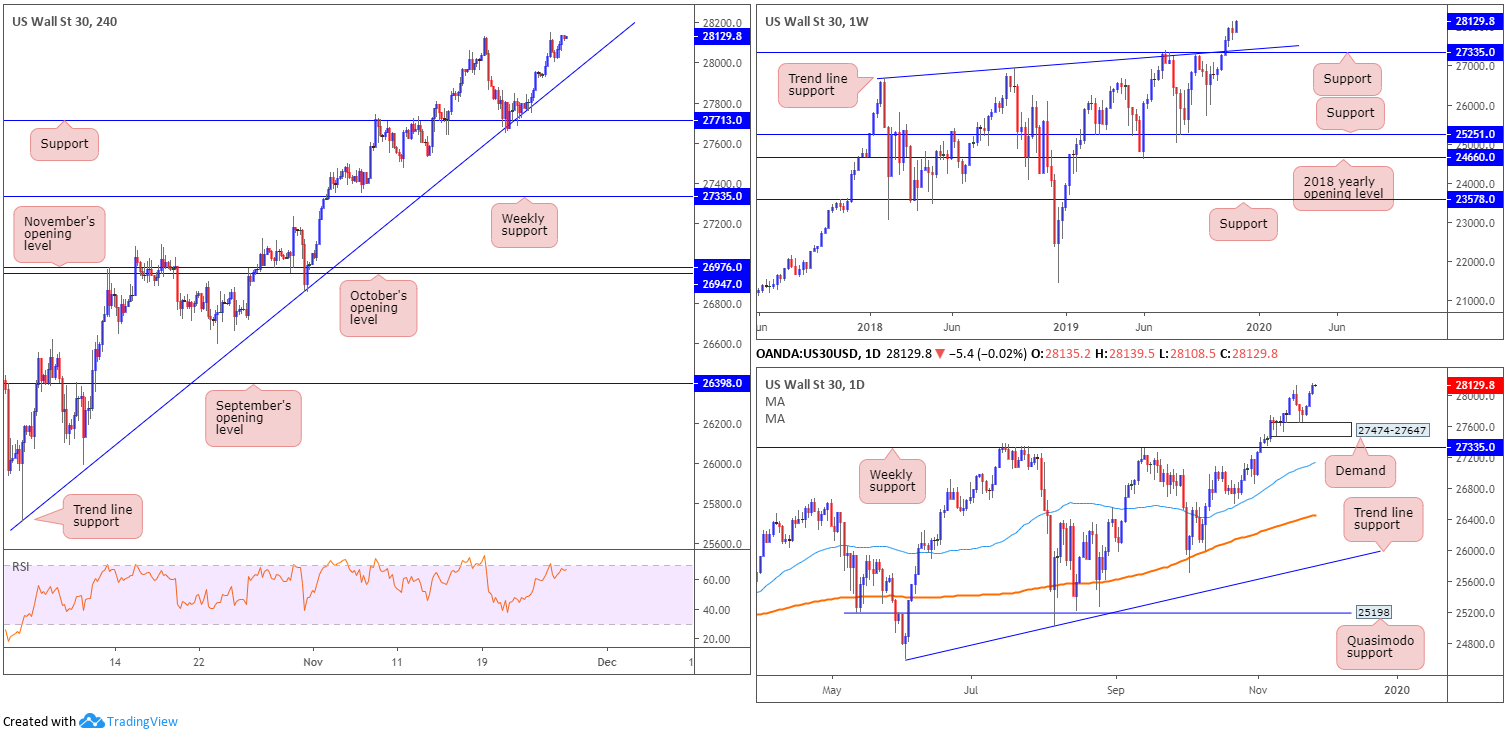
The Dow clinched an all-time high of 28151 yesterday, consequently recording its third consecutive daily gain. Technically, H4 price has a trend line support extended from the low 25710 in sight as a potential ‘floor’. Daily movement, however, has limited support until reaching demand coming in at 27474-27647 (the origin of the most recent up move). Both the 50-day SMA (blue – 27141) and the 200-day SMA (orange – 26460) continue to face north. In terms of weekly price, the index has trend line support taken from the high 26670, which merges closely with support at 27335.
Areas of consideration:
With the trend forming higher peaks, this remains a buyers’ market right now. The current H4 trend line support offers a potential platform for buyers, though given trend lines are open to whipsaws, traders may opt to entering on the back of additional candlestick confirmation. Not only does this help identify buyer intent, it also provides traders entry and risk levels.
XAU/USD (GOLD):
(Italics – previous analysis).
XAU/USD chalked up a modest recovery Tuesday, adding more than $6, or 0.41%. Although the recent upturn in price reclaimed Monday’s losses, the technical landscape remains pretty much unchanged.
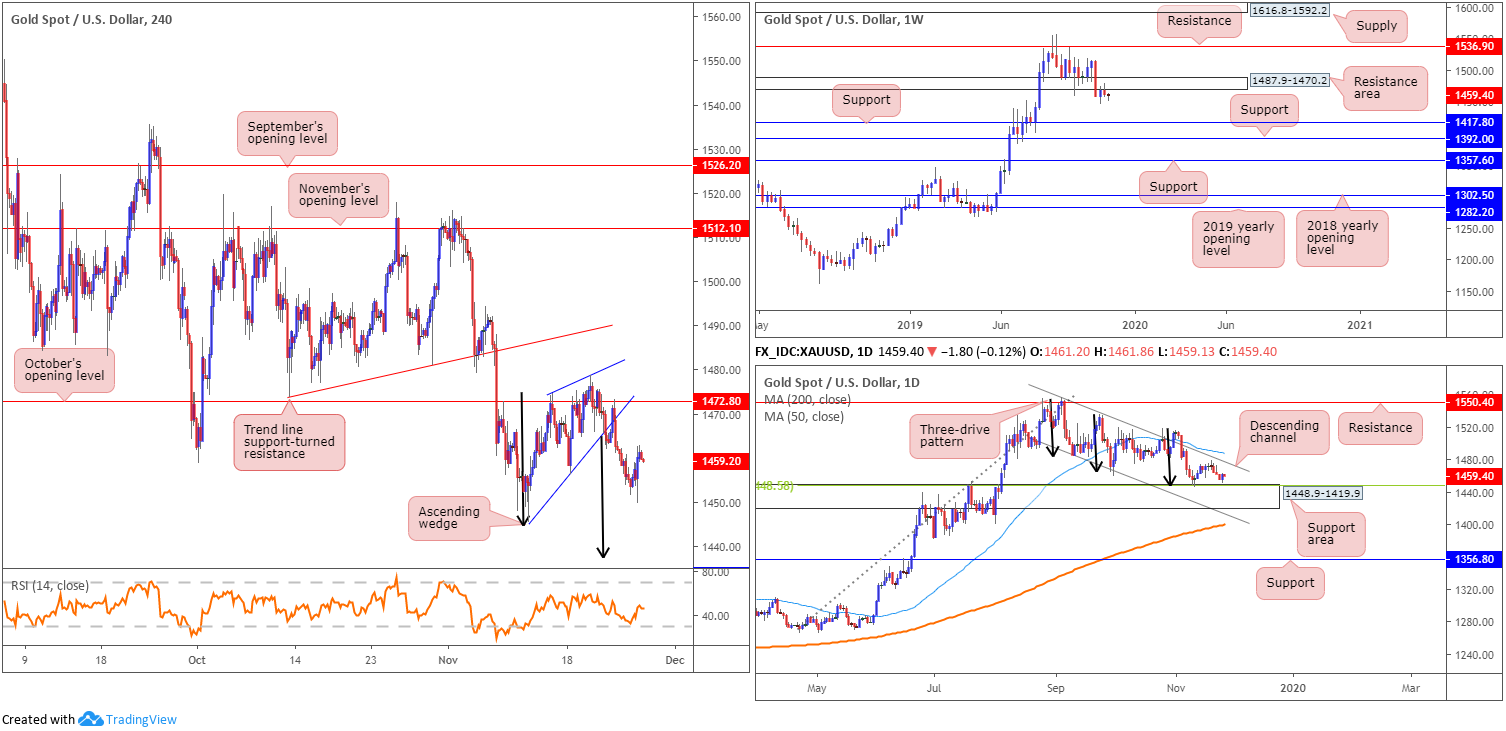
The H4 ascending wedge, formed since bottoming at 1445.5, had its lower edge give way in recent trade, suggesting a run lower may be on the cards. The take-profit target for an ascending wedge can be measured by taking the size of the base and applying the value to the breakout point (black arrows); in this case, 1437.7. Friday concluded the week outside of the said wedge configuration, though not before retesting the underside of October’s opening level at 1472.8. The run lower so far has been reasonably impressive, though yesterday’s advance may have frightened a few sellers out of the market.
From the weekly timeframe, the candles remain languishing south of a notable resistance area at 1487.9-1470.2. Further rejection off the underside of 1487.9-1470.2 potentially sets the long-term stage for a move towards two layers of support at 1392.0 and 1417.8.
In terms of the daily timeframe, price hovers north of a support area coming in at 1448.9-1419.9, which aligns closely with a 38.2% Fibonacci retracement ratio at 1448.5, and is further bolstered by the completion of a three-drive pattern (black arrows).
Areas of consideration:
Despite Tuesday’s advance, price is still likely to shake hands with at least the top edge of the current daily support area at 1448.9, considered the first take-profit target out of the noted H4 ascending wedge, followed by 1437.7. Traders will likely look to reduce risk to breakeven once/if 1448.9 enters the mix and liquidate a portion of the position.
The accuracy, completeness and timeliness of the information contained on this site cannot be guaranteed. IC Markets does not warranty, guarantee or make any representations, or assume any liability regarding financial results based on the use of the information in the site.
News, views, opinions, recommendations and other information obtained from sources outside of www.icmarkets.com.au, used in this site are believed to be reliable, but we cannot guarantee their accuracy or completeness. All such information is subject to change at any time without notice. IC Markets assumes no responsibility for the content of any linked site.
The fact that such links may exist does not indicate approval or endorsement of any material contained on any linked site. IC Markets is not liable for any harm caused by the transmission, through accessing the services or information on this site, of a computer virus, or other computer code or programming device that might be used to access, delete, damage, disable, disrupt or otherwise impede in any manner, the operation of the site or of any user’s software, hardware, data or property.


