
EUR/USD:
Entirely engulfing Monday’s gains, the shared currency took to the downside on Tuesday from the green zone sited on the H4 timeframe at 1.1734/1.17 (comprised of June’s opening level at 1.1705, a 61.8% H4 Fib resistance value at 1.1721 and a H4 resistance area at 1.1710-1.1734). What sealed the deal for us regarding this zone, though, was the fact that it houses the lower edge of the weekly resistance area within at 1.1717-1.1862. Well done to any of our readers who managed to take advantage of this trade, as price is nearing its first take-profit zone: H4 support at 1.1627.
Areas of consideration:
Although 1.1627 is the initial target, the team has noted to remain cognizant of the bigger picture as we could be in for much lower levels! Not only do we have weekly price responding to the lower edge of its resistance area, which shows room to press as far south as the weekly trend line support (taken from the low 1.0340), we also see there is scope for further selling on the daily timeframe down to daily support coming in at 1.1574.
For folks that remain short, reducing risk to breakeven and taking partial profits at H4 support 1.1627 is a reasonable plan. The next port of call beyond 1.1627 falls in at the 1.16 handle, followed then by daily support at 1.1574. By this point, it may be an idea to have the majority of your position closed.
Today’s data points: EUR M3 Money supply y/y; US durable goods orders m/m; FOMC member Quarles speaks.

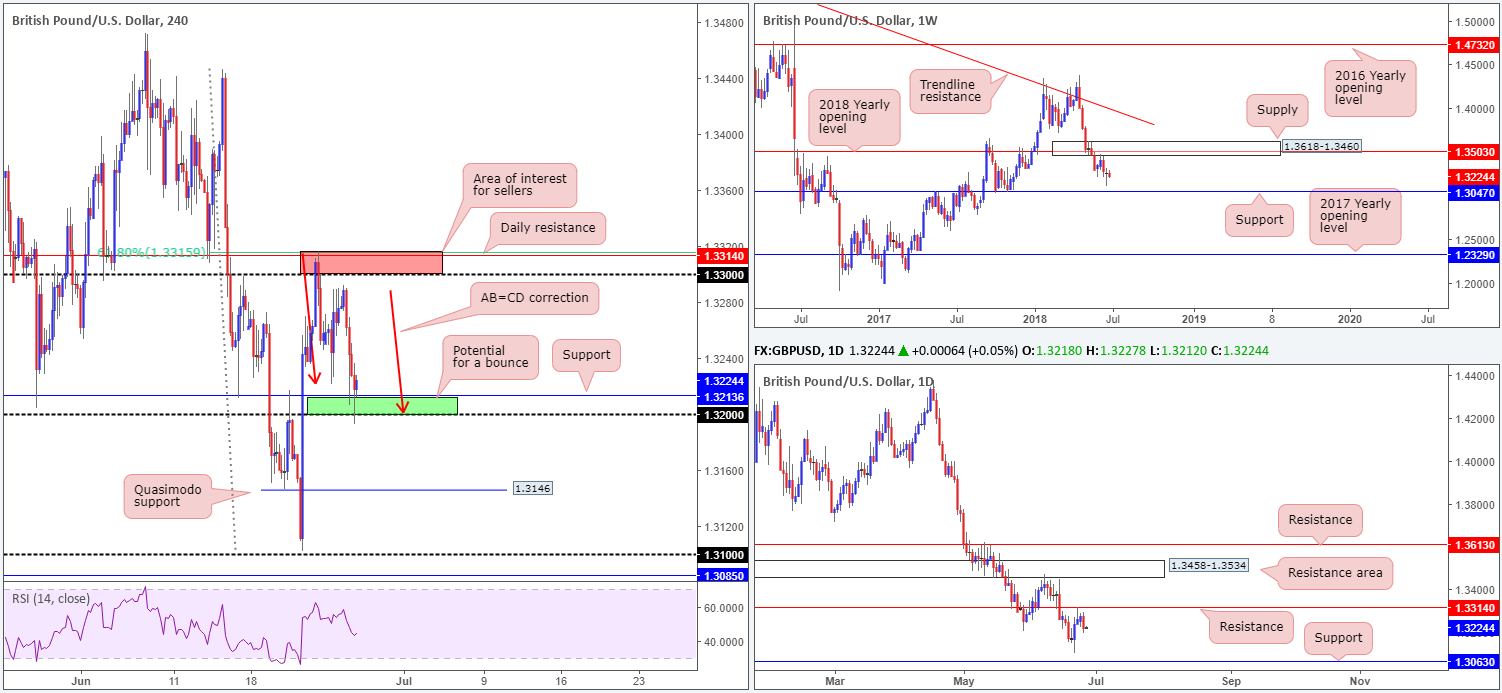
GBP/USD:
Try as it might, cable couldn’t reclaim the 1.33 handle on Tuesday. Topping at highs of 1.3292, the pair sold off amid European trade, exacerbated by a robust USD across the board and comments from BoE’s Haskel who expressed a degree of caution on rates.
Technically speaking, yesterday’s move lower brought the H4 candles towards a buy zone located at 1.32/1.3213, which happens to align with a H4 AB=CD correction (red arrows). To be clear, this is not a high-probability reversal zone. As stated in previous reports, we expected an intraday bounce from here, which is what we got. Why lower prices could still be on the cards from here comes from observing the higher timeframes. Note that on the weekly timeframe we have room to press lower until reaching support drawn from 1.3047. Further to this, daily sellers printed a nice-looking bearish engulfing candle during yesterday’s action, and shows space to attack the June 21 lows at 1.3102, followed closely by daily support at 1.3063 (sited just north of the mentioned weekly support level).
Areas of consideration:
Ultimately, we’re looking for a favorable USD wind to force the GBP below 1.32. A H4 close beneath this number that’s followed up with a retest in the shape of a full or near-full-bodied H4 bearish candle would, in our humble view, be sufficient enough to consider shorting this market. With stops tucked above the rejection candle’s wick, traders’ crosshairs will likely be fixed on the H4 Quasimodo support at 1.3146 as the initial take-profit zone. Areas beyond here fall in at June 21 lows mentioned above at 1.3102 (effectively denoting the 1.31 handle) and daily support, also highlighted above, at 1.3063.
Today’s data points: BoE Gov. Carney speaks; BoE financial stability report; US durable goods orders m/m; FOMC member Quarles speaks.
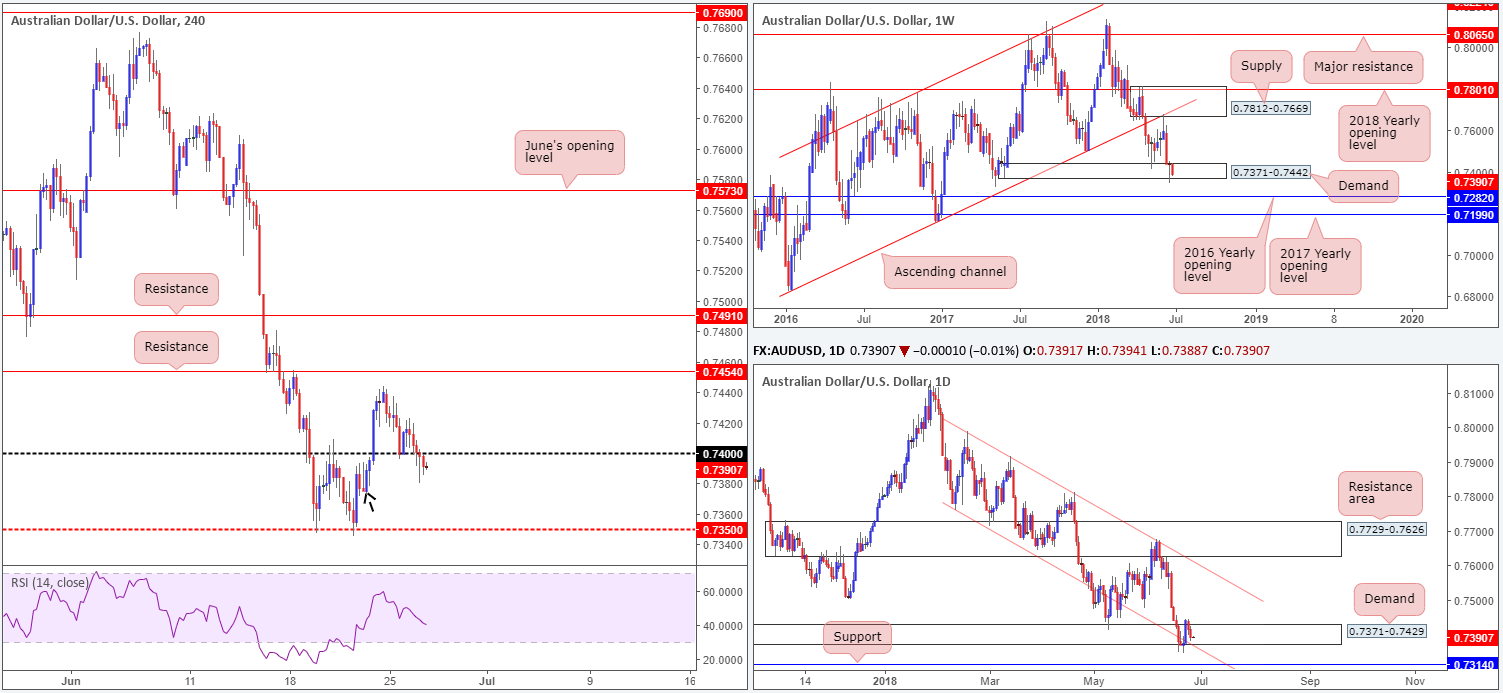
AUD/USD:
Despite an earnest attempt to hold ground above the 0.74 handle, the commodity currency failed to sustain upside beyond highs of 0.7423. A healthy bid surrounding the USD, as well as ongoing trade concerns, pulled H4 price back beneath 0.74 on Tuesday. H4 demand at 0.7371-0.7393 (marked with a black arrow), however, is seen nearby and appears to be supporting the market for now. A violation of this area opens downside to familiar H4 support in the form of 0.7350.
Weekly demand at 0.7371-0.7442 remains in the fray, but seems to be hanging on by a thread. Last week’s push below this area likely tripped stops and cleared the path south to nearby weekly support at 0.7282. A similar story is seen on the daily timeframe. Daily demand at 0.7371-0.7429 (plotted within the lower limit of the aforementioned weekly demand area) has yet to print anything noteworthy to the upside, despite additional confluence seen at this zone in the form of a daily channel support taken from the low 0.7758.
Areas of consideration:
According to our reading, the Australian dollar expresses a subtle bearish vibe at the moment.
In light of the above, however, we feel neither a long nor short is attractive this morning:
- Buying this market places you at the underside of 0.74, with the possibility of weak demand on the higher timeframes.
- Selling this market positions one at nearby H4 demand mentioned above at 0.7371-0.7393 and against higher-timeframe demand, though possibly weak.
Today’s data points: US durable goods orders m/m; FOMC member Quarles speaks.
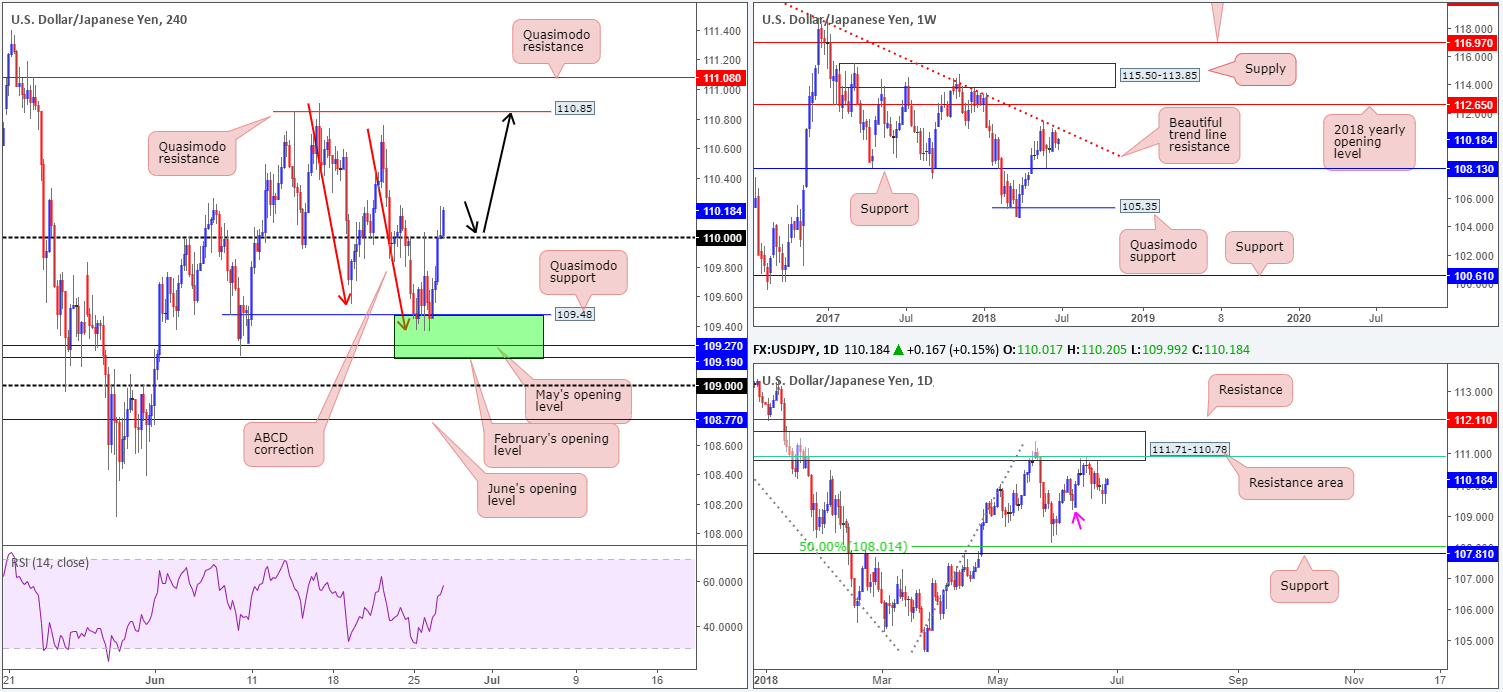
USD/JPY:
After a somewhat aggressive sell from the underside of 110 on Monday, USD/JPY buyers went on the offensive amid Tuesday’s segment from our pre-determined H4 buy zone marked in green at 109.19/109.48 – consisting of February and May’s opening levels, a H4 Quasimodo support and a H4 ABCD correction (red arrows). Bolstered by a healthy USD, the pair managed to conclude the day above the 110 handle going into the close. Assuming the buyers defend this level as support, traders will likely be eyeing the H4 Quasimodo resistance level at 110.85
What’s beautiful about the H4 Quasimodo level is it is positioned within the lower limits of a daily resistance area at 111.71-110.78, which, as you can see, also converges with a 61.8% daily Fib resistance value at 110.91 (green line) and a weekly trend line resistance taken from the high 123.67.
Areas of consideration:
Keeping it Simple Simon this morning, the team has noted to keep eyeballs on 110 for potential retest plays (see black arrows), targeting the H4 Quasimodo resistance level mentioned above at 110.85. Should the retest be supported with a full or near-full-bodied H4 bull candle, this would likely increase the odds of the trade moving in favour.
In addition to the above, traders are also encouraged to keep eyes on the noted H4 Quasimodo resistance for possible shorts, with stops tucked above a neighbouring H4 Quasimodo resistance at 111.08.
Today’s data points: US durable goods orders m/m; FOMC member Quarles speaks.
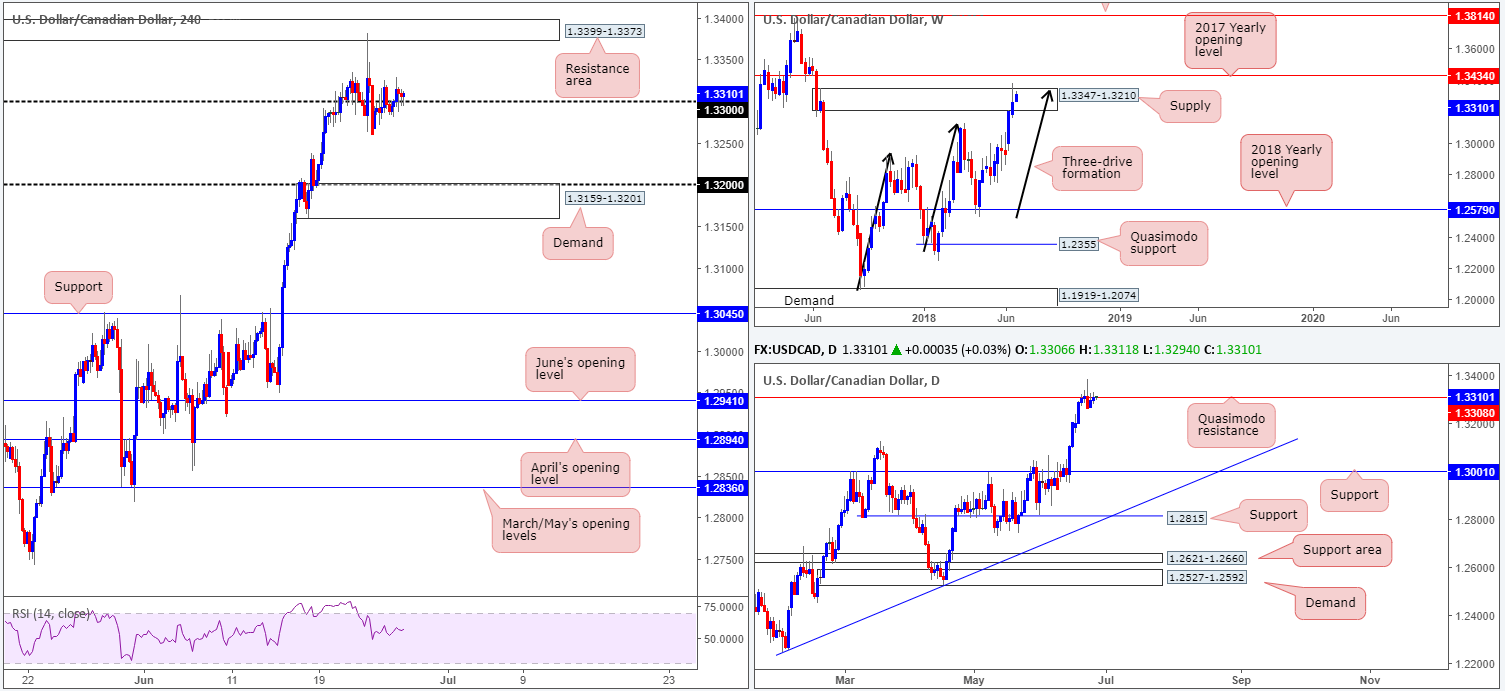
USD/CAD:
In recent trade, crude oil prices advanced to highs of 70.86, but had little effect on the USD/CAD as the pair continues to fluctuate around the 1.33 handle. The reason behind this could be due to a well-bid USD across the board. As of writing, H4 price is establishing support above 1.33, which could lead to a move being seen up to the H4 resistance zone penciled in at 1.3399-1.3373.
This H4 resistance zone is positioned above weekly supply at 1.3347-1.3210, and the recently completed three-drive approach (see black arrows). On the other side of the spectrum, nevertheless, daily movement continues to flirt with the underside of a daily Quasimodo resistance level at 1.3308. Collective resistances on the higher timeframes might explain why USD/CAD bulls are having a hard time pushing north!
Areas of consideration:
Buying from 1.33 is a daredevil move, according to structure in this market. You’d effectively be entering long into weekly supply and a daily Quasimodo resistance. What the bulls do have on their side, nonetheless, is the trend and a robust DXY.
As is evident from above, this is a tricky market to read at the moment. Given bids/offers appear even at the moment, opting to stand on the sidelines may be the better path to take. Should we witness a decisive H4 close back beneath 1.33 that’s followed with a retest in strong fashion, though, this would, according to current structure on weekly and daily charts, be a strong sign of selling strength and likely reach H4 demand at 1.3159-1.3201.
Today’s data points: US durable goods orders m/m; FOMC member Quarles speaks; BoC Gov. Poloz speaks; Crude oil inventories.
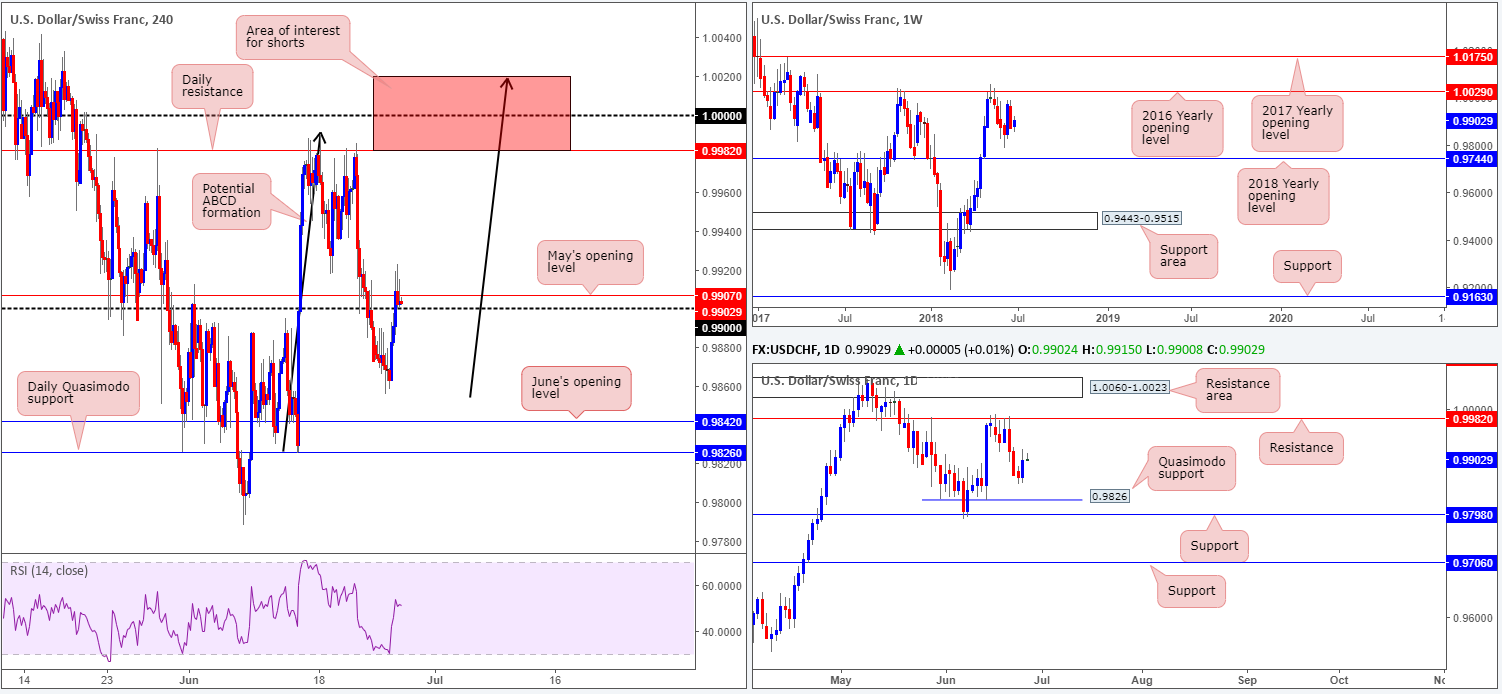
USD/CHF:
Leaving June’s opening level seen on the H4 timeframe at 0.9842 unchallenged, USD/CHF bulls went on the offensive on Tuesday, breaking a three-day bearish phase. The move pulled H4 price above the 0.99 handle, but had difficulty overcoming nearby resistance at 0.9907: May’s opening level.
Areas of consideration:
At current price we do not see much to hang our hat on in terms of high-probability trading opportunities, as there’s limited higher-timeframe structure visible at the moment.
An area which has sparked some interest, however, albeit a relatively long way off, is the red zone drawn on the H4 chart at 1.0020/0.9981 (comprised of the key figure 1.0000 [parity], a daily resistance level at 0.9982 and a [potential] H4 ABCD bearish formation [black arrows]). A H4 bearish candle, be it full or near-full-bodied, printed within this zone, would be considered a strong sign that sellers are likely to take things lower from here.
Today’s data points: US durable goods orders m/m; FOMC member Quarles speaks; CHF Credit Suisse economic expectations.
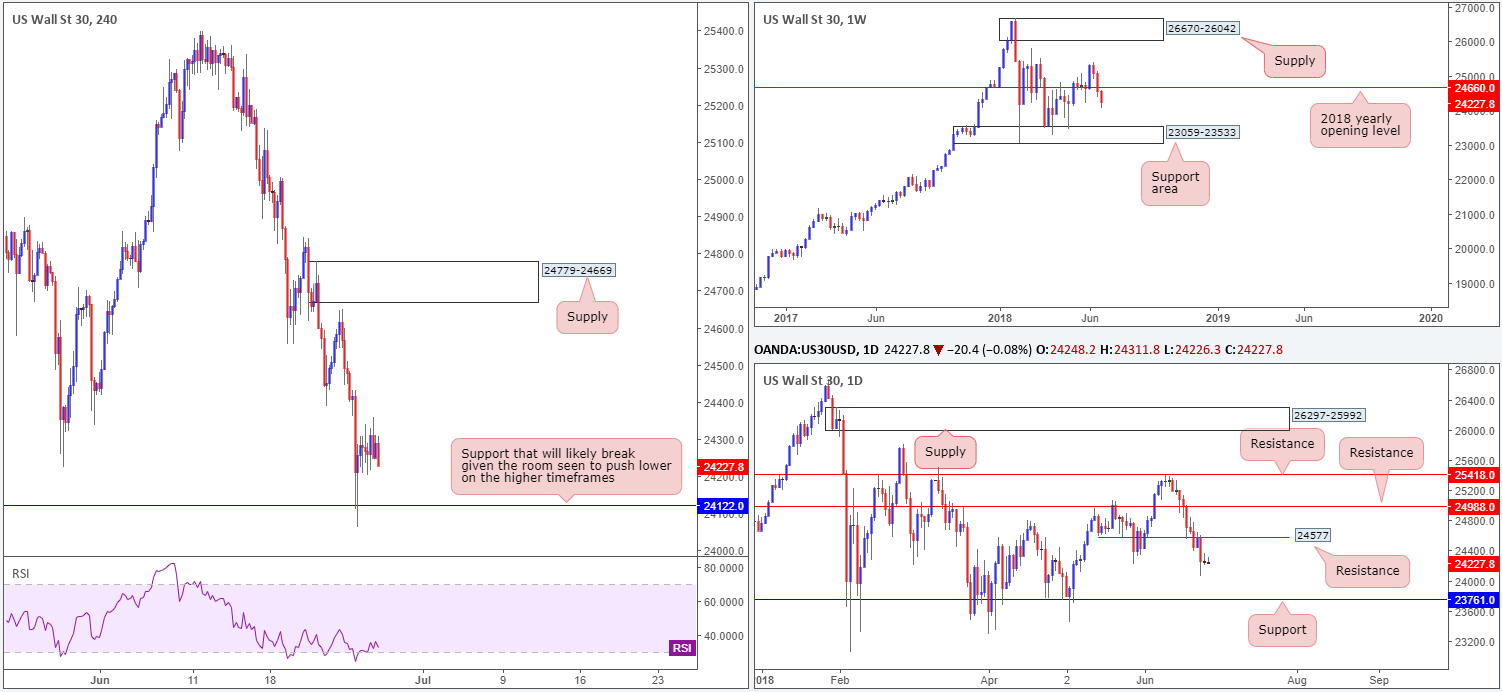
Dow Jones Industrial Average:
US equities spent Tuesday working inside a tight range, plotted just ahead of H4 support at 24122. In view of this, much of the following report will echo similar thoughts expressed in yesterday’s analysis.
Kicking off with weekly structure, price continues to air bearish vibes beneath the 2018 yearly opening level at 24660. Assuming this remains so, further downside could potentially be seen towards a weekly support area coming in at 23059-23533. Meanwhile, daily activity shows that following a strong retest to the underside of daily resistance at 24577 on Monday, the index appears poised to approach daily support at 23761.
Areas of consideration:
On account of yesterday’s movement, as well as where the index is positioned on the higher timeframes, further downside is possible. With that being the case, watch for a H4 close beneath the current H4 support that’s followed up with a strong retest as resistance for potential shorts, targeting the aforementioned daily support.
Today’s data points: US durable goods orders m/m; FOMC member Quarles speaks.
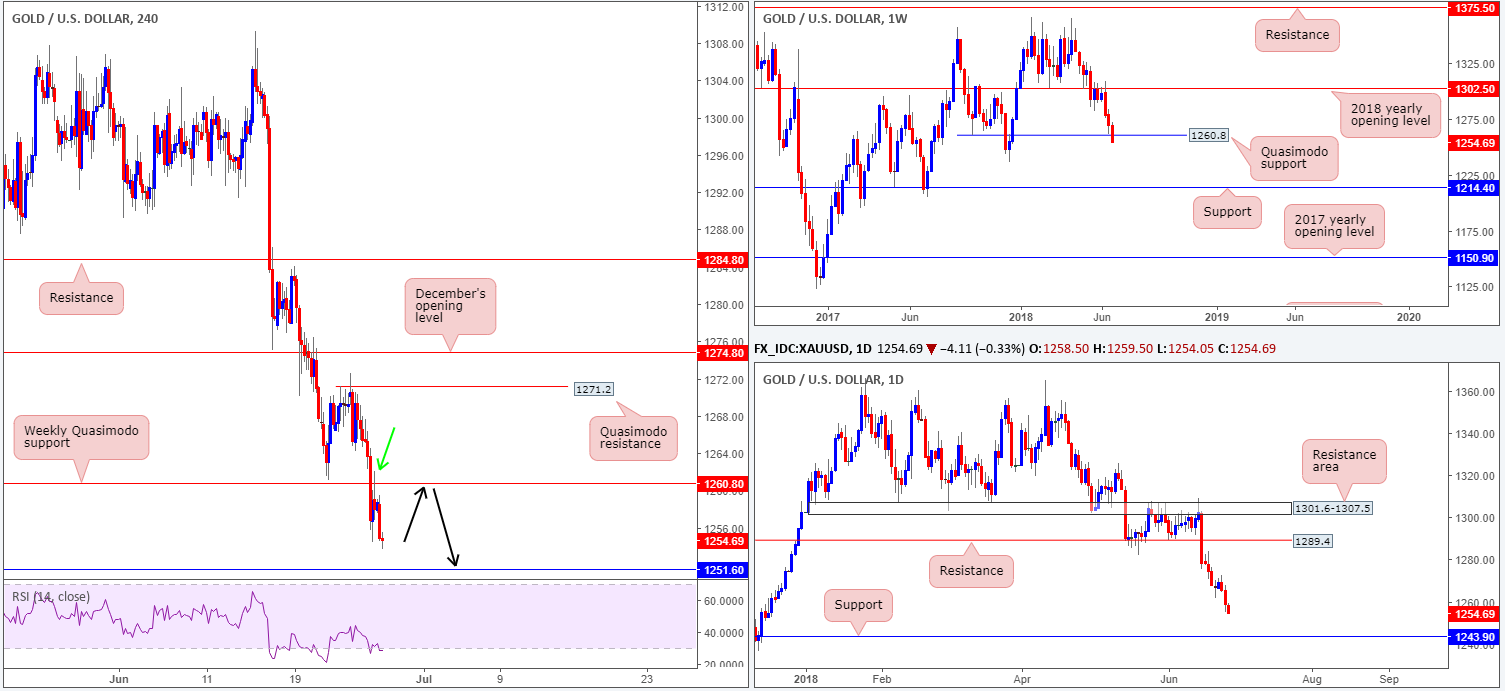
XAU/USD (Gold)
At mercy of USD bidding, the price of gold declined in recent trade. A key weekly Quasimodo support level priced in at 1260.8 suffered a breach amid yesterday’s movement, potentially opening the doors for a test of December 2017 lows at 1236.6. A closer look at price action on the daily timeframe also points to further selling, with little support visible until we reach the 1243.9 mark.
Across on the H4 timeframe, we can see that the underside of the recently breached weekly Quasimodo support at 1260.8 was used as a resistance level amid trade on Tuesday. Although both weekly and daily flows suggest additional selling may be on the cards, sellers need to remain cognizant of nearby H4 support at 1251.6.
Areas of consideration:
Having seen H4 price test the underside of the noted weekly Quasimodo support and hold ground, traders may want to pencil this level in as a possible resistance today. Do bear in mind, though, that since the level has already been tested, H4 action may probe north to take out stops above the high marked with a green arrow at 1262.1, before turning south from here. Waiting and seeing if H4 price can chalk up a full or near-full-bodied bearish candle will help avoid this potential fakeout (stops positioned above the rejection candle’s wick with the initial take-profit zone planted at 1251.6).
The use of the site is agreement that the site is for informational and educational purposes only and does not constitute advice in any form in the furtherance of any trade or trading decisions.
The accuracy, completeness and timeliness of the information contained on this site cannot be guaranteed. IC Markets does not warranty, guarantee or make any representations, or assume any liability with regard to financial results based on the use of the information in the site.
News, views, opinions, recommendations and other information obtained from sources outside of www.icmarkets.com.au, used in this site are believed to be reliable, but we cannot guarantee their accuracy or completeness. All such information is subject to change at any time without notice. IC Markets assumes no responsibility for the content of any linked site. The fact that such links may exist does not indicate approval or endorsement of any material contained on any linked site.
IC Markets is not liable for any harm caused by the transmission, through accessing the services or information on this site, of a computer virus, or other computer code or programming device that might be used to access, delete, damage, disable, disrupt or otherwise impede in any manner, the operation of the site or of any user’s software, hardware, data or property.


