
A note on lower timeframe confirming price action…
Waiting for lower timeframe confirmation is our main tool to confirm strength within higher timeframe zones, and has really been the key to our trading success. It takes a little time to understand the subtle nuances, however, as each trade is never the same, but once you master the rhythm so to speak, you will be saved from countless unnecessary losing trades. The following is a list of what we look for:
- A break/retest of supply or demand dependent on which way you’re trading.
- A trendline break/retest.
- Buying/selling tails – essentially we look for a cluster of very obvious spikes off of lower timeframe support and resistance levels within the higher timeframe zone.
- Candlestick patterns. We tend to only stick with pin bars and engulfing bars as these have proven to be the most effective.
For us, lower timeframe confirmation starts on the M15 and finishes up on the H1, since most of our higher timeframe areas begin with the H4.
EUR/USD:
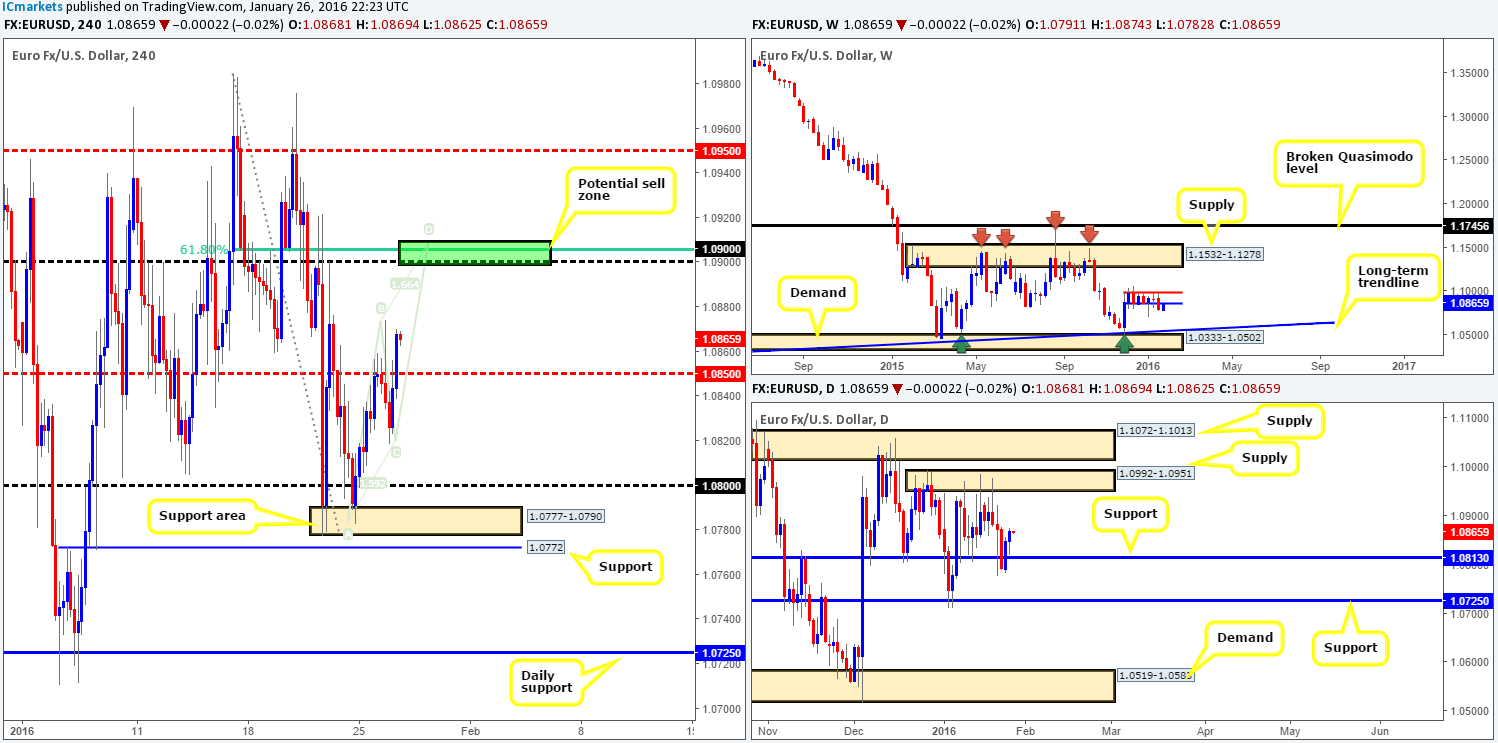
The EUR/USD shows that early morning trade in Europe saw price aggressively whipsaw through mid-level resistance 1.0850, likely collecting a truck-load of stops in the process. Following this, a session low was stamped in at 1.0818, which is where we saw the single currency change tracks and close above 1.0850 by the day’s end.
During this scuffle around 1.0850, price action printed a B/C leg of a potential H4 Harmonic AB=CD bearish pattern which tops out around the 1.0907 mark. Supporting this, we can also see both a psychological resistance number drawn from 1.0900 and a 61.8% Fibonacci level at 1.0906. Together they likely form a tight concentration of offers in this market. However, there is a drawback to this trade. Daily supply at 1.0992-1.0951 hangs fifty pips above so price could very well ignore the H4 sell zone and head towards this barrier.
As a result, the best way we feel to approach this is to simply watch lower timeframe price action at the 1.0900 area. If one is able to spot selling strength building here i.e. a break of demand, a trendline break, a collection of selling tails around lower timeframe resistance, then we feel a short is viable. Targets, should the trade come to fruition, will (for us) adhere to Scott Carney’s trade management (first take-profit level 38.2% Fibonacci of the A-D swing [1.0861] second take-profit level at the 61.8% of the A-D swing [1.0830]).
Levels to watch/live orders:
- Buys: Flat (Stop loss: N/A).
- Sells: 1.0900 region [Tentative – confirmation required] (Stop loss: dependent on where one confirms this area).
GBP/USD:
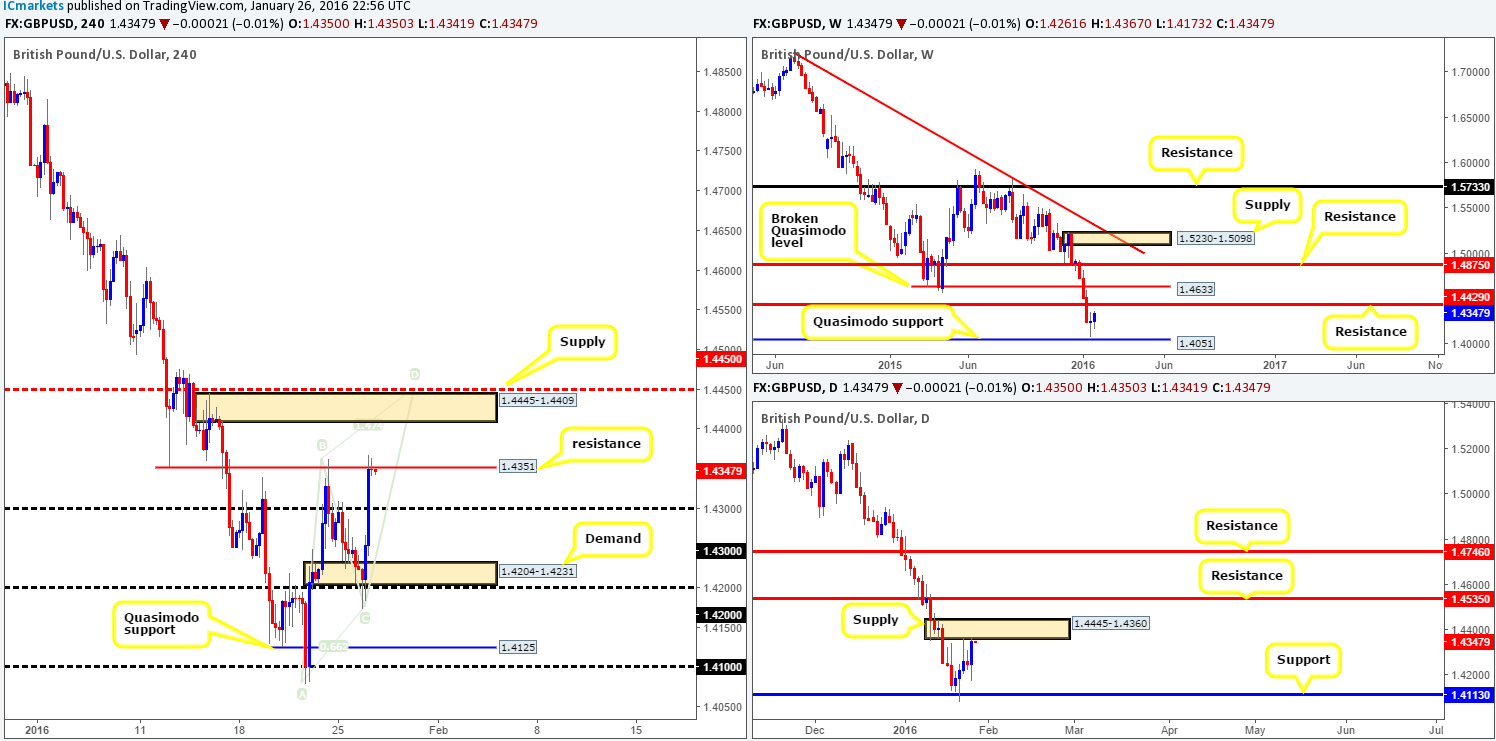
Despite Carney’s comments that U.K rates could be cut, Cable advanced north yesterday following a whipsaw through both H4 demand at 1.4204-1.4231 and psychological support 1.4200. This, as can be seen from the chart, saw the pair rally over 150 pips, breaking above psychological resistance 1.4300 and colliding into H4 resistance coming in at 1.4351.
Due to this recent advance, price is seen teasing the underside of a daily supply zone at 1.4445-1.4360, which wraps itself around a weekly resistance level drawn from 1.4429. As such, a sell-off from the 1.4351 H4 resistance is possible in our opinion. However, for us to short this pair, we would want to see price connect with H4 supply seen above at 1.4445-1.4409. Not only does this beast sit within the extremes of the aforementioned daily supply zone, it also encapsulates the weekly resistance at 1.4429 and houses a H4 Harmonic AB=CD bearish completion point at the upper end of the H4 supply at 1.4446.
Given the above confluence, our team has placed a pending sell order at 1.4406 with a stop set above at 1.4477. Granted, this is a rather large stop and the reason for this is to avoid a fakeout above the AB=CD completion point.
Levels to watch/live orders:
- Buys: Flat (Stop loss: N/A).
- Sells: 1.4406 (Stop loss: 1.4477).
AUD/USD:
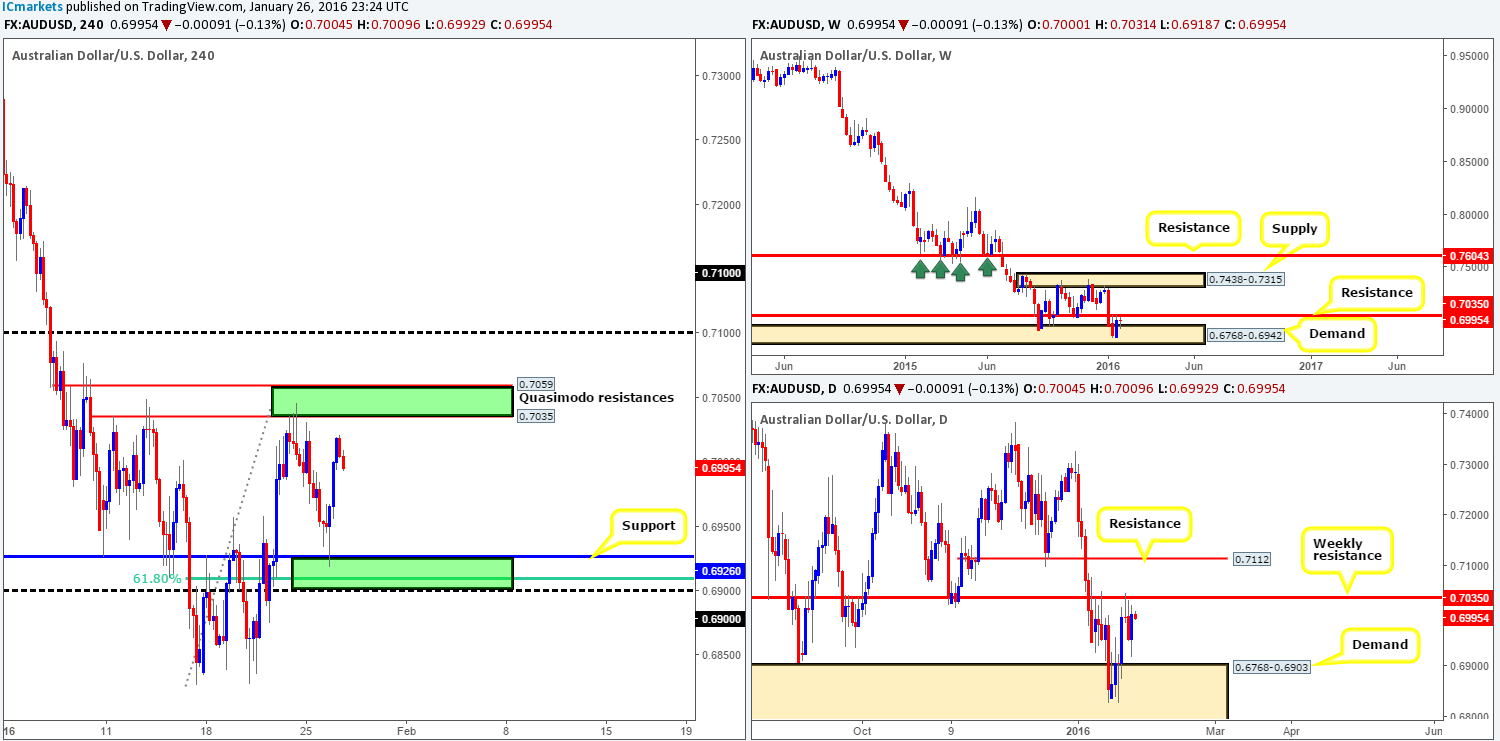
In our previous report (http://www.icmarkets.com/blog/tuesday-26th-january-daily-technical-outlook-and-review/) we mentioned that we were still short from 0.7034 and had 50% of our position remaining in the market, targeting the H4 support at 0.6926 as our final take-profit level. We also spoke about this take-profit area also being an awesome buy zone. As you can see, price hit final take profit and rebounded higher. Our short was closed but we unfortunately could not find a lower timeframe buy setup to go long from here! Well done to any of our readers who did though!
In that price is now floating in between the H4 Quasimodo resistances 0.7059/0.7035 and H4 support at 0.6926, where do we go from here? Well, there is not much to be gathered from the weekly chart due to price being tightly sandwiched between a resistance at 0.7035 and demand coming in at 0.6768-0.6942. By the same token, daily action is also seen capped between the above said weekly resistance and a daily demand painted at 0.6768-0.6903. There is, as far as we see, not any clear direction in this market right now where structure is concerned. Therefore, we feel the best path to take is to simply keep an eye on the above said H4 areas (green areas) for trades seeing as they fuse nicely with higher timeframe structures (see above). We would highly recommend waiting for lower timeframe confirmation before trading either H4 zone, nevertheless, due to the possibility of a fakeout.
Levels to watch/live orders:
- Buys: 0.6926/0.6900 [Tentative – confirmation required] (Stop loss: dependent on where one confirms this area).
- Sells: 0.7059/0.7035 [Tentative – confirmation required] (Stop loss: dependent on where one confirms this area).
USD/JPY:
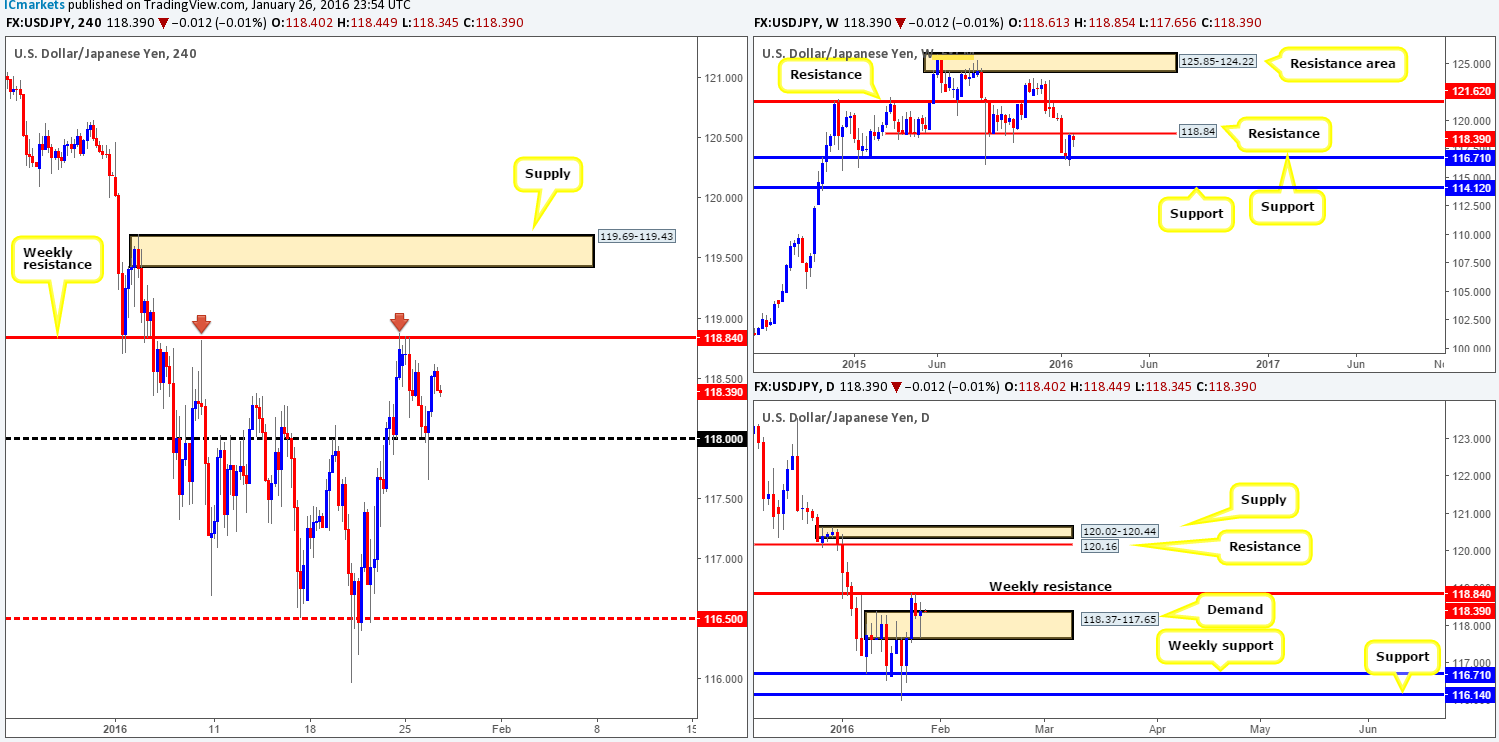
Beginning with a look at the weekly chart, it’s clear to see that the buyers and sellers remain battling for position around the underside of resistance drawn from 118.84. Should a break above this hurdle take ground, the next objective to reach is resistance penciled in at 121.62. Turning our attention to the daily chart, however, price is seen capped between the weekly resistance level mentioned above at 118.84 and daily demand coming in at 118.37-117.65. A cut above weekly resistance on the daily timeframe places resistance at 120.16 in the firing range, whereas a break below demand could force this pair back down to weekly support at 116.71.
Zooming in and looking at the H4 timeframe, we can see that early on during European/London trading the USD/JPY whipsawed through psychological support 118.00, before finishing the day at highs of 118.62. Regarding today’s sessions, traders may want to keep an eye on both 118.84 and 118.00 for possible trades since they have both proved worthy. Fakeouts are extremely likely here though so trade with caution.
In addition to trading within these two barriers, a close above 118.84 could, if the level is retested as support, be a nice platform in which to look for confirmed buys from. The first take-profit target from here can be seen at the H4 supply coming in at 119.69-119.43. Be that as it may, price could trade much higher than this area given the room seen to move higher on both the weekly and daily charts (discussed above). Alternatively, a close below 118.00 could pressure this market down to weekly support at 116.71/H4 mid-level H4 support 116.50. Therefore, with a retest seen of this barrier alongside lower timeframe confirmation, we’d confidently take a short here.
Levels to watch/live orders:
- Buys: 118.00 [Tentative – confirmation required] (Stop loss: dependent on where one confirms this level). Watch for offers to be consumed around 118.84 and look to trade the any retest seen thereafter (lower timeframe confirmation required).
- Sells: 118.84 [Tentative – confirmation required] (Stop loss: dependent on where one confirms this level). Watch for bids to be consumed around 118.00 and look to trade the any retest seen thereafter (lower timeframe confirmation required).
USD/CAD:
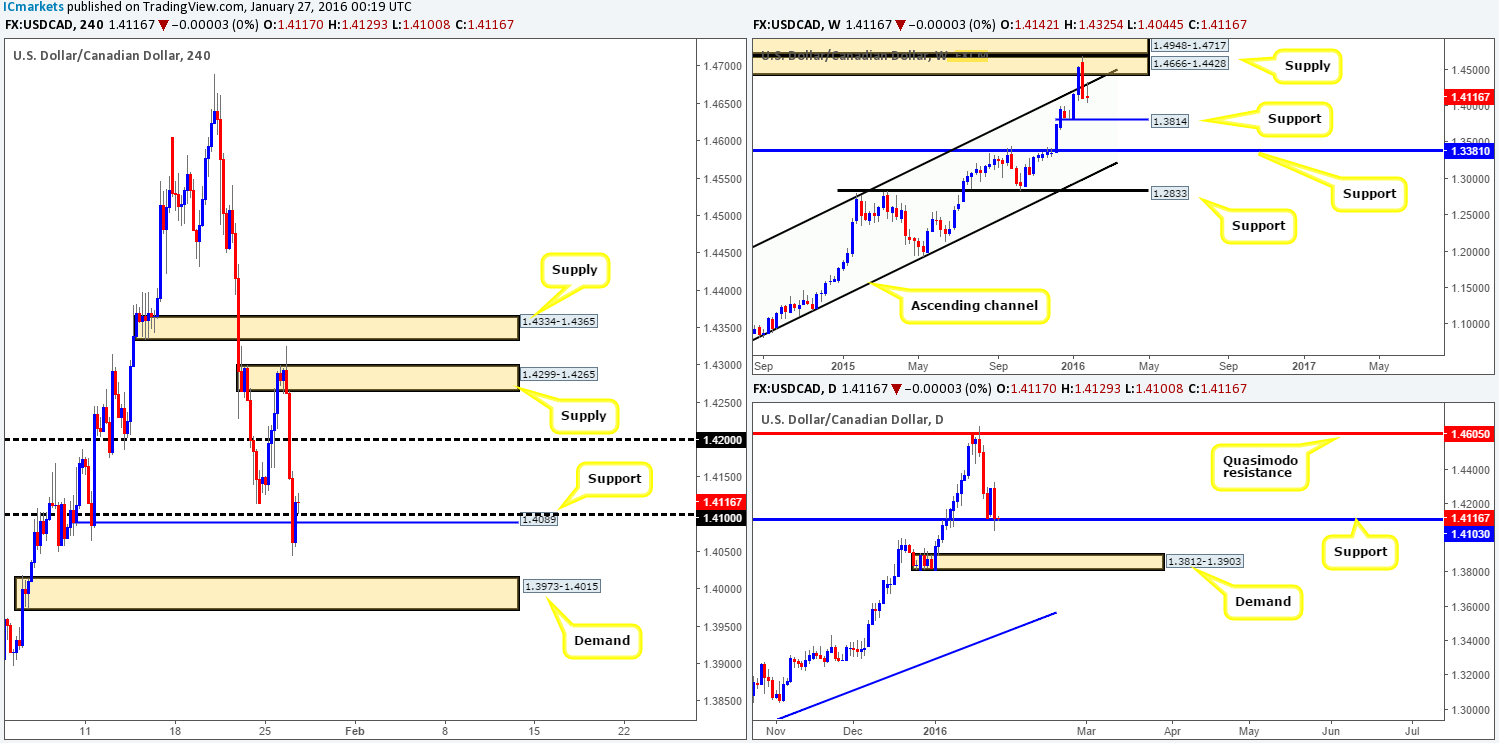
Kicking off this morning’s analysis with a look at the weekly timeframe shows that price responded well from the underside of the weekly channel resistance (1.1173) which was recently brought back into play. By contrast, stepping down to the daily timeframe, support at 1.4103 is still seen holding ground at the moment. Should a close below this barrier take form, then it is likely that the Loonie is heading down to greet demand penciled in at 1.3812-1.3903 (encapsulates weekly support at 1.3814).
Moving down to the H4 timeframe, supply at 1.4299-1.4265 suffered a nasty fakeout during the European/London opening yesterday, which clearly set the tone for the remainder of the day. Prices aggressively tumbled over 200 pips from here, taking out psychological support 1.4200 and ending the day whipsawing through both psychological support 1.4100 and H4 support at 1.4089.
So, with the weekly showing further selling is possible and both the daily and H4 timeframes at support, this leaves us in a rather tricky position – buy into weekly flow or sell into support? From our perspective, when uncertainty is present (like it is here [at least for us]) we tend to remain on the sidelines.
Levels to watch/live orders:
- Buys: Flat (Stop loss: N/A).
- Sells: Flat (Stop loss: N/A).
USD/CHF:
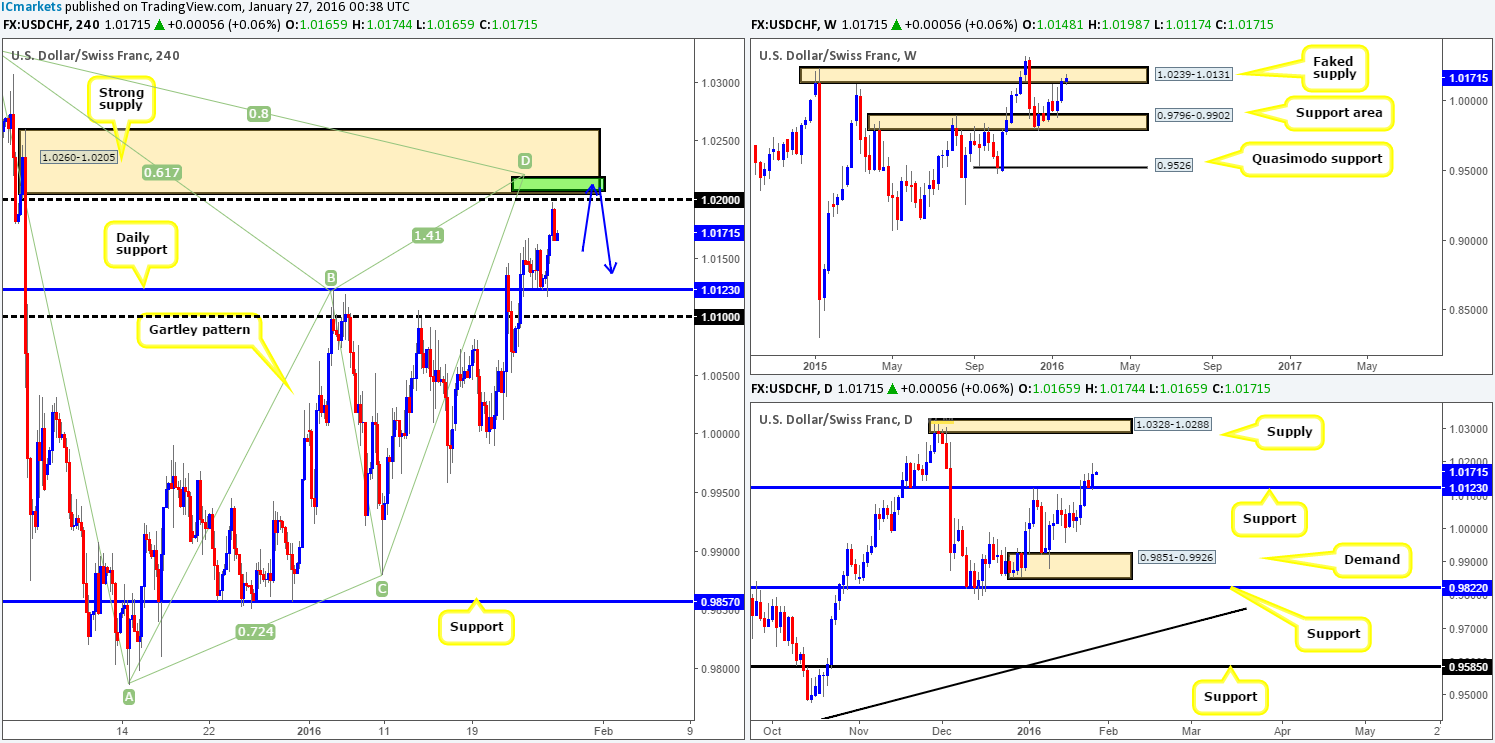
The USD/CHF pair, as you can see, responded well to daily support at 1.0123 yesterday, consequently lifting this pair to highs of 1.0198 –just two pips shy of psychological resistance 1.0200. For those who read the previous report on the Swissy (http://www.icmarkets.com/blog/tuesday-26th-january-daily-technical-outlook-and-review/), you may recall us mentioning that our team is very interested in shorting from 1.0203. Although price is currently selling-off right now, 1.0203 is still our preferred entry for shorts today. The reasons for why simply comes from the following:
- H4 supply seen at 1.0260-1.0205.
- A H4 Harmonic Gartley pattern completion point between 1.0207/1.0218 (green area).
- Psychological resistance 1.0200.
- Lodged within a weekly faked supply area coming in at 1.0239-1.0131.
Traders long from the daily support level mentioned above at 1.0123 might want to start protecting their position due to the position of price on the weekly timeframe (see above).
Levels to watch/live orders:
- Buys: Flat (Stop loss: N/A).
- Sells: 1.0203 (Stop loss: 1.0264).
DOW 30:
During the course of yesterday’s sessions London stamped in a session low of 15726, before the DOW saw a heavy round of buying hit the line. This forced the H4 to close above daily resistance at 16083, which, as you can see, is now being retested as support. Although this barrier has additional support coming in from the weekly level 15978, trading long from the current daily barrier is problematic in our opinion due to a collection of H4 supplies hanging just above (16596-16509/ 16483-16360/ 16277-16217).
However, should 16083 hold as support and a lower timeframe buy signal is spotted, we may take this trade and trail our position, watching how lower timeframe price action reacts at each of the above said H4 supplies. For anyone else looking to trade this move, we would highly recommend trying to move stops to breakeven as soon as possible since price could bounce from the first H4 supply.

Levels to watch/live orders:
- Buys: 16083 [Tentative – confirmation required] (Stop loss: dependent on where one confirms this level).
- Sells: Flat (Stop loss: N/A).
XAU/USD: (Gold)
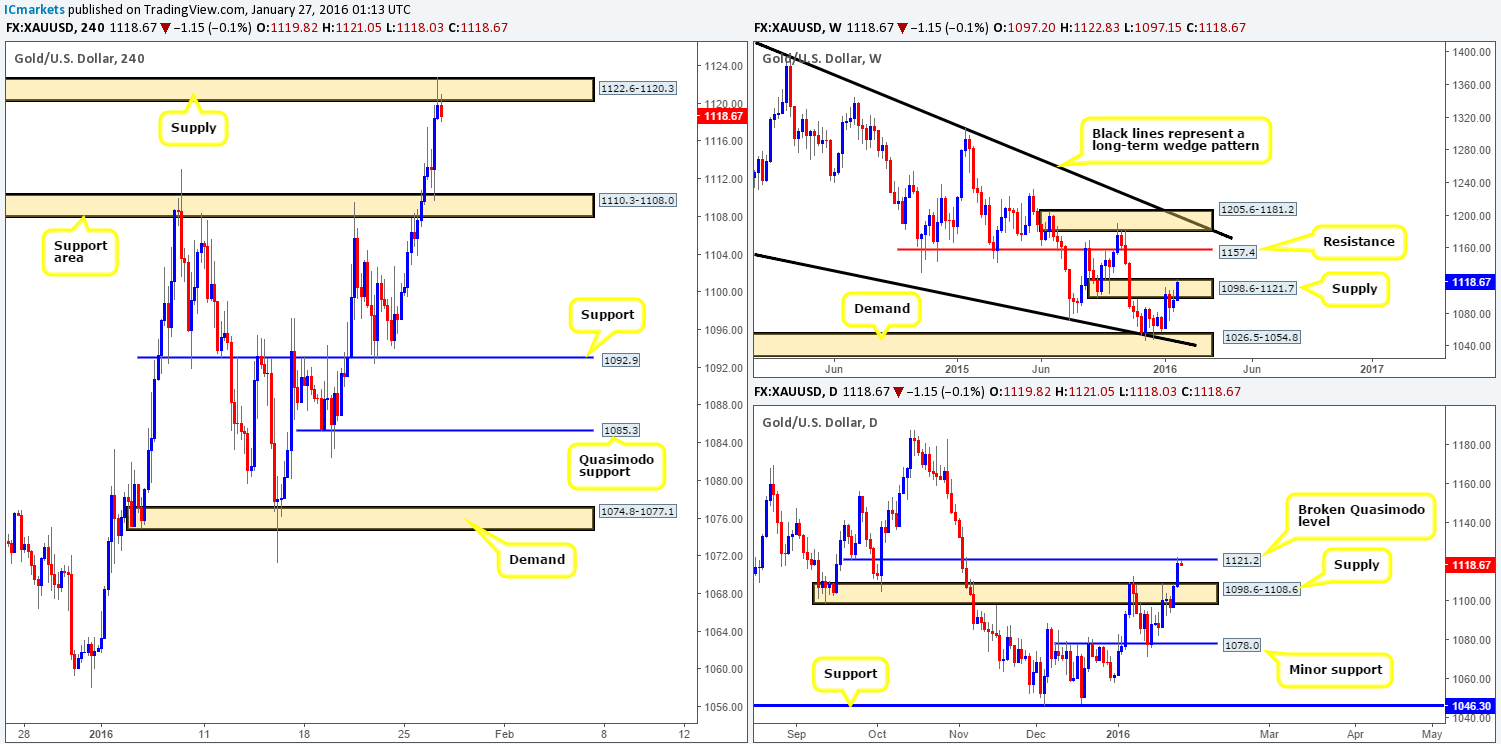
Starting from the top this morning, weekly flow is now seen trading deep within supply penciled in at 1098.6-1121.7. Any sustained move above this zone would likely place resistance drawn from 1157.4 in the limelight. Stepping down into daily action, however, we can see that price is now crossing paths with a broken Quasimodo resistance level at 1121.2, which, for the time being, appears to be holding steady.
Scrolling across to the H4 timeframe, yesterday’s trading saw the yellow metal take out the resistance area at 1110.3-1108.0 and retest it as support before advancing north to supply coming in at 1122.6-1120.3. As we can all see, Gold is currently selling-off from this region. The confluence surrounding this barrier is impressive. Not only is there a broken Daily Quasimodo line supporting this zone, but let’s not forget that price is lodged deep within a weekly supply as well (see above).
Given that we have missed the opportunity to trade this level with a pending order, we are not giving hope just yet! Should we manage to spot a lower timeframe sell setup on either the M60, M30 or even M15, we will jump in short, targeting the H4 support area drawn from 1122.6-1120.3 first and foremost.
Levels to watch/live orders:
- Buys: Flat (Stop loss: N/A).
- Sells: 1122.6-1120.3 [Tentative – confirmation required] (Stop loss: dependent on where one confirms this area).


