
EUR/USD:
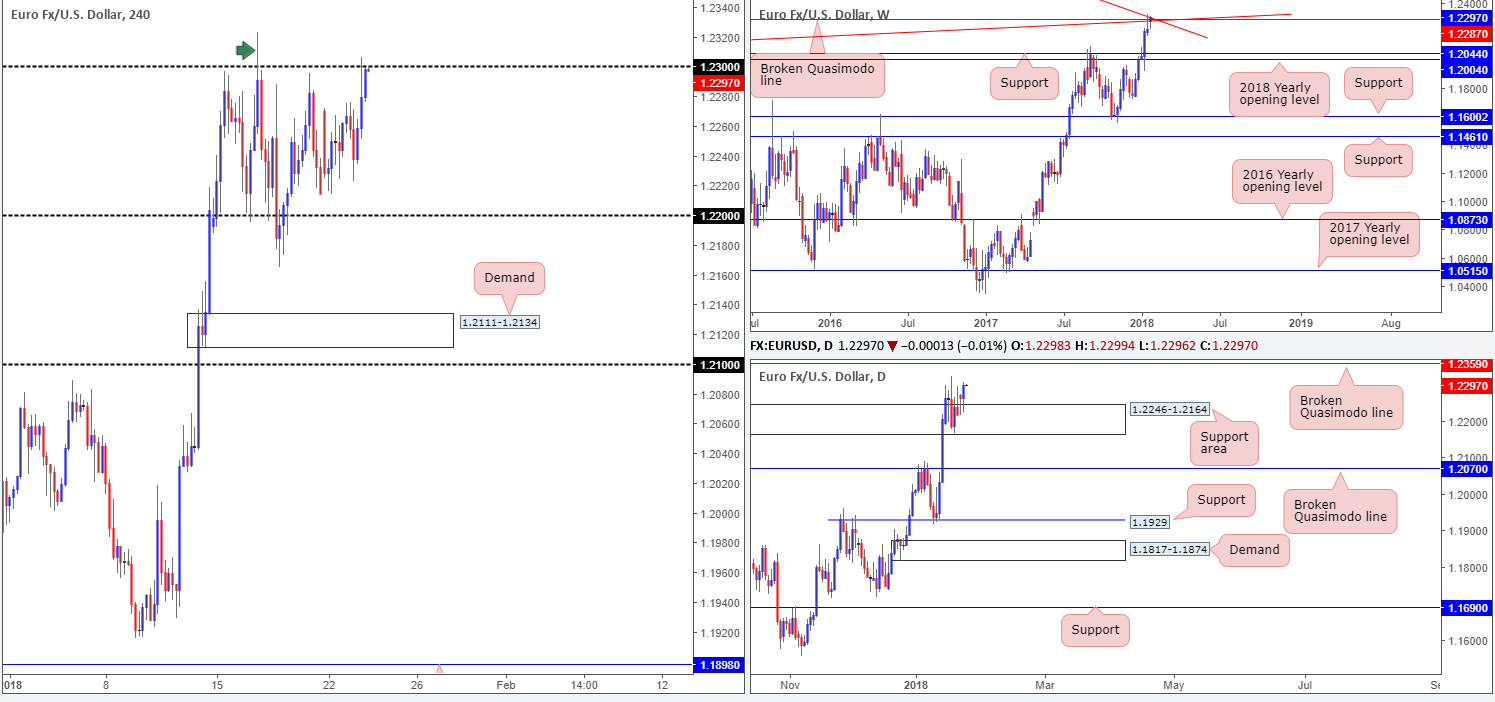
Since Jan 15, the single currency has been carving out a consolidation between the 1.22 and 1.23 handles on the H4 timeframe. Amid Tuesday’s US segment, the 1.23 line was brought back into the frame, which was followed by a mild bout of selling to lows of 1.2270 (check H1 timeframe).
A lot of traders believe 1.23 is hanging on by a thread. Although this may very well be the case due to the strong uptrend the euro is in right now along with daily action seen bouncing from a daily support area at 1.2246-1.2164, it might be worth noting that weekly price is also seen trading around a weekly broken Quasimodo line at 1.2287 that merges with two weekly trendline resistances (1.1641/1.6038).
Market direction:
1.23 is key today we believe. A strong rejection from this number will help confirm that weekly bears have not given way. A break above, however, will likely indicate that we may be heading up to a daily broken Quasimodo level printed at 1.2359 (the next upside target on the daily scale).
As we saw back on Jan 16 (green arrow), H4 price conducted a rather vicious fakeout above 1.23. Therefore, should you be looking to buy above this number if price were to break higher, you may want to consider waiting for the unit to pullback and retest 1.23 on a H4 closing basis, before pulling the trigger.
Data points to consider: Eurozone manufacturing at 8-9am; US existing home sales at 3pm GMT.
Areas worthy of attention:
Supports: 1.22 handle; 1.2246-1.2164.
Resistances: 1.2287; weekly trendline resistances; 1.23 handle; 1.2359.
GBP/USD:
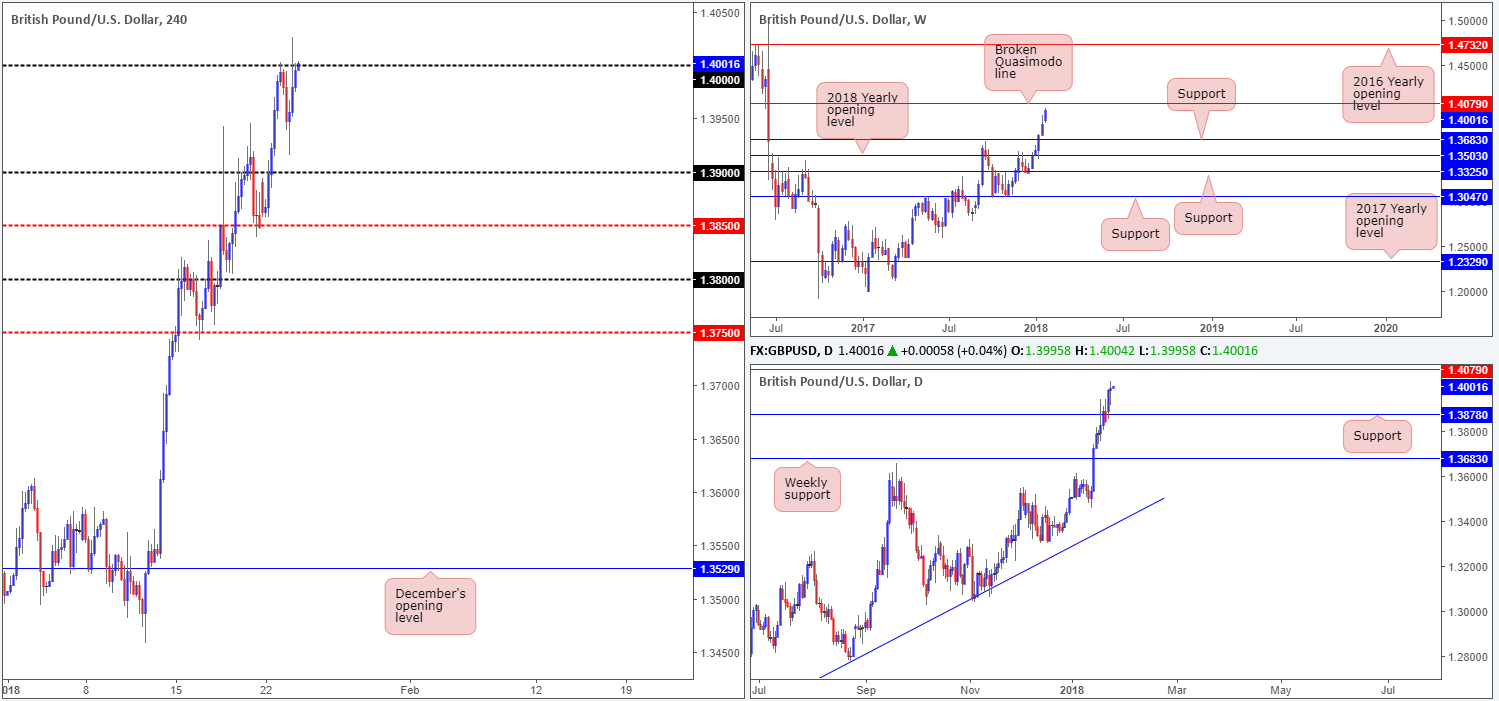
The British pound found itself grappling with the large psychological band 1.40 in early trading hours on Tuesday. What followed was a sizeable pullback during London’s morning segment, reaching as far south as 1.3915. Leaving the 1.39 handle unchallenged, however, the unit managed to reclaim earlier losses and revisit 1.40 going into the closing bell.
Both weekly and daily structures suggest that 1.40 may be on the verge of giving way. After daily action crossed above 1.3878 (now acting support), the weekly broken Quasimodo line at 1.4079 was further pushed into the spotlight as a credible upside target.
Market direction:
The 1.40 level will still potentially be a tough nut to crack given it is a watched number in this market. However, we do feel it is a case of when not if this level is taken out.
To buy above 1.40, waiting for H4 price to retest the level as support and print a full or near-full-bodied H4 bull candle may be something to consider. The reason for this is that psychological numbers tend to attract fakeouts.
Data points to consider: UK employment numbers at 9.30am; US existing home sales at 3pm GMT.
Areas worthy of attention:
Supports: 1.39 handle; 1.3878.
Resistances: 1.40 handle; 1.4079.
AUD/USD:
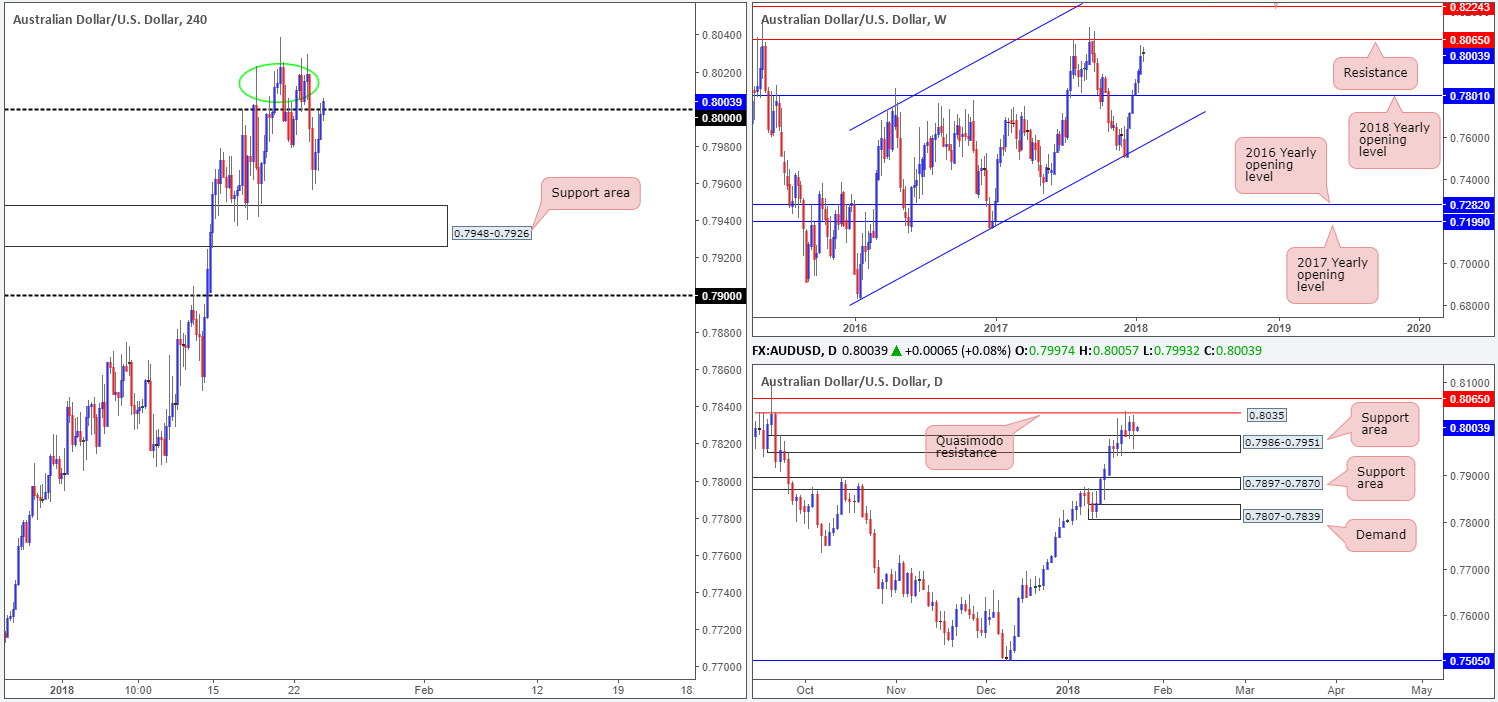
Coming at you from the top this morning, weekly action is seen trading within shouting distance of a weekly resistance level plotted at 0.8065.This is a well-established level, going back as far as early 2010. Turning our attention to the daily candles, nevertheless, price remains sandwiched between a daily Quasimodo resistance at 0.8035 and a daily support area at 0.7986-0.7951.
Over on the H4 timeframe, we can see that the large psychological level 0.80 remains in the limelight. Stop-loss orders have likely been well and truly mutilated above this number in recent days, so we don’t believe there is a whole lot of selling interest around this neighborhood for the time being.
Market direction:
While 0.80 may be weak, directly above we see a lot of wood to chop through between 0.8030/10 (circled in green). This, we believe, was caused by daily sellers from the aforementioned daily Quasimodo resistance level. Therefore, breakout buyers above 0.80 may want to prepare themselves for a bit of drawdown!
In view of how tight structure is in this market right now, opting to stand on the sidelines might be the better path to take today.
Data points to consider: US existing home sales at 3pm GMT.
Areas worthy of attention:
Supports: 0.80 handle (potentially); 0.7986-0.7951.
Resistances: 0.8065; 0.8035.
USD/JPY:
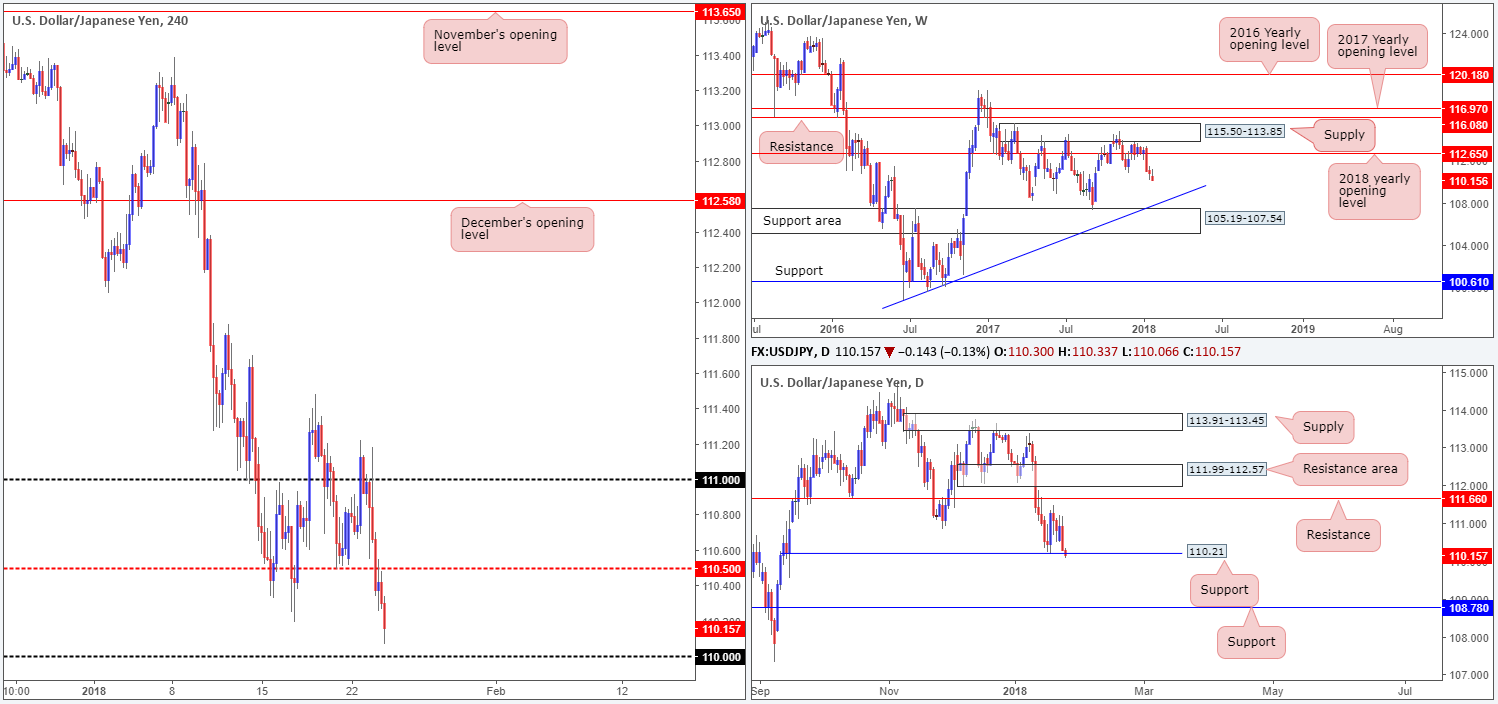
After failing to sustain gains beyond the 111 handle the USD/JPY fell sharply on Tuesday, taking out the H4 mid-level support band at 110.50 and closing out the day in the shape of a full-bodied daily bearish candle.
Directly beneath current price, the 110 handle can be seen on the H4 timeframe. Already in play, however, is the daily support level at 110.21. Over on the weekly timeframe, there’s little support seen stopping price from trading as far south as the weekly trendline support etched from the low 98.78, followed closely by a weekly support area at 105.19-107.54.
Market direction:
Selling alongside current momentum would, in our humble view, not be a high-probability move. Not only is 110 lurking nearby, one also has to contend with current buying pressure from the noted daily support. Only after a decisive H4 close is seen below 110 would we be convinced that the bears are making a play for the daily support at 108.78.
In regard to buying, we would also exercise caution. This is due to little weekly support seen in the frame, and the strength of the sellers at this time.
Data points to consider: US existing home sales at 3pm GMT.
Areas worthy of attention:
Supports: 110 handle; 110.21; 108.78; Weekly trendline support; 105.19-107.54.
Resistances: 110.50.
USD/CAD:
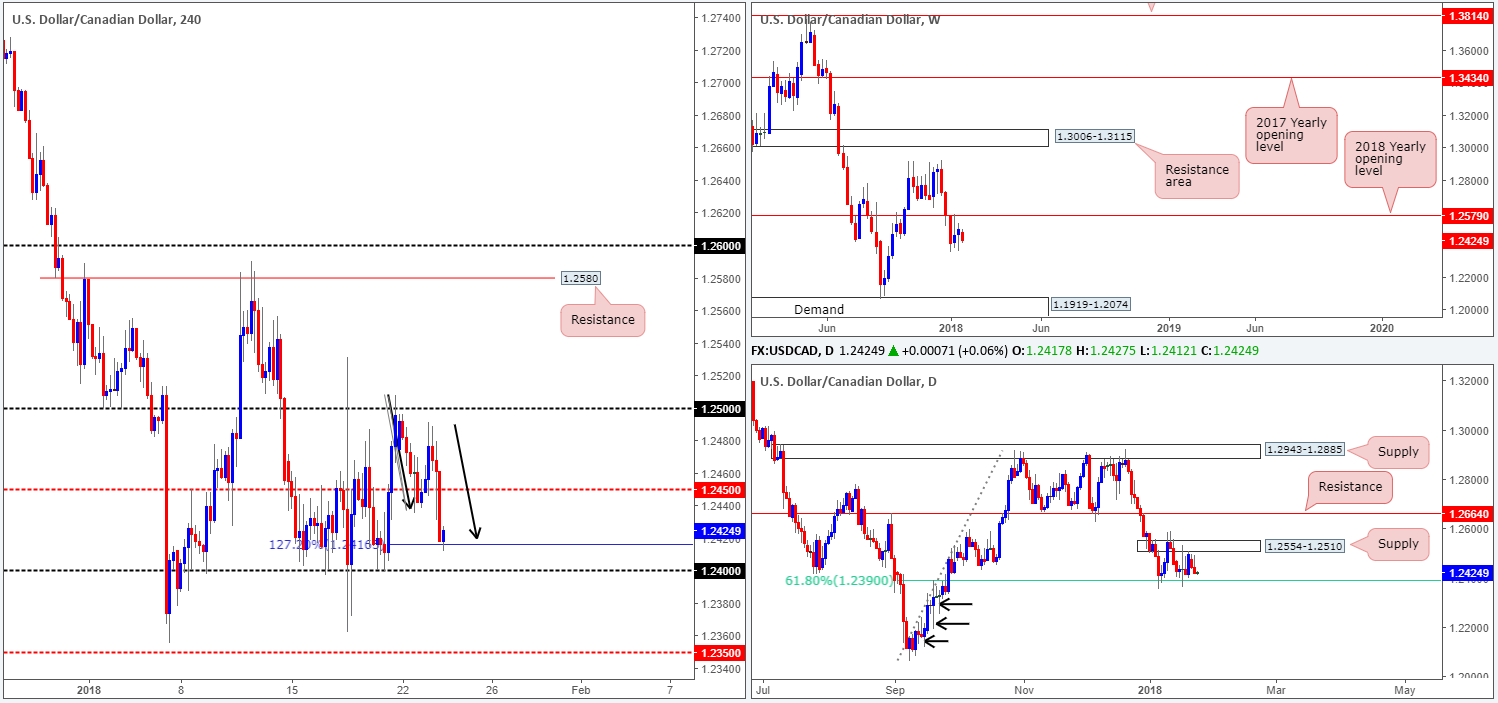
Leaving the 1.25 handle (H4 timeframe) unchallenged on Tuesday, the pair slipped below the H4 mid-level support band at 1.2450 and completed a H4 AB=CD 1:1 correction (see black arrows) at 1.2416ish (127.2% Fib ext.). Surging oil prices, coupled with the fact that the pair remains capped beneath the 2018 yearly opening level at 1.2579 and a daily supply zone pegged at 1.2554-1.2510, likely weighed on this market.
While weekly price shows that sellers have room to drag this unit as far south as weekly demand at 1.1919-1.2074, there’s a daily 61.8% Fib support at 1.2390 to take into consideration (the lower edge of the current daily range).
Market direction:
Short term, we believe that an advance is possible back up to 1.2450 from the noted 127.2% H4 Fib ext. point. However, with 1.24/1.2390 lurking just beneath this number, a fakeout is a reasonable possibility.
As for potential setups, well any that we would consider high probability that is, we do not see much to hang our hat on at the moment. Therefore, we’ll reassess as we move into Europe.
Data points to consider: US existing home sales at 3pm; US crude oil inventories at 3.30pm GMT.
Areas worthy of attention:
Supports: 1.24 handle; 1.2390; 1.2416; 1.1919-1.2074.
Resistances: 1.25 handle; 1.2450; 1.2554-1.2510.
USD/CHF:
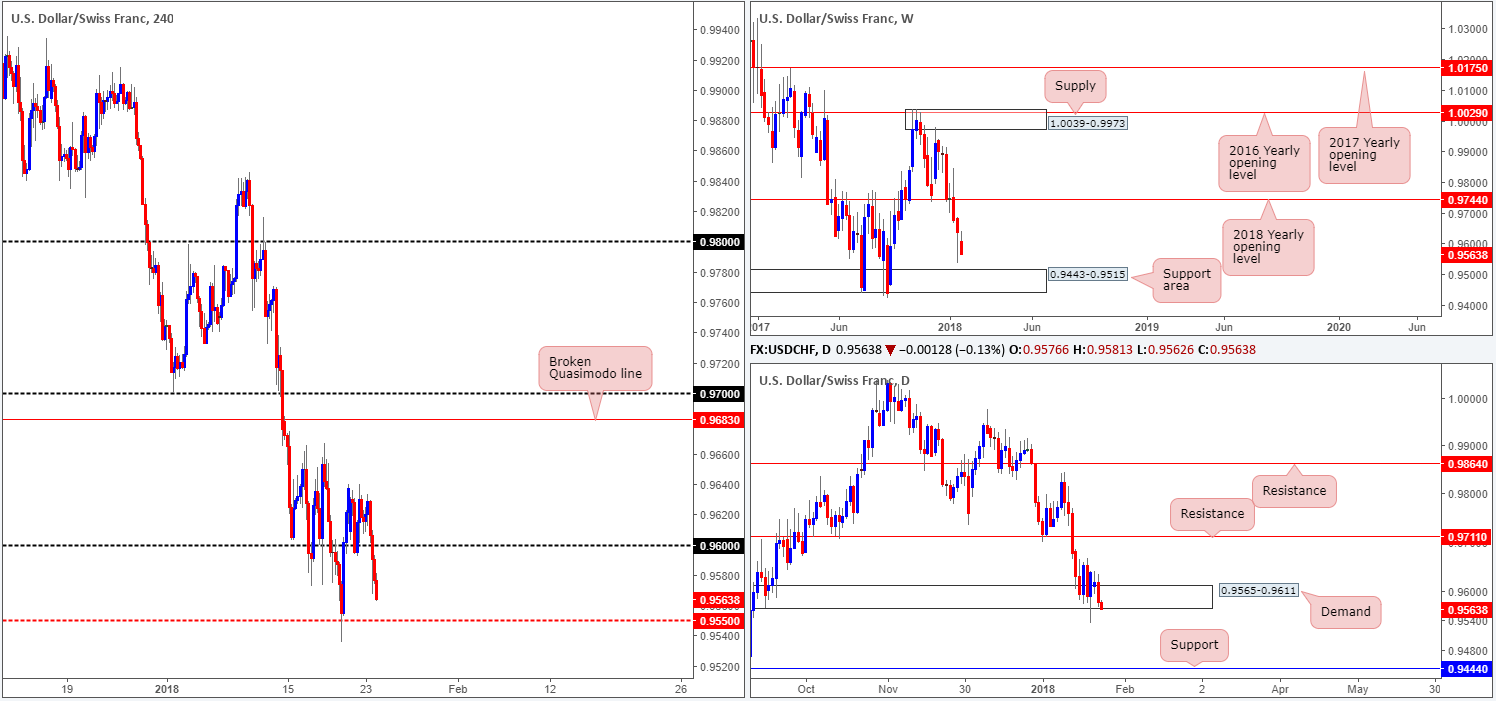
The USD/CHF continues to reflect a bearish stance on the weekly timeframe, showing room to drop as far south as the weekly support area coming in at 0.9443-0.9515.
Daily demand plotted at 0.9565-0.9611 looks as if it is ready to give way. Should a decisive move below this area take place, the next downside target on the radar is a daily support located at 0.9444. That is, of course, assuming that weekly price does not react to the aforementioned weekly support area!
Yesterday’s descent also plowed through bids around the 0.96 handle on the H4 timeframe, opening up downside to 0.9550.
Market direction:
With the dollar echoing an incredibly strong bearish vibe right now, as well as weekly price indicating further downside could be on the cards, we feel that 0.9550 will be tested, and eventually consumed. Sellers, in our view, are likely targeting the said weekly support area.
Data points to consider: US existing home sales at 3pm GMT.
Areas worthy of attention:
Supports: 0.9565-0.9611; 0.9443-0.9515; 0.9550; 0.9444.
Resistances: 0.96 handle.
DOW 30:
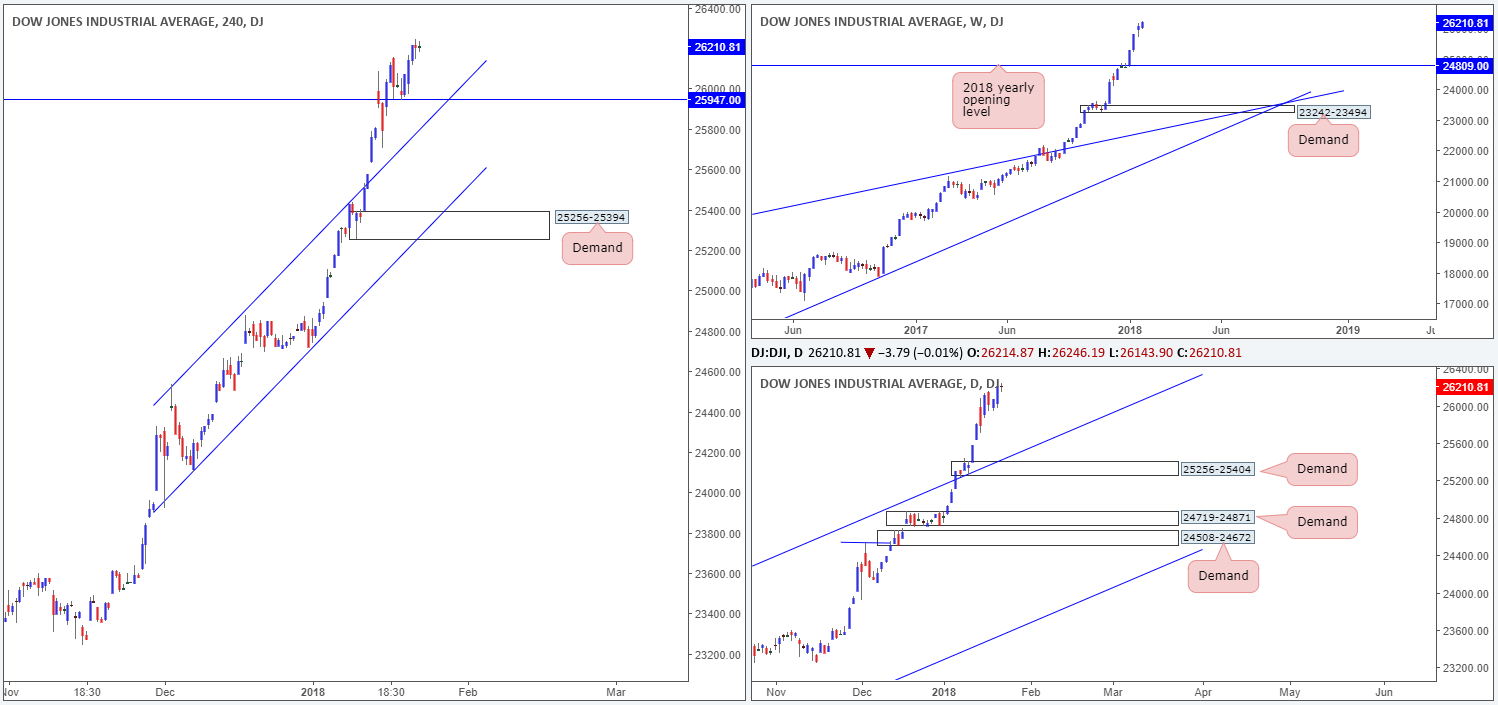
Following Monday’s advance, the US equity market, although fresh record highs of 26246 were achieved, was reasonably subdued on Tuesday, forming two back-to-back H4 indecision candles. With this being the case, much of the following report will echo thoughts put forward in Tuesday’s report…
A pullback on the weekly timeframe could see the index dip as low as the 2018 yearly opening level at 24809. The next port of support on the daily timeframe, however, can be seen in the form of a daily channel resistance-turned support extended from the high 21169. A violation of this line would open the floor to a potential test of daily demand marked at 25256-25404.
Market direction:
Further upside remains favored.
Near term, the following levels are of interest for potential buying opportunities are as follows:
- The current H4 support at 25947. Should the level be retested for a second time, watch for a H4 (candle) response off of this angle.
- The broken H4 channel resistance-turned support taken from the high 24535.
Data points to consider: US existing home sales at 3pm GMT.
Areas worthy of attention:
Supports: 25947; H4 channel support; 24809; Daily channel support; 25256-25404.
Resistances: …
GOLD:
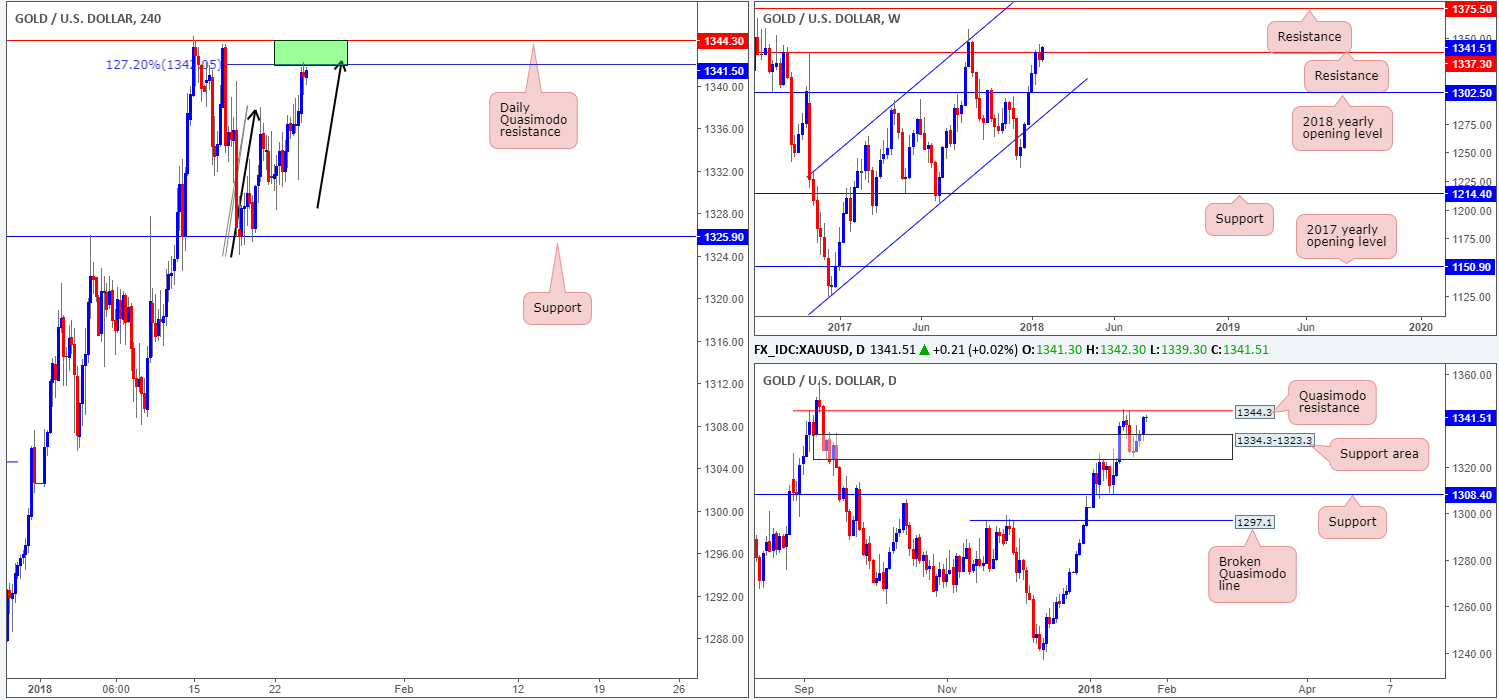
Despite the price of gold trading a tad above a weekly resistance level at 1337.3 at the moment, the H4 and daily price is seen trading at a very interesting point!
On the H4 timeframe, the yellow metal is currently working the underside of a H4 AB=CD 127.2% Fib ext. point at 1342.0. Interestingly, this level is positioned nearby a daily Quasimodo resistance level at 1344.3.
Market direction:
The 1344.3/1342.0 area is a high-probability reversal zone, in our view. Further downside from this angle could see the yellow metal trading as far south as H4 support logged at 1325.9, which happens to be located within a daily support area at 1334.3-1323.3.
Areas worthy of attention:
Supports: 1325.9; 1334.3-1323.3.
Resistances: 1344.3; 1342.0; 1337.3.
This site has been designed for informational and educational purposes only and does not constitute an offer to sell nor a solicitation of an offer to buy any products which may be referenced upon the site. The services and information provided through this site are for personal, non-commercial, educational use and display. IC Markets does not provide personal trading advice through this site and does not represent that the products or services discussed are suitable for any trader. Traders are advised not to rely on any information contained in the site in the process of making a fully informed decision.
This site may include market analysis. All ideas, opinions, and/or forecasts, expressed or implied herein, information, charts or examples contained in the lessons, are for informational and educational purposes only and should not be construed as a recommendation to invest, trade, and/or speculate in the markets. Any trades, and/or speculations made in light of the ideas, opinions, and/or forecasts, expressed or implied herein, are committed at your own risk, financial or otherwise.
The use of the site is agreement that the site is for informational and educational purposes only and does not constitute advice in any form in the furtherance of any trade or trading decisions.
The accuracy, completeness and timeliness of the information contained on this site cannot be guaranteed. IC Markets does not warranty, guarantee or make any representations, or assume any liability with regard to financial results based on the use of the information in the site.
News, views, opinions, recommendations and other information obtained from sources outside of www.icmarkets.com.au, used in this site are believed to be reliable, but we cannot guarantee their accuracy or completeness. All such information is subject to change at any time without notice. IC Markets assumes no responsibility for the content of any linked site. The fact that such links may exist does not indicate approval or endorsement of any material contained on any linked site.
IC Markets is not liable for any harm caused by the transmission, through accessing the services or information on this site, of a computer virus, or other computer code or programming device that might be used to access, delete, damage, disable, disrupt or otherwise impede in any manner, the operation of the site or of any user’s software, hardware, data or property.


