
EUR/USD:
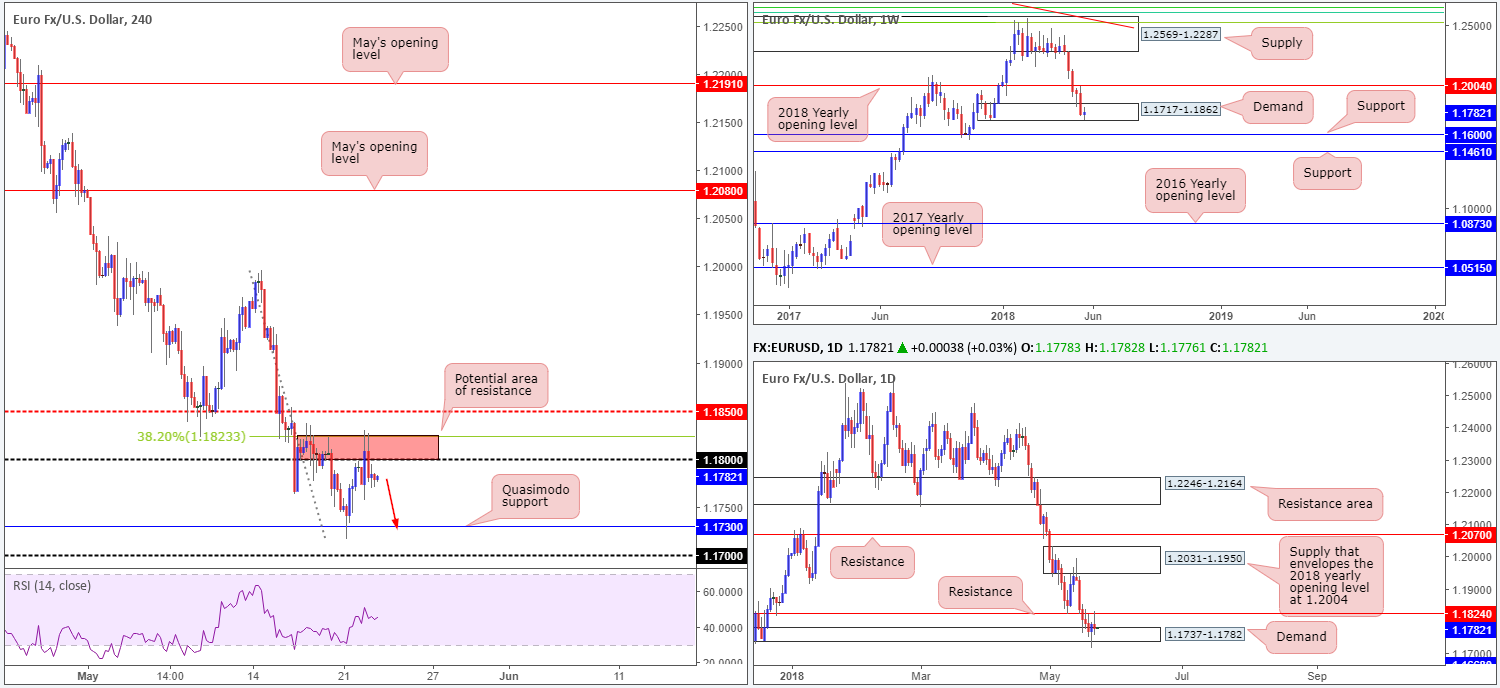
Coming from the top this morning, it’s clear that the buyers and sellers remain battling for position within the lower limit of a weekly demand base at 1.1717-1.1862. In the event that the area holds, the next port of call to the upside is seen at 1.2004: a 2018 yearly opening level. A violation of this zone, on the other hand, places the spotlight on weekly support at 1.1600.
In terms of daily movement, resistance at 1.1824, as you can see, restricted upside action on Tuesday and forced the pair to withdraw back to the top edge of daily demand printed at 1.1737-1.1782 (seen within the current weekly demand). The other key thing to note here, however, is this demand area suffered a breach on Monday, potentially tripping stop-loss orders and unlocking the pathway south toward daily support plugged in at 1.1668 (not seen on the screen).
For those who read Tuesday’s report you may recall the team highlighting the 1.1823/1.18 region marked in red on the H4 timeframe (comprised of a round number and a 38.2% H4 Fib resistance) as a potential area of resistance. In line with this, it was also noted that the area shared its space with the mentioned daily resistance level, which stood one pip above the H4 zone at 1.1824.
Areas of consideration:
Tuesday’s response from the H4 zone at 1.1823/1.18 is promising, and could lead to a move being seen towards the nearby H4 Quasimodo support at 1.1730, followed by the 1.17 handle.
A short at current price offers a 1:1 risk/reward ratio to 1.1730 should stop-loss orders be positioned above the H4 bearish rejection candle (1.1827). However, seeing as the next downside target on the daily timeframe does not come into view until we reach 1.1668, the gain could possibly extend beyond 1:1 (this is assuming that the current weekly and daily demands are taken out of the picture).
Today’s data points: Slew of Eurozone manufacturing PMIs in early London trade; FOMC meeting minutes.
GBP/USD:
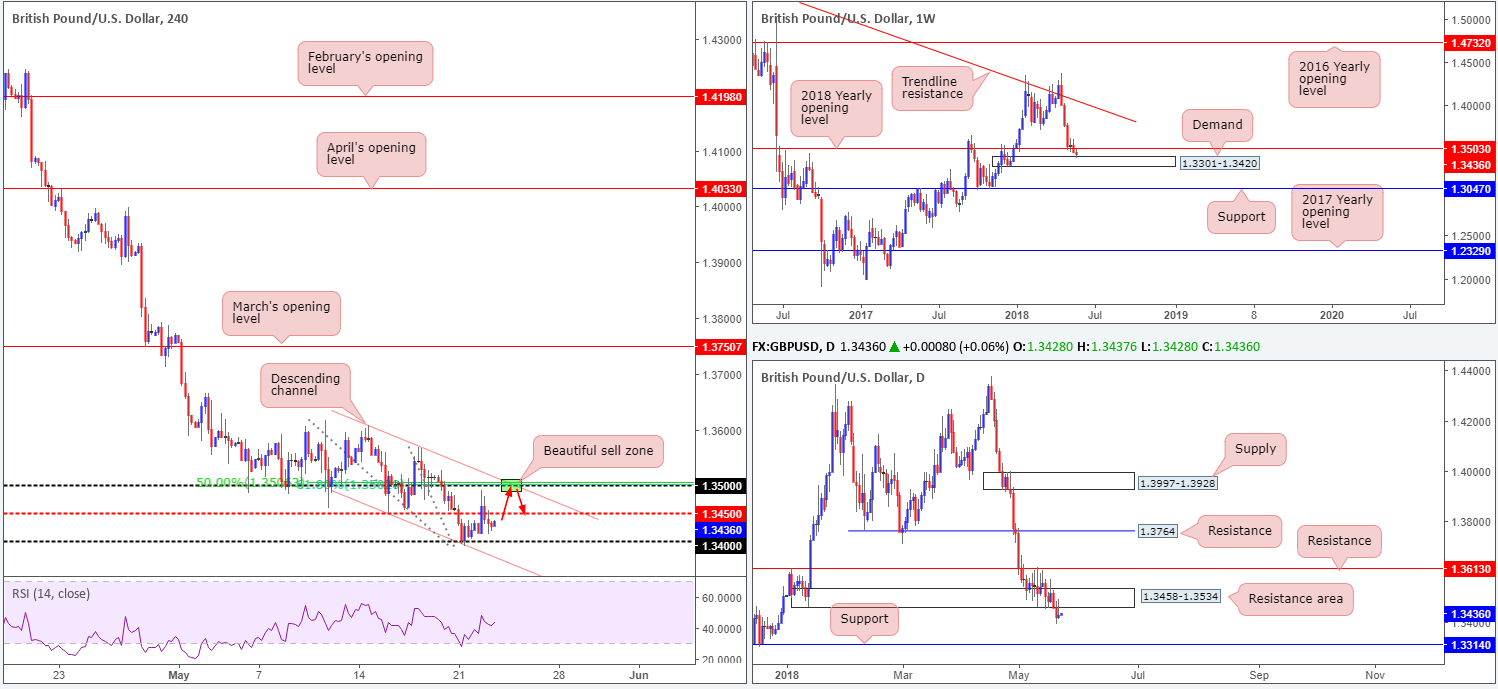
The British pound eased off after coming within shouting distance of the 1.35 handle on Tuesday and retreated sub 1.3450. Hawkish views from BoE’s Vlieghe were subsequently counterbalanced by the more neutral faction at the QIR TSC testimony, including Governor Carney, somewhat dashing hopes of an August rate hike.
From a technical standpoint, the GBP/USD is in an interesting position. Although we clearly see weekly demand at 1.3301-1.3420 in play, which could effectively rotate price and retest nearby weekly resistance at 1.3503: the 2018 yearly opening level, daily structure is penciling in a different view. Daily demand at 1.3458-1.3534 was recently engulfed in reasonably strong fashion, prompting traders to target daily support pegged at 1.3314. Adding to this, 1.3458-1.3534 is now seen acting as a resistance area. Note the clean daily bearish pin-bar formation printed during Tuesday’s trading.
Areas of consideration:
Ultimately, the 1.35 handle is still eyed here. As highlighted in Tuesday’s briefing, we like this area due to the following:
- 1.35 is a watched round number.
- 61.8% H4 Fib resistance value aligning with 1.35.
- 50.0% H4 resistance value at 1.3506.
- H4 channel resistance taken from the high 1.3608 converges nicely with 1.35.
- Seen positioned within the walls of the daily resistance area at 1.3458-1.3534.
- Positioned just three pips beneath the 2018 yearly opening level mentioned above on the weekly timeframe.
In regard to stop-loss orders, above the top edge of the current daily resistance area appears to be the safest location (1.3534). As for the first take-profit target, eyes will likely be on 1.3450 on the H4 timeframe.
Next independent focus for the Pound is UK CPI.
Today’s data points: UK inflation figures; FOMC meeting minutes.
AUD/USD:
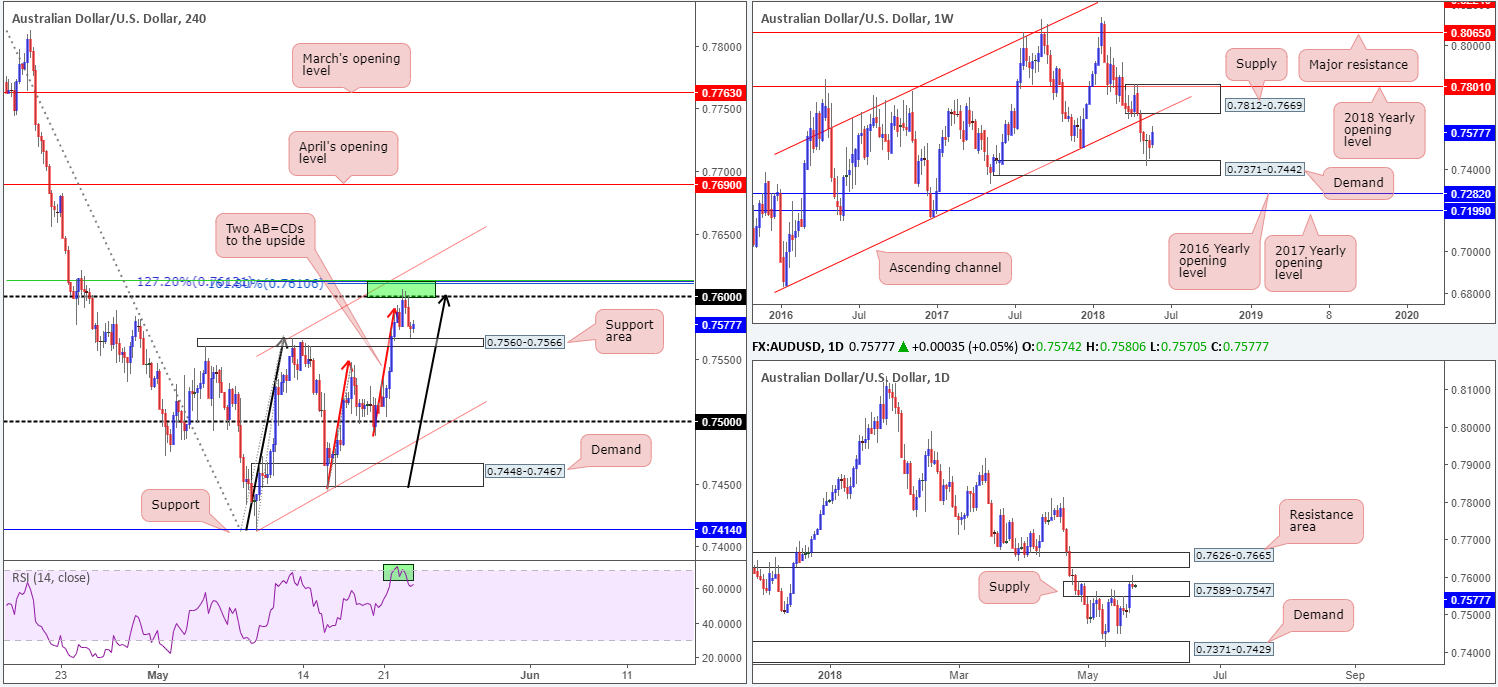
For those who read Tuesday’s technical report you may recall that the team underlined a particularly interesting base of resistance on the H4 timeframe at 0.7613/0.76, comprised of the following structures:
- Round number 0.76.
- H4 50.0% resistance value at 0.7613.
- Two H4 AB=CD formations that complete nicely around the 0.7610 point (see red and black arrows).
- Nearby H4 channel resistance taken from the high 0.7566.
As you can see, price responded beautifully to the noted zone and has since tested an area of H4 support coming in at 0.7560-0.7566. Well done to those who managed to jump aboard this train!
Moving forward, weekly price continues to show potential to advance higher until we reach weekly supply penciled in at 0.7812-0.7669, which happens to intersect with a weekly channel support-turned resistance taken from the low 0.6827. Meanwhile, daily flow penciled in a nice-looking daily bearish pin-bar formation that pierced through the top edge of daily supply at 0.7589-0.7547.
Areas of consideration:
A H4 close beneath the current H4 support area would be a welcomed sight for those currently short, as this would expose the 0.75 handle. While a move lower is somewhat supported by recent daily structure, we cannot overlook weekly direction. Therefore, unless we witness a clean H4 close below 0.7560-0.7566 (preferable to wait for the retest), shorting this market is not something we’d label high probability.
Today’s data points: AUD Construction work done q/q; RBA Gov. Lowe speaks; FOMC meeting minutes.
USD/JPY:
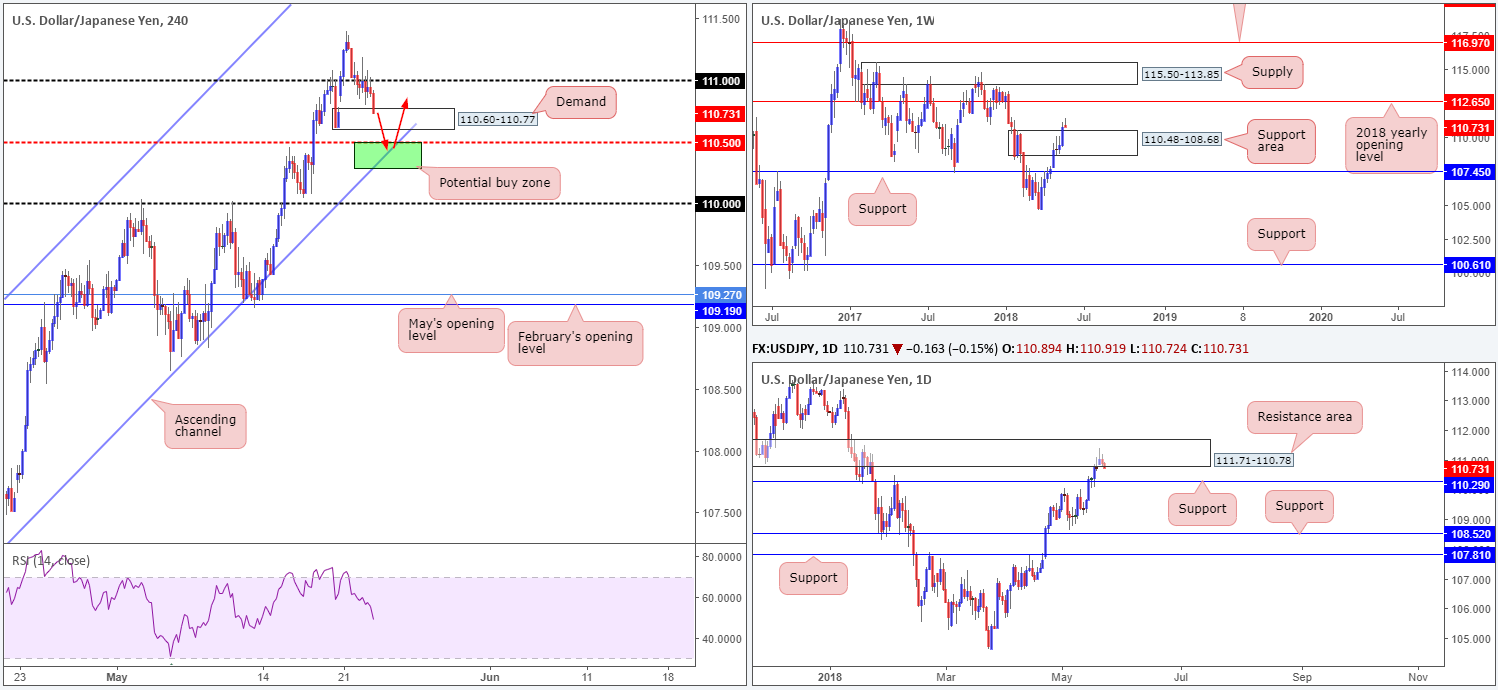
USD/JPY movement was somewhat subdued amid Tuesday’s segment, seemingly taking cues from US Treasury yields. As is evident from the H4 timeframe, the candles spent the day hugging the underside of the 111 handle. In recent hours, though, the pair has dropped to test nearby H4 demand placed at 110.60-110.77. In the event that the sellers remain in control, the next area of interest stands at 110.50: a H4 mid-level support that intersects closely with a H4 channel support extended from the low 104.62.
On the weekly timeframe, there’s room seen for the pair to rally as far north as the 2018 yearly opening level at 112.65. Before this occurs, though, a retest of the recently broken weekly supply (now acting support area) at 110.48-108.68 could be seen. On the other side of the spectrum, daily price is seen interacting with a resistance area formed at 111.71-110.78. A move lower from here has the daily support at 110.29 to target.
Areas of consideration:
Having seen that weekly price could potentially retest the top edge of a weekly support area mentioned above at 110.48, and daily action underlining its next support target at 110.29, the current H4 demand is likely to give way.
With that being the case, possible buying opportunities may exist between the 110.29/110.50ish zone, as marked in green on the H4 chart. To be on the safe side, nevertheless, we would strongly recommend waiting for H4 price to pencil in a full or near-full-bodied bull candle out of the said buy zone. This will help avoid being stopped out on any attempt to fake lower and bring in the 110 handle.
Today’s data points: FOMC meeting minutes.
USD/CAD:
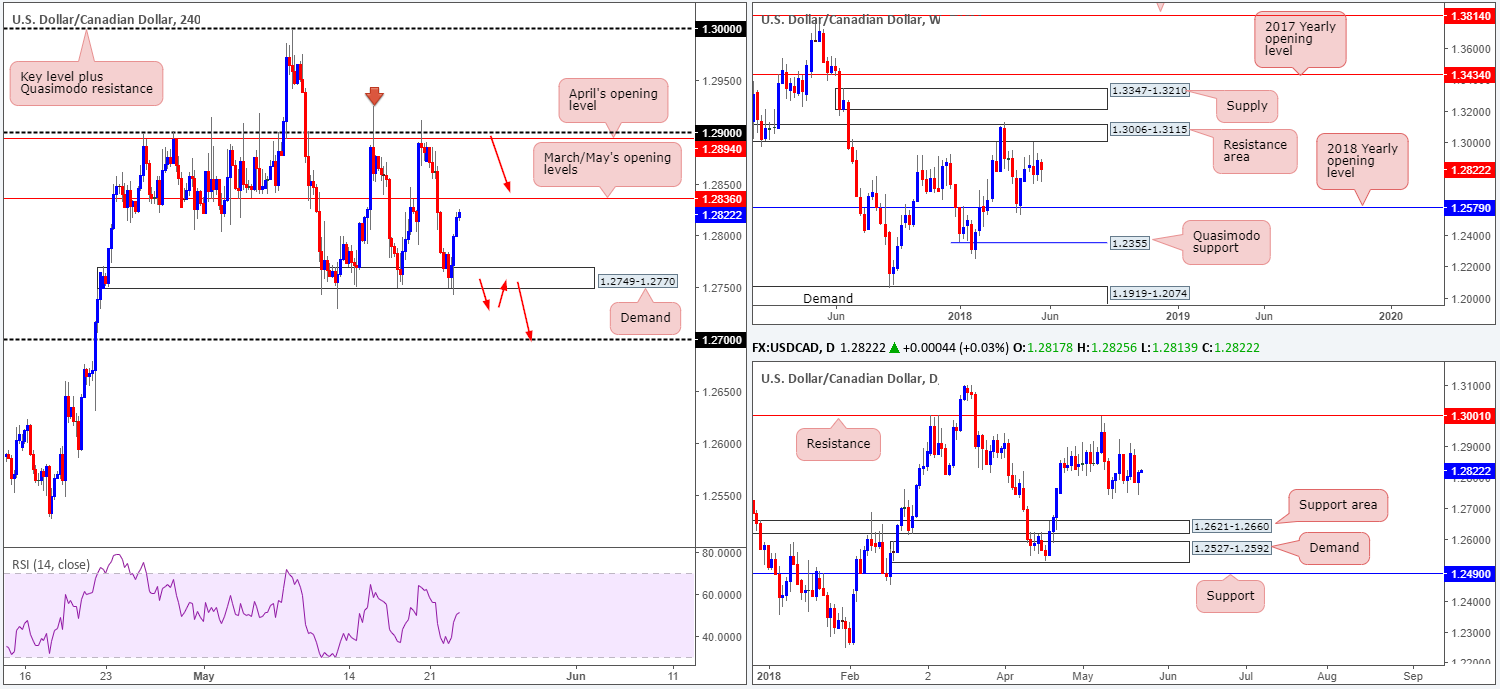
Since May 10, this market has been carving out a reasonably well-defined range between H4 demand at 1.2749-1.2770 and the 1.29 handle. It’s also worth noting that seen within this range is March/May’s opening levels at 1.2836.
Despite the ranging motion seen on the H4 scale, weekly price continues to reflect a bearish stance. After coming within inches of tapping the underside of a weekly resistance area at 1.3006-1.3115 two weeks ago, further selling is possible at least until the 2018 yearly opening level at 1.2579. In conjunction with weekly flow, daily movement also shows room to press lower, with the next downside target not coming into view until we reach a daily support area noted at 1.2621-1.2660.
Areas of consideration:
Although the higher-timeframe picture suggests further selling could be on the cards, selling this market knowing that H4 price is confined within a range is challenging. With that in mind, we see two options going forward (as per the red arrows):
- Should H4 price close beneath the current H4 demand area and follow up with a successful retest as resistance, then shorts are high probability, targeting the 1.27 handle as the initial take-profit zone, followed by the daily support area at 1.2621-1.2660.
- If H4 price tests the top edge of its current range (1.29) shorts from this region would be interesting. Stop-loss orders would, as far as we can see, be best placed above the high marked with a red arrow at 1.2924. And, as for take-profit targets, the first port of call would be March/May’s opening levels at 1.2836, followed then by the lower edge of the range: the aforementioned H4 demand.
Today’s data points: Crude oil inventories; FOMC meeting minutes.
USD/CHF:
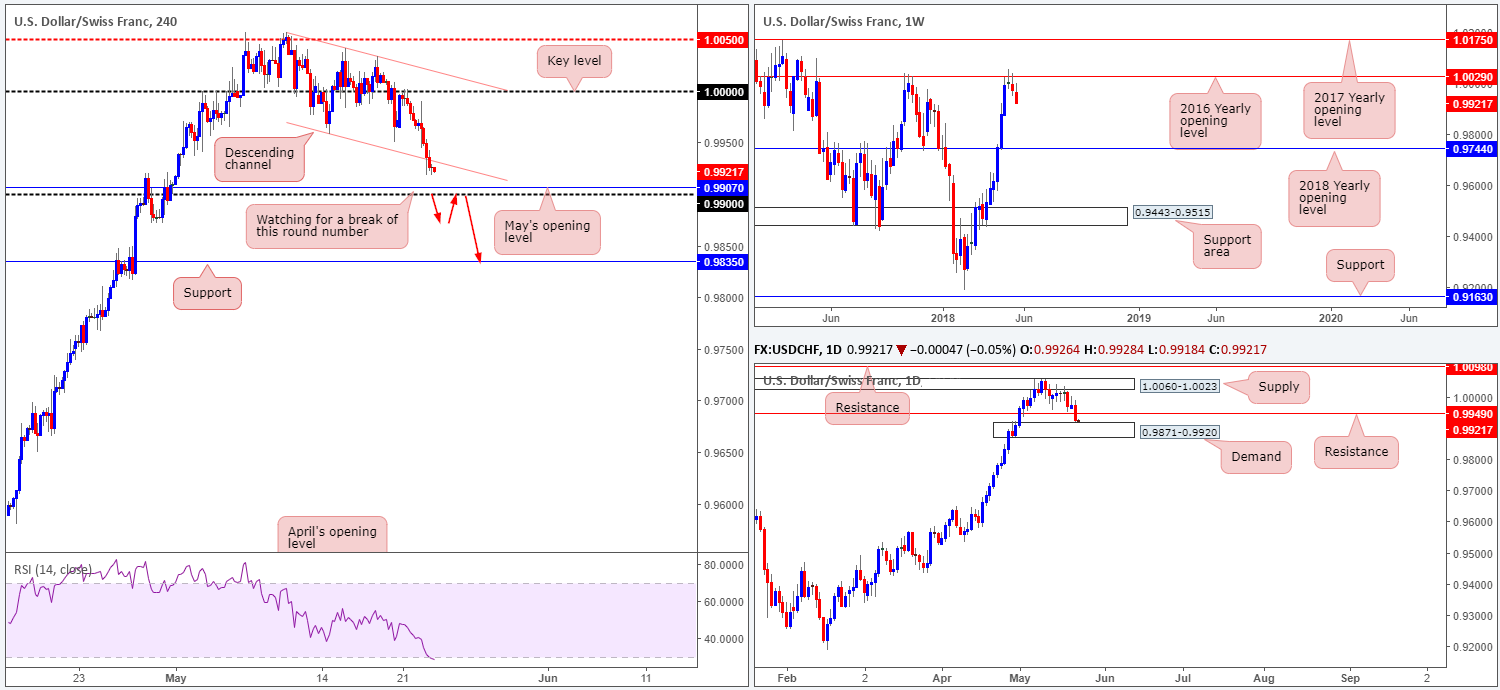
The US dollar came under pressure against its Swiss counterpart on Tuesday, following Monday’s retest of parity (1.0000). As you can see, the move forced H4 price to engage and eventually break the H4 channel support taken from the low 0.9957, which has consequently exposed May’s opening level at 0.9907, shadowed closely by the 0.99 handle.
Thanks to yesterday’s bout of selling, the pair also now finds itself interacting with a daily demand area drawn from 0.9871-0.9920, after breaking through daily support at 0.9949 (now acting resistance). Weekly flow, on the other hand, echoes a clear bearish tone at present. Following a test of the 2016 yearly opening level at 1.0029 two weeks back, price action shows little support on the horizon until connecting with the 2018 yearly opening level marked at 0.9744.
Areas of consideration:
Engaging in sell trades at current price would leave one little room to protect their position. As highlighted above, nearby we have H4 support in the form of May’s opening level at 0.9907, shadowed closely by the 0.99 handle. On top of this, shorts have to contend with daily demand planted at 0.9871-0.9920.
Should H4 price cross below 0.99, we feel this would be a strong enough cue to begin considering shorts. Yes, price would still be engaged with daily demand, but overhead pressure from weekly sellers should be enough to overcome buying around this zone. Therefore, keep eyes out for a H4 close below 0.99 that’s followed up with a retest as resistance. The first take-profit target from this point falls in around H4 support noted at 0.9835.
Today’s data points: FOMC meeting minutes.
Dow Jones Industrial Average:
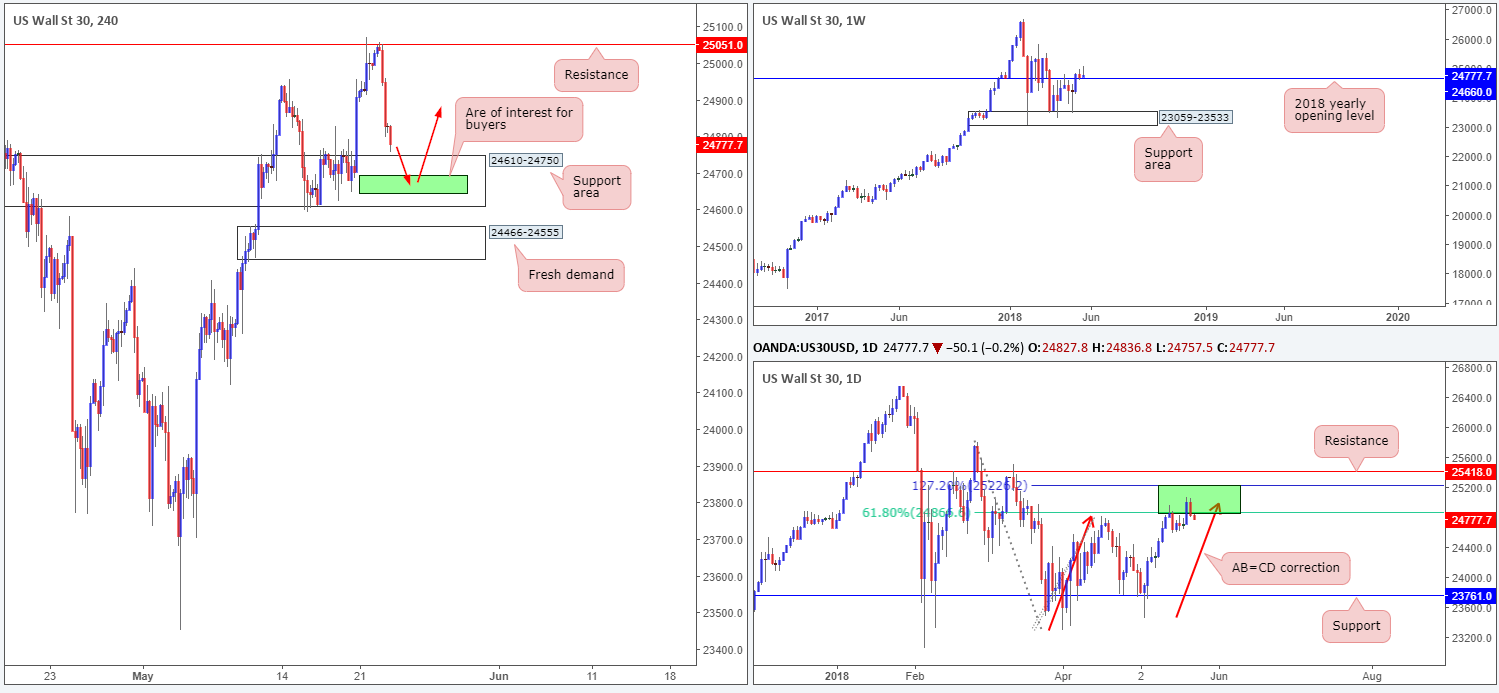
Using a top-down approach this morning, we can see that the DJIA continues to hover above the 2018 yearly opening level on the weekly timeframe at 24660. As of current price, weekly action has yet to produce anything meaningful to the upside from here. Moving our way down to the daily timeframe, price is seen shaking hands with a particularly interesting area of resistance drawn from 25229/24866. The area marked in green is comprised of a 61.8% daily Fib resistance value and a 127.2% AB=CD (see red arrows) daily Fib ext. point.
Across on the H4 timeframe, the sellers are currently flexing their financial muscle. Driving aggressively lower after testing H4 resistance at 25051, the index is now seen trading within touching distance of a H4 support area coming in at 24610-24750. A violation of this zone has a nearby fresh H4 demand at 24466-24555 to target.
Areas of consideration:
The selling pressure seen on the H4 timeframe is likely due to where we’re coming from on the daily timeframe. A reaction from the H4 support area, though, is expected since within these walls sits the 2018 yearly opening level mentioned above at 24660. Therefore, today’s spotlight will firmly be focused on the green zone marked within the H4 support area between 24644/24694. A H4 full or near-full-bodied bull candle printed from here would, in our opinion, be enough evidence to suggest a move higher, which could bring daily price up to within the top edge of its current base of resistance at 25229/24866.
Today’s data points: FOMC meeting minutes.
GOLD (XAU/USD)
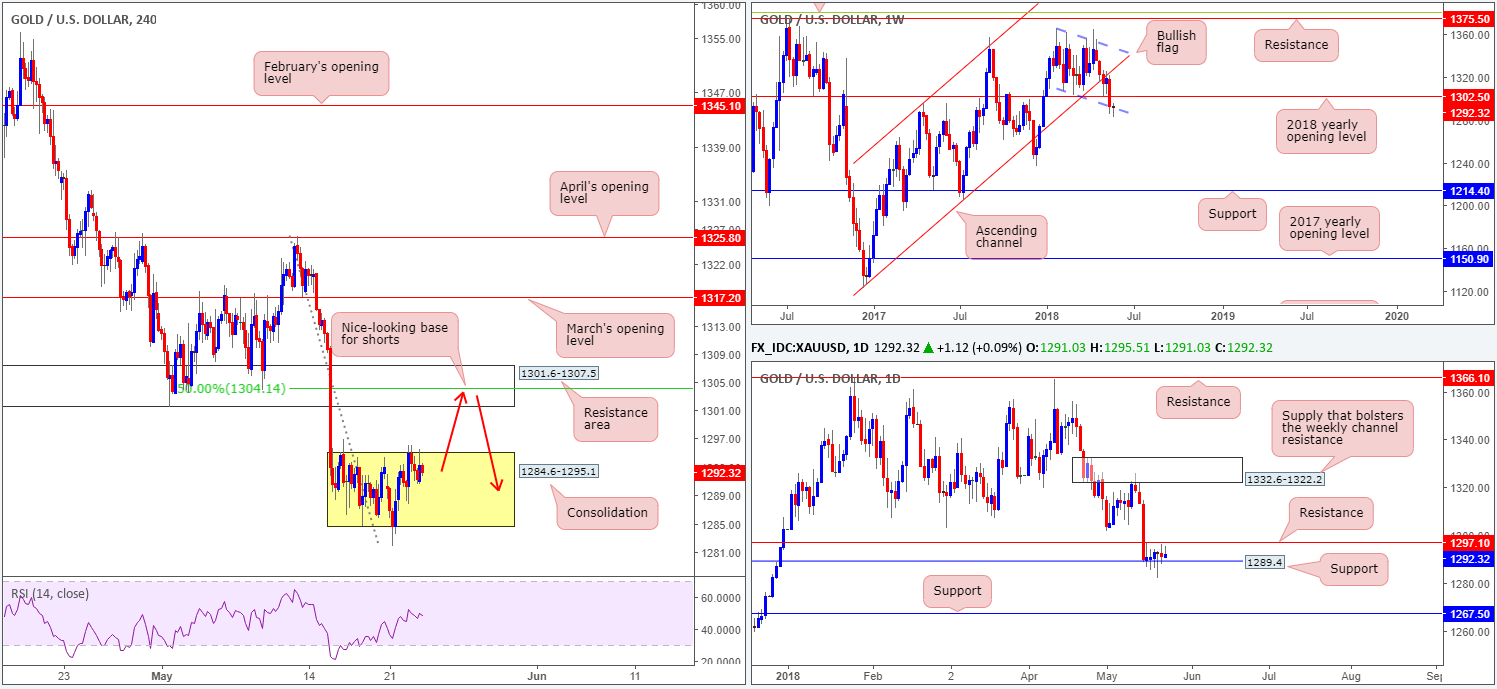
As can be seen from the H4 timeframe this morning, the yellow metal remains in a range bound state between 1284.6/1295.1. A break higher has the H4 resistance zone to target at 1301.6-1307.5, whereas a move lower could potentially expose December’s 2017 opening level at 1274.8 (not seen on the screen).
Expanding the view, we can see that daily price remains lodged between a daily support level drawn from 1289.4 and a daily resistance level priced in at 1297.1. A move lower from here could open up the gates for price to challenge daily support seen at 1267.5. Looking over the weekly chart shows us that price is respecting the lower edge of a weekly bullish flag formation taken from the low 1307.2, despite pushing to lows of 1282.2. Further buying from this point could see the 2018 yearly opening level at 1302.5 brought into play.
Areas of consideration:
We really like the current H4 resistance area for shorts. Why this is simply comes down to the area fusing with the aforementioned 2018 yearly opening level, a nearby daily resistance level at 1297.1 and a 50.0% H4 resistance value at 1304.1. The first take-profit area from this point can be seen around the top edge of the current H4 range at 1295.1.
The use of the site is agreement that the site is for informational and educational purposes only and does not constitute advice in any form in the furtherance of any trade or trading decisions.
The accuracy, completeness and timeliness of the information contained on this site cannot be guaranteed. IC Markets does not warranty, guarantee or make any representations, or assume any liability with regard to financial results based on the use of the information in the site.
News, views, opinions, recommendations and other information obtained from sources outside of www.icmarkets.com.au, used in this site are believed to be reliable, but we cannot guarantee their accuracy or completeness. All such information is subject to change at any time without notice. IC Markets assumes no responsibility for the content of any linked site. The fact that such links may exist does not indicate approval or endorsement of any material contained on any linked site.
IC Markets is not liable for any harm caused by the transmission, through accessing the services or information on this site, of a computer virus, or other computer code or programming device that might be used to access, delete, damage, disable, disrupt or otherwise impede in any manner, the operation of the site or of any user’s software, hardware, data or property.


