
A note on lower timeframe confirming price action…
Waiting for lower timeframe confirmation is our main tool to confirm strength within higher timeframe zones, and has really been the key to our trading success. It takes a little time to understand the subtle nuances, however, as each trade is never the same, but once you master the rhythm so to speak, you will be saved from countless unnecessary losing trades. The following is a list of what we look for:
- A break/retest of supply or demand dependent on which way you’re trading.
- A trendline break/retest.
- Buying/selling tails – essentially we look for a cluster of very obvious spikes off of lower timeframe support and resistance levels within the higher timeframe zone.
- Candlestick patterns. We tend to only stick with pin bars and engulfing bars as these have proven to be the most effective.
For us, lower timeframe confirmation starts on the M15 and finishes up on the H1, since most of our higher timeframe areas begin with the H4.
Traders may want to bear in mind that market conditions will likely be thin going forward. Unwarranted and sudden moves could be seen so remain vigilant at all times.
EUR/USD:
The EUR is seen trading markedly higher this morning. A steady flow of bids came into this market two pips from above psychological support 1.0900 going into London trade. This recent surge in buying took out offers from both a H4 swap resistance (now support) level at 1.0936 (also seen clearly on the daily timeframe) and mid-level resistance 1.0950, which, as you can see, is now being retested as support.
This – coupled with the EUR trading from a weekly range demand at 1.0519-1.0798, and daily action showing room to continue appreciating up to supply seen at 1.1072-1.1013 (converges with the 61.8% Fibonacci level at 1.1007), makes the 1.0950/1.0936 (pink circle) H4 area a high-probability turning point.
As such, our plan of attack today will consist of looking for lower timeframe buy entries around this H4 support area, targeting the large psychological resistance 1.1000 (hangs just below the above said daily supply area).
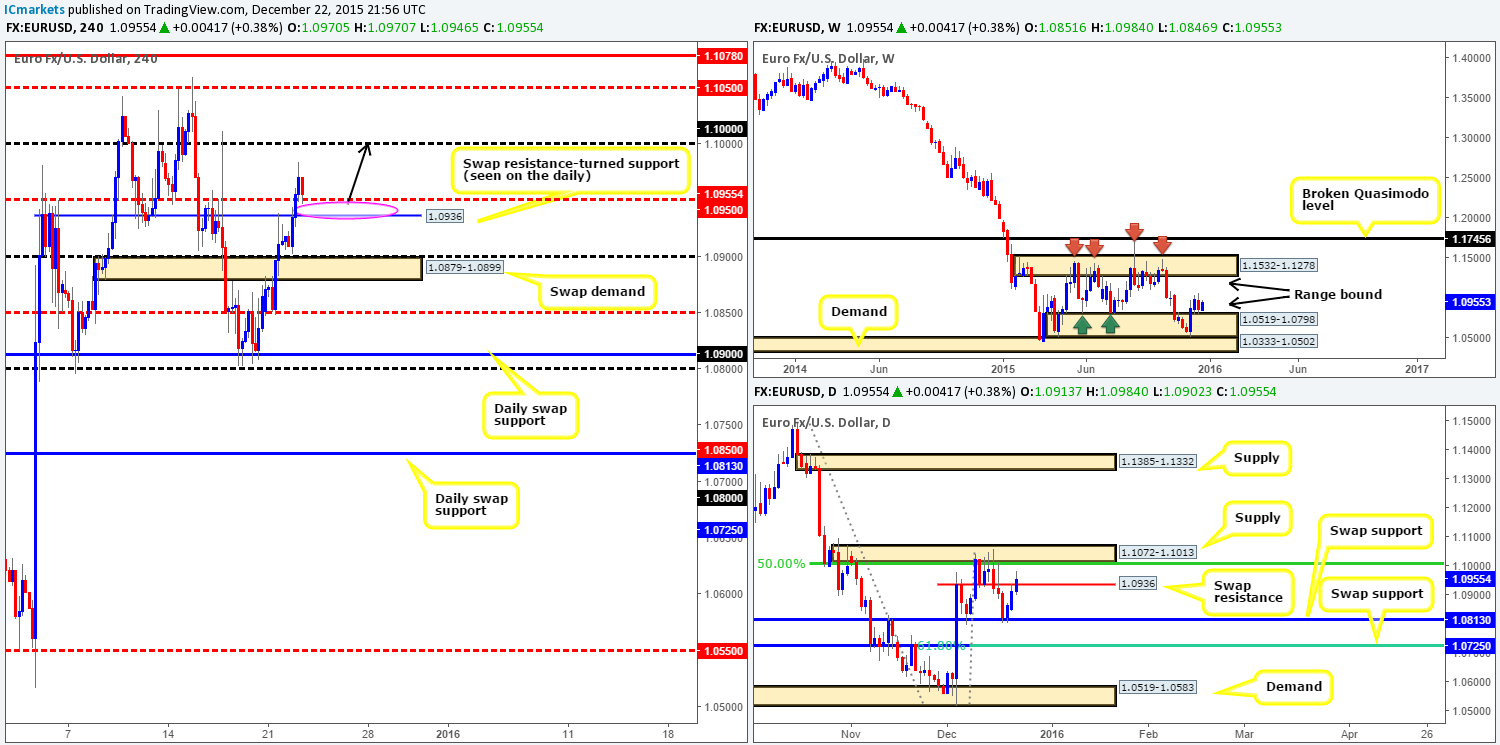
Levels to watch/live orders:
- Buys: 1.0950/1.0936 [Tentative – confirmation required] (Stop loss: dependent on where one confirms this area).
- Sells: Flat (Stop loss: N/A).
GBP/USD:
As can be seen from all three timeframes (weekly/daily/h4) on the GBP, the sell-side of this market continues to weigh down on this pair. Weekly demand (now potentially supply) at 1.4856-1.5052 was taken out and the path possibly cleared for further selling down to a weekly Quasimodo support at 1.4633. Daily demand (now supply) was also consumed yesterday, likely opening the gates for prices to challenge a daily Quasimodo support at 1.4739. Down on the H4, nonetheless, price stabbed below demand coming in at 1.4811-1.4854, missing psychological support 1.4800 by five pips before printing a bullish pin bar.
With both the weekly and daily charts indicating Cable could sustain further losses, we’re not going to be looking to buy into the current H4 buying tail (pin bar). Instead, what we’re interested in is shorts from either the mid-level resistance 1.4850 or the H4 supply above it at 1.4907-1.4886. Here’s why: Stops (sell stops) have likely been taken out below the current H4 demand. This, in turn, has potentially cleared the runway south to at least 1.4800. Therefore, if price rallies and connects with either 1.4850/1.4907-1.4886, we’d feel confident (knowing the situation on the higher timeframe structures [see above]) to begin looking for lower timeframe confirmed entries into this market targeting 1.4800 first and foremost.
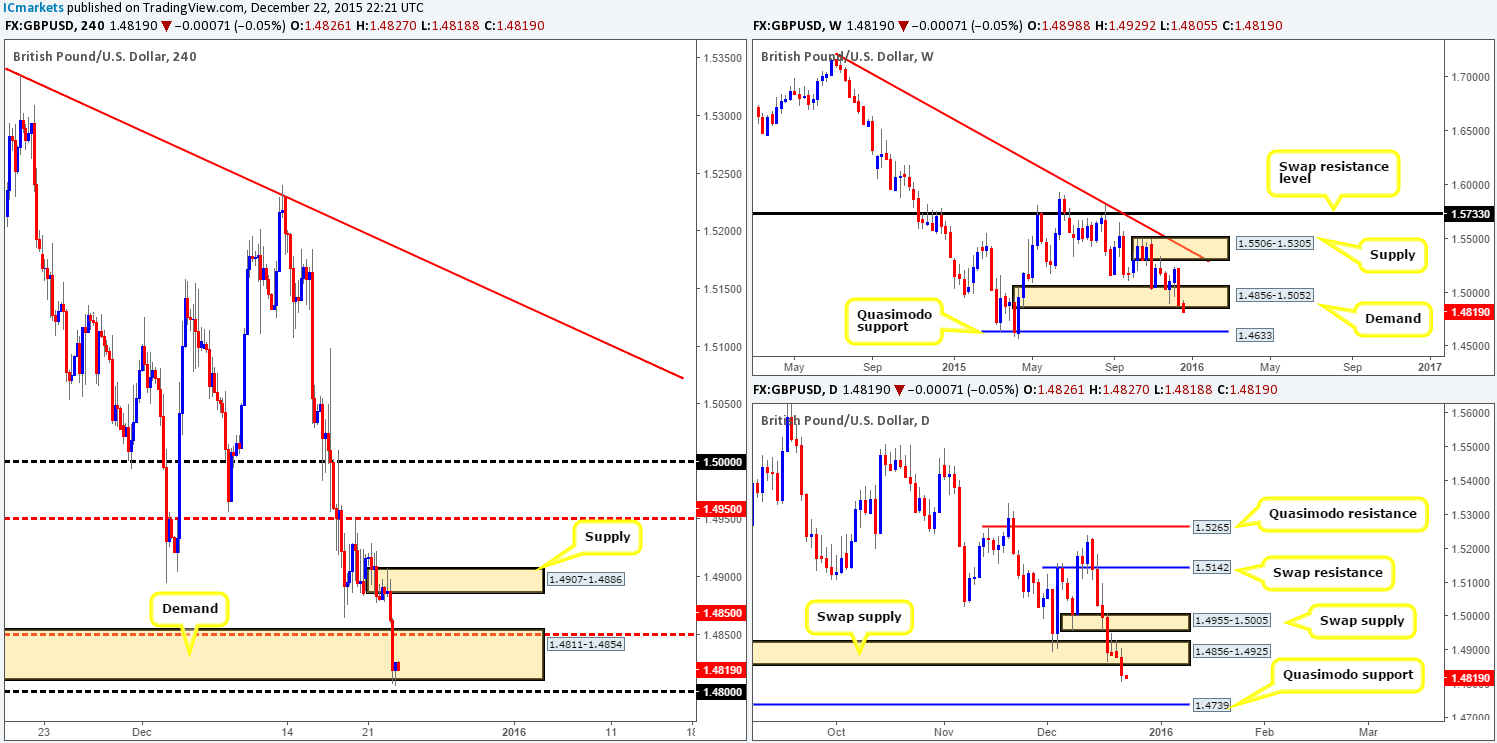
Levels to watch/ live orders:
- Buys: Flat (Stop loss: N/A).
- Sells: 1.4850 [Tentative – confirmation required] (Stop loss: dependent on where one confirms this level). 1.4907-1.4886 [Tentative – confirmation required] (Stop loss: dependent on where one confirms this area).
AUD/USD:
Early on in yesterday’s sessions, the Aussie blasted through psychological resistance 0.7200, not even slowing down to retest this barrier as support before reaching the underside of the H4 mid-level resistance at 0.7250. The bulls are certainly on top form this Christmas week, with this being the third consecutive (daily) close higher!
With 0.7250 currently holding this pair lower, how do things stand on the higher timeframes? Well, both the weekly and daily charts show room for this market to continue appreciating – the closest structural resistance can be seen on the daily chart at 0.7269 – a swap resistance level. On account of this, despite resistance being seen on the H4 timeframe right now, selling, at least for us, is out of the question until we see price reach the daily level just mentioned above. Regarding longs, however, we have our eye on psychological support 0.7200 as there are likely unfilled buy orders still lurking within this region. Failing that, H4 demand below it at 0.7155-0.7171 (sits neatly on top of the daily swap [resistance] level at 0.7159) would be our next port of call for longs.
Due to liquidity likely thinning out during the Christmas period, we would strongly advise only trading the above said H4 barriers with lower timeframe confirmation.
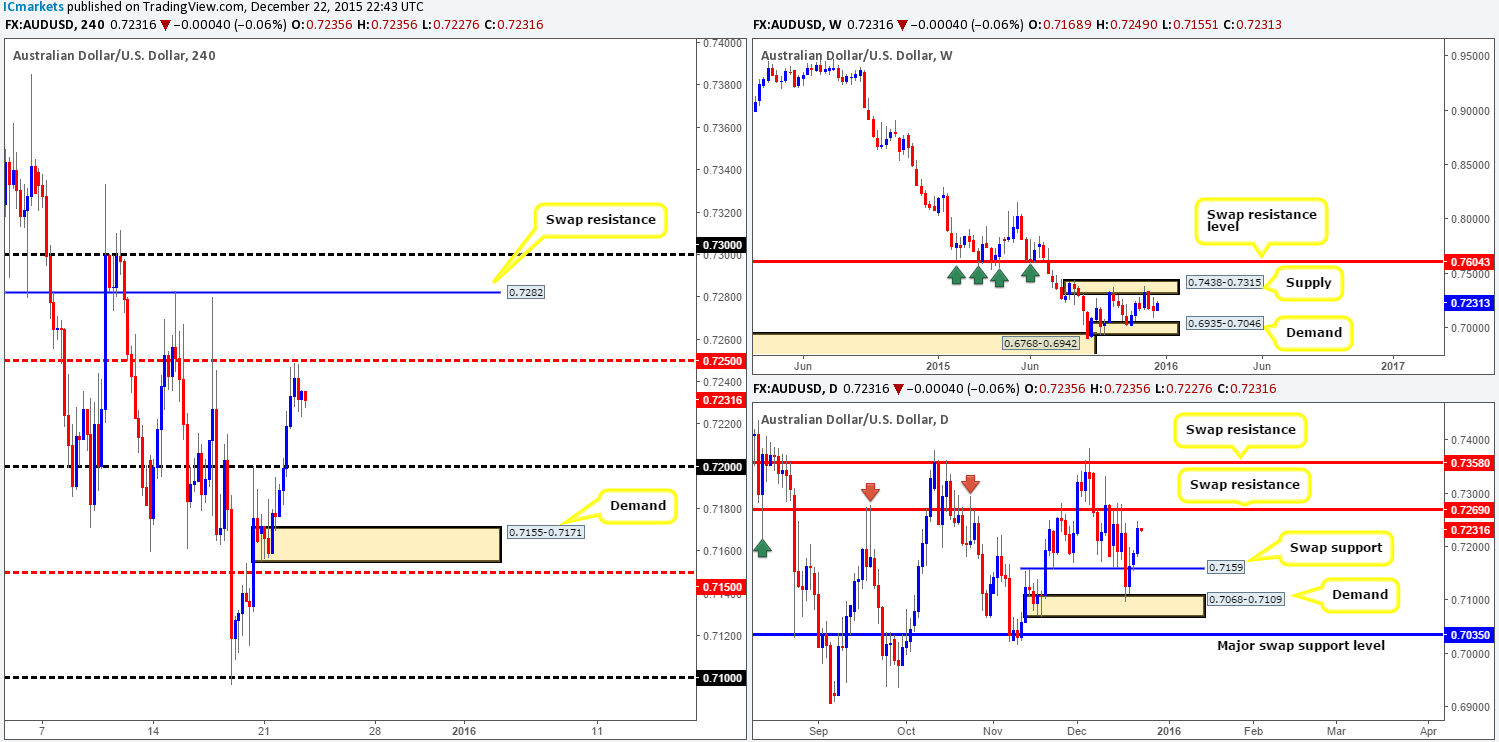
Levels to watch/ live orders:
- Buys: 0.7200 [Tentative – confirmation required] (Stop loss: dependent on where one confirms this level). 0.7155-0.7171 [Tentative – confirmation required] (Stop loss: dependent on where one confirms this area).
- Sells: Flat (Stop loss: N/A).
USD/JPY:
It seems we just missed a nice buy opportunity on the USD/JPY. Check out the H4 chart, notice that there was an AB=CD bull pattern completion just above support at 120.69. This – combined with price trading from daily demand at 120.34-121.01, and also currently holding above a weekly swap (support) level at 120.29, made this an awesome area in which to be looking to buy.
All may not be lost here! Should price hold above the recently broken psychological resistance 121.00 as support, there may be an opportunity (with lower timeframe confirmation) to buy from here, targeting yesterday’s high 121.30 first and foremost. In the event that 121.00 fails to hold, however, our team has agreed that due to the higher timeframe structure the current H4 support at 120.69 boasts (see above), it would be worth taking another shot at a long from here also. Waiting for lower timeframe confirmation is recommended, nonetheless, since some of the bids have already been filled around this region, thus we have to be prepared to see a fake lower before any buying is seen.
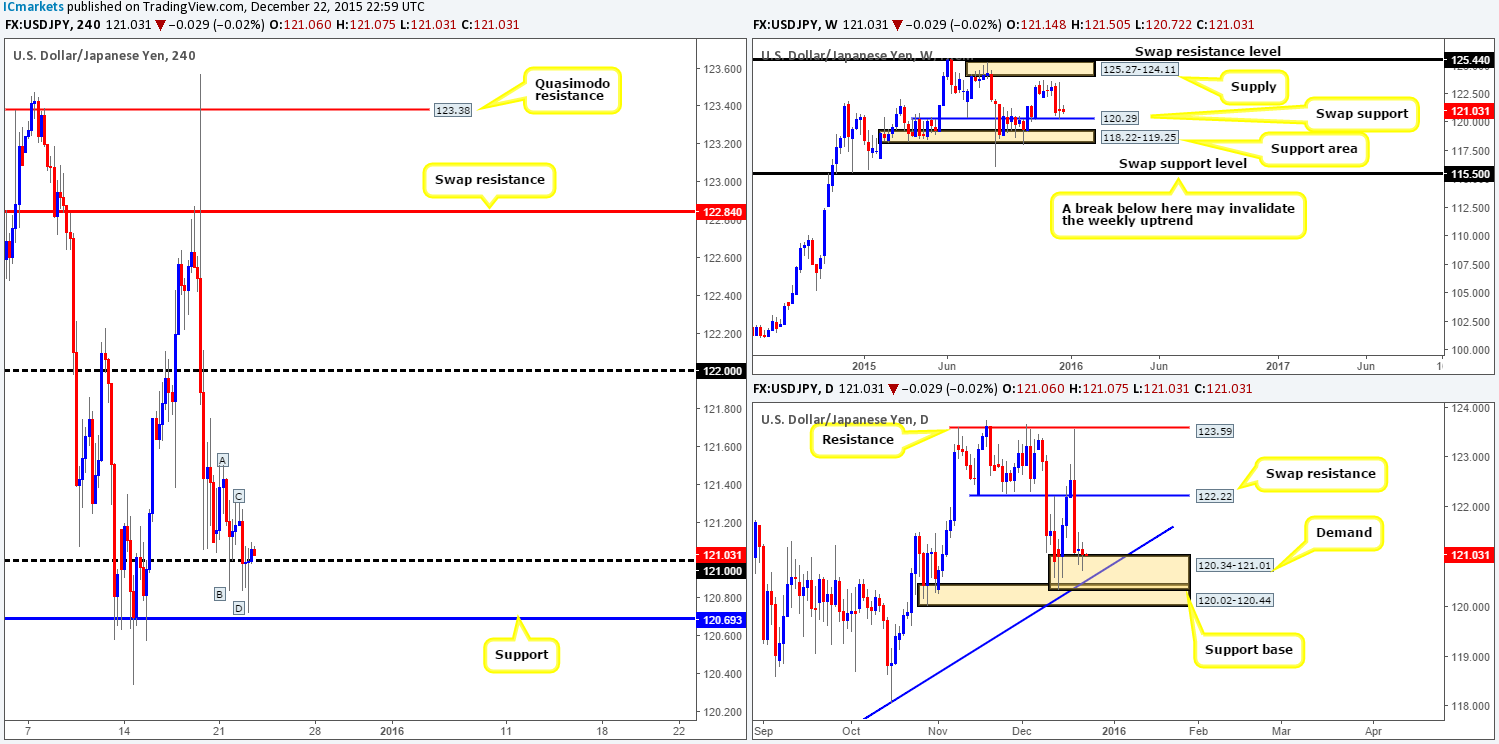
Levels to watch/ live orders:
- Buys: 121.00 [Tentative – confirmation required] (Stop loss: dependent on where one confirms this level). 120.69 [Tentative – confirmation required] (Stop loss: dependent on where one confirms this level).
- Sells: Flat (Stop loss: N/A).
USD/CAD:
Trade was relatively thin during yesterday’s sessions, moving a total of fifty pips off the lower limits of a H4 consolidation zone drawn from 1.3922. This range itself is not really important to us since we have no intention in trading it. What we are interested in though is the large psychological resistance number above it at 1.4000. We are hoping Santa will force this pair up to retest this number before tomorrow for a potential (lower timeframe confirmation required) short here, but it does not look like this is going to happen!
However, even if we do not see a touch of this number before tomorrow, it’s still a good level to have on your watch lists as it may hit before the year ends. The reason we’re confident in 1.4000 as a tradable resistance comes from the following:
- 1.4000 is considered a large number which traders pay attention to.
- Sits deep within both a weekly supply at 1.4190-1.3794 and a daily supply drawn from 1.4001-1.3904.
- 1.4000 looks to be where traders have been covering longs going into the festive period. Therefore, there is a clear bearish tone surrounding this number.
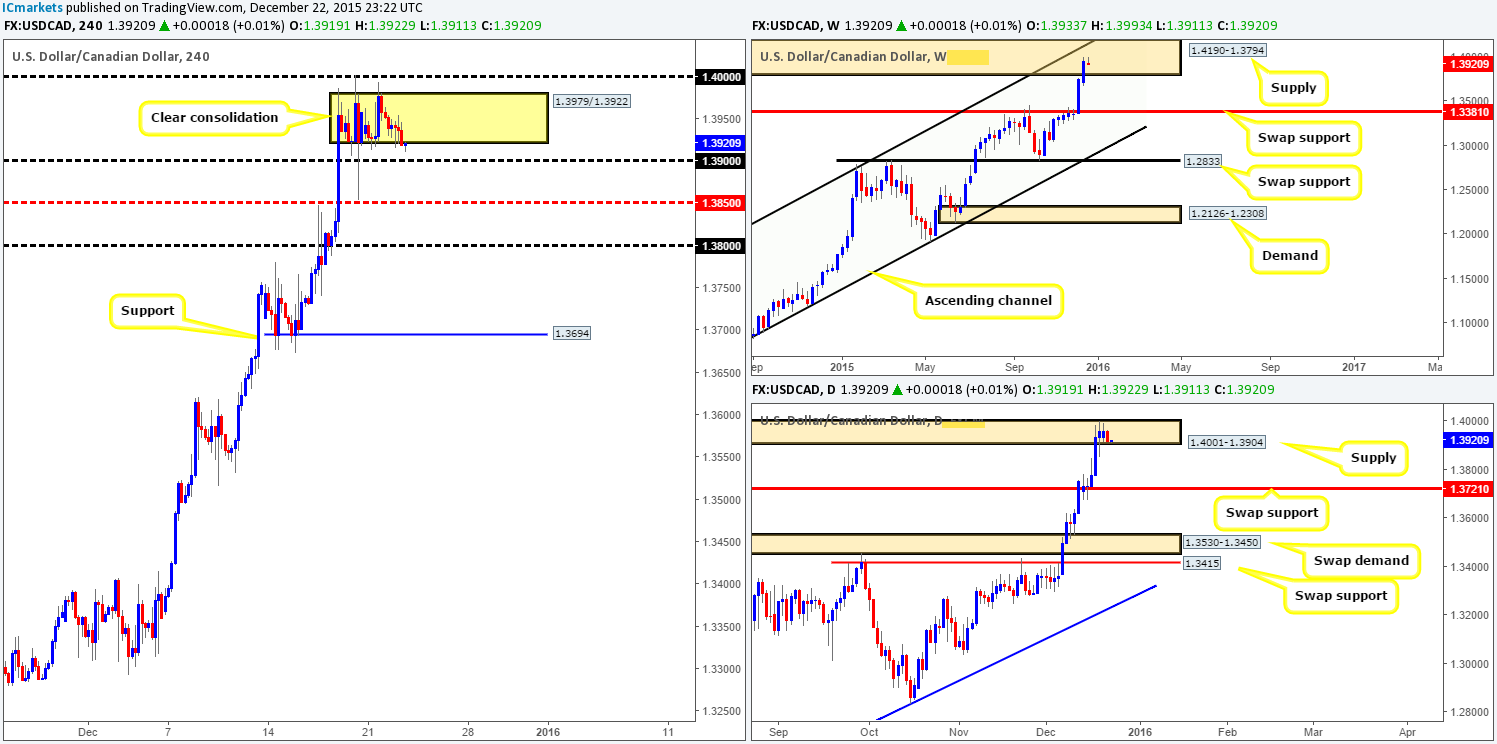
Levels to watch/ live orders:
- Buys: Flat (Stop loss: N/A).
- Sells: 1.4000 [Tentative – confirmation required] (Stop loss: dependent on where one confirms this level).
USD/CHF:
Coming at you directly from the top this morning, the buyers and sellers continue to battle for position within the weekly swap (support) area drawn from 0.9796-0.9902. The next upside target from here falls in around the recently faked supply area given at 1.0239-1.0131, and a break below has the weekly Quasimodo support at 0.9526 to target. Moving down to the daily chart, however, we can see that price recently closed below a swap support level at 0.9875, suggesting further downside could be on the cards towards the swap support at 0.9822 (converges with a 61.8% Fibonacci level at 0.9800), which is effectively the last barrier of defense for the current weekly swap (support) area.
Stepping down to the H4 chart reveals that just below the recently breached daily swap (support) level sits trendline support extended from the low 0.9786, which is holding this market higher at present. Therefore, it may be a little too early to discount the 0.9875 daily level just yet! Unfortunately though, even if the H4 trendline does continue to support this pair, risk/reward considerations argue against trading long from here since psychological resistance 0.9900, followed closely by H4 supply at 0.9937-0.9920 lurks just above.
On the flip side, supposing the current H4 trendline gives way, there appears room to short down to the daily swap (support) level at 0.9822. However, this would mean shorting into the weekly swap (support) area at 0.9796-0.9902. Not really the best idea considering trading conditions are thin as it is!
Given the absence of clear price action right now, we have decided to remain flat during today’s trade.
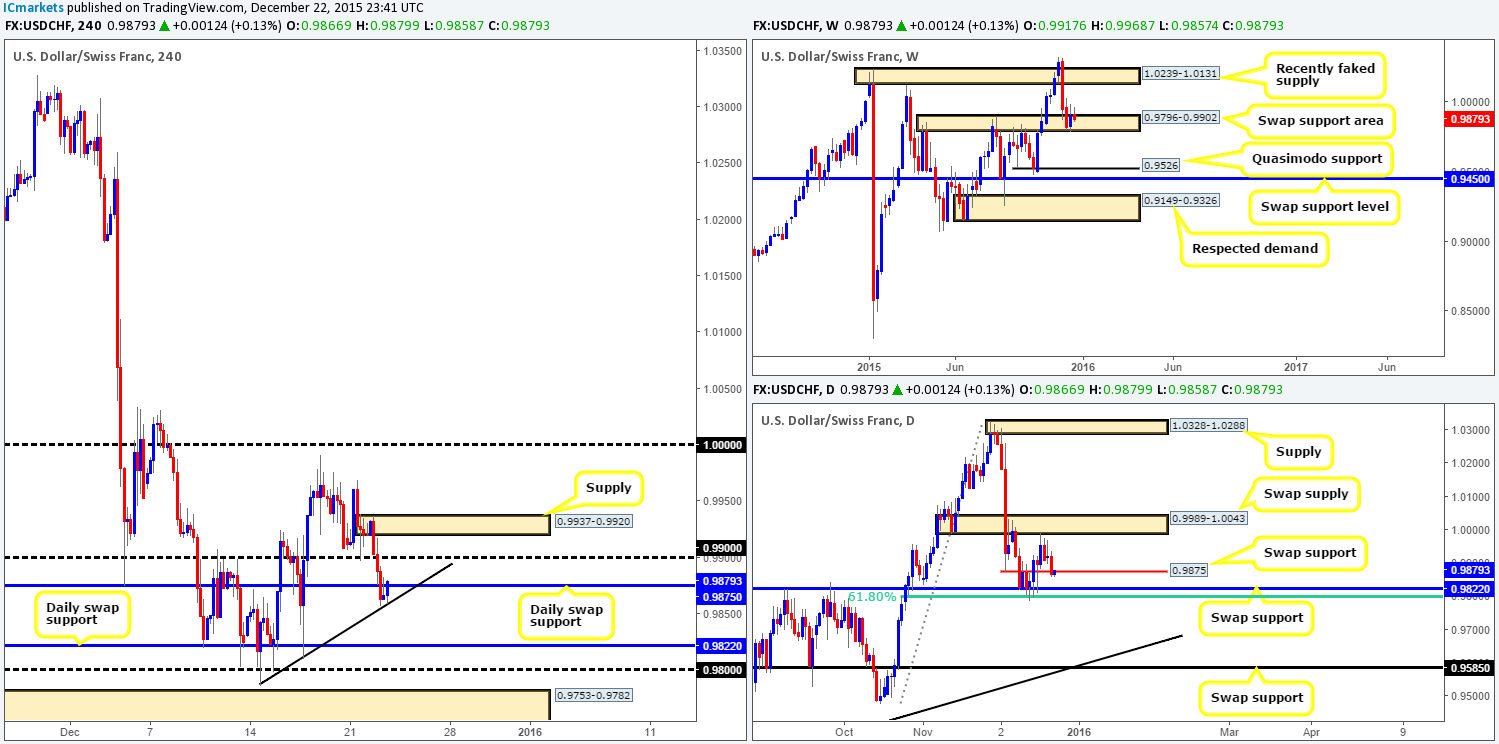
Levels to watch/ live orders:
- Buys: Flat (Stop loss: N/A).
- Sells: Flat (Stop loss: N/A).
DOW 30
For those who read our previous report on the DOW (http://www.icmarkets.com/blog/tuesday-22nd-december-daily-technical-outlook-and-review/), you may recall us mentioning to keep an eye on the H4 swap (support) level at 17256 for confirmed longs. As you can see, this level was retested as support (albeit a little deeper than expected mind you) which led to a sharp increase in value. Unfortunately, we were unable to locate a lower timeframe setup to take advantage of this rally. During this bullish onslaught, price aggressively spiked above H4 supply at 17452-17383, and at the same time closed above a H4 swap resistance at 17440 which is currently being retested as support.
Taking a (lower timeframe confirmed) long from this barrier of H4 support is possible (in our opinion) since there is plenty of room above this level for price to stretch its legs. However, if you are considering trading here, remain vigilant to the fact that there is a daily supply area looming above this region at 17811-17552, so be sure to manage the trade accordingly. This does not, however, mean that one should close all their position at this daily supply, since on the weekly chart; there is room to move back up to test the trendline resistance taken from the high 18365.
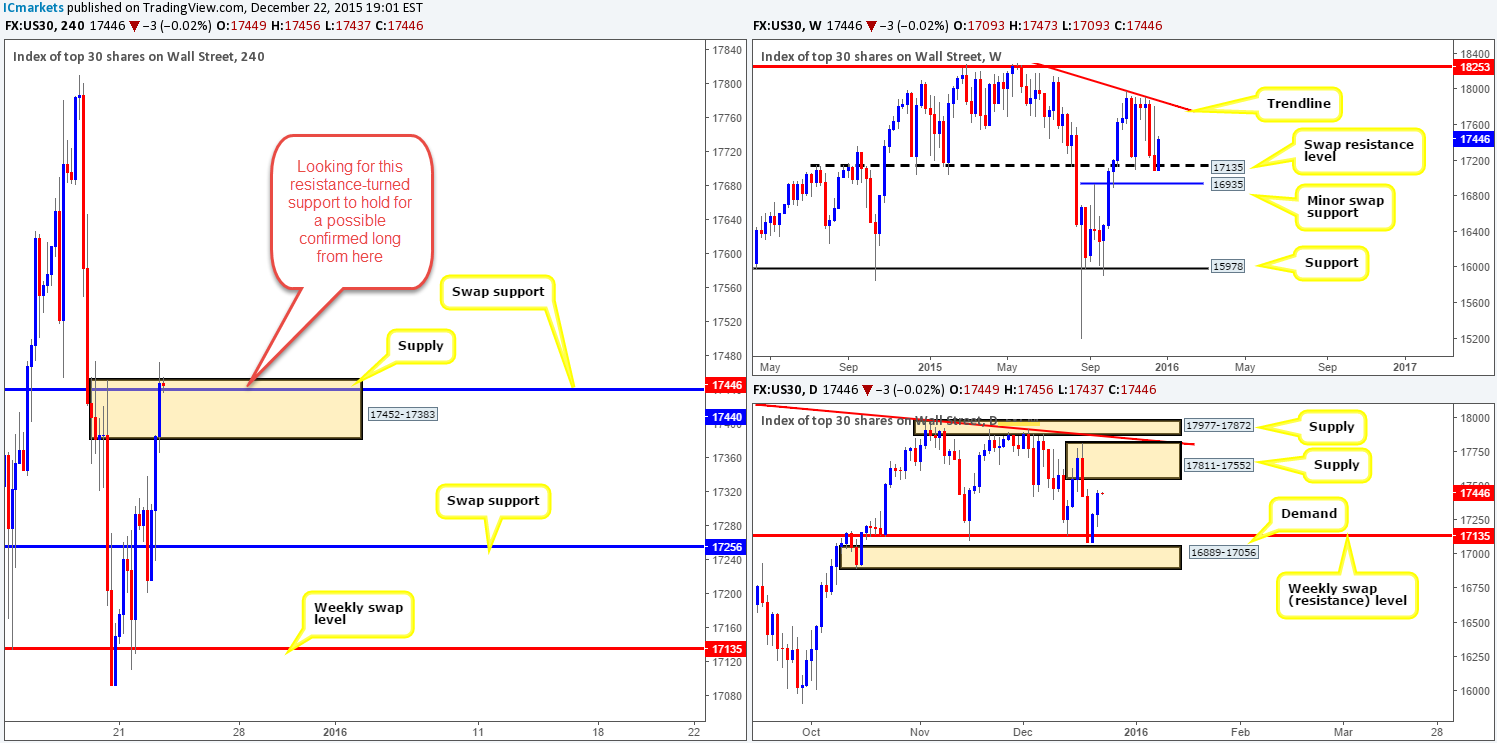
Levels to watch/ live orders:
- Buys: 17440 [Tentative – confirmation required] (Stop loss: dependent on where one confirms this level).
- Sells: Flat (Stop loss: N/A).
XAU/USD: (Gold) slightly revised
Kicking off this morning’s analysis with a look at the weekly chart shows that price continues to hold firm above demand coming in at 1026.5-1054.8 (merges with the lower limit of a long-term wedge pattern from the low 1180.1). Should further buying be seen, the next upside target in the firing range comes in at 1098.6-1121.7 – a weekly swap (supply) zone. Zooming in and looking at the daily chart, nonetheless, reveals that the yellow metal is beginning to carve out a rather large consolidation zone between the swap resistance level at 1084.5 and the swap support barrier coming in at 1046.3. Quite frankly, we do not see Gold breaking out of this box until the New Year.
Turning our attention to the H4 chart, the rebound seen from the trendline resistance taken from the high 1097.9 continued to extend lower during the course of yesterday’s sessions, reaching lows of 1071.7 on the day. Technically, we see very little on the Gold H4 chart to stop prices from falling further today at least until we reach the swap support level at 1067.3, which could be good for an intraday bounce as long as it’s traded alongside lower timeframe confirmation.
Other than the above, we’ll be keeping a close eye on the following levels over the Christmas period:
Buys:
- The Quasimodo support at 1058.4. We would not expect much of a bounce from here, since price may continue lower to connect with the lower limit of the daily range, 1046.3. The same goes for the double-bottom formation at 1049.9 (waiting for lower timeframe confirmation at both levels is highly recommended).
- The daily swap (support) level at 1046.3 (the lower limit of the daily range). We would consider, given the right approach and time of day, possibly entering long here at market.
Sells:
- The trendline resistance extended from the high 1097.9. This barrier has already proved itself more than once, thus deserving its place on this list (lower timeframe confirmation required for us to trade this line).
- The daily swap (resistance) at 1084.5 (the upper limit of the daily range). Trading this level (for us) would require lower timeframe confirmation before a trade is considered for two reasons (1) possibility of a fakeout above to the H4 resistance at 1087.1 (2) let’s not forget that price is trading from a weekly demand area at 1026.5-1054.8.
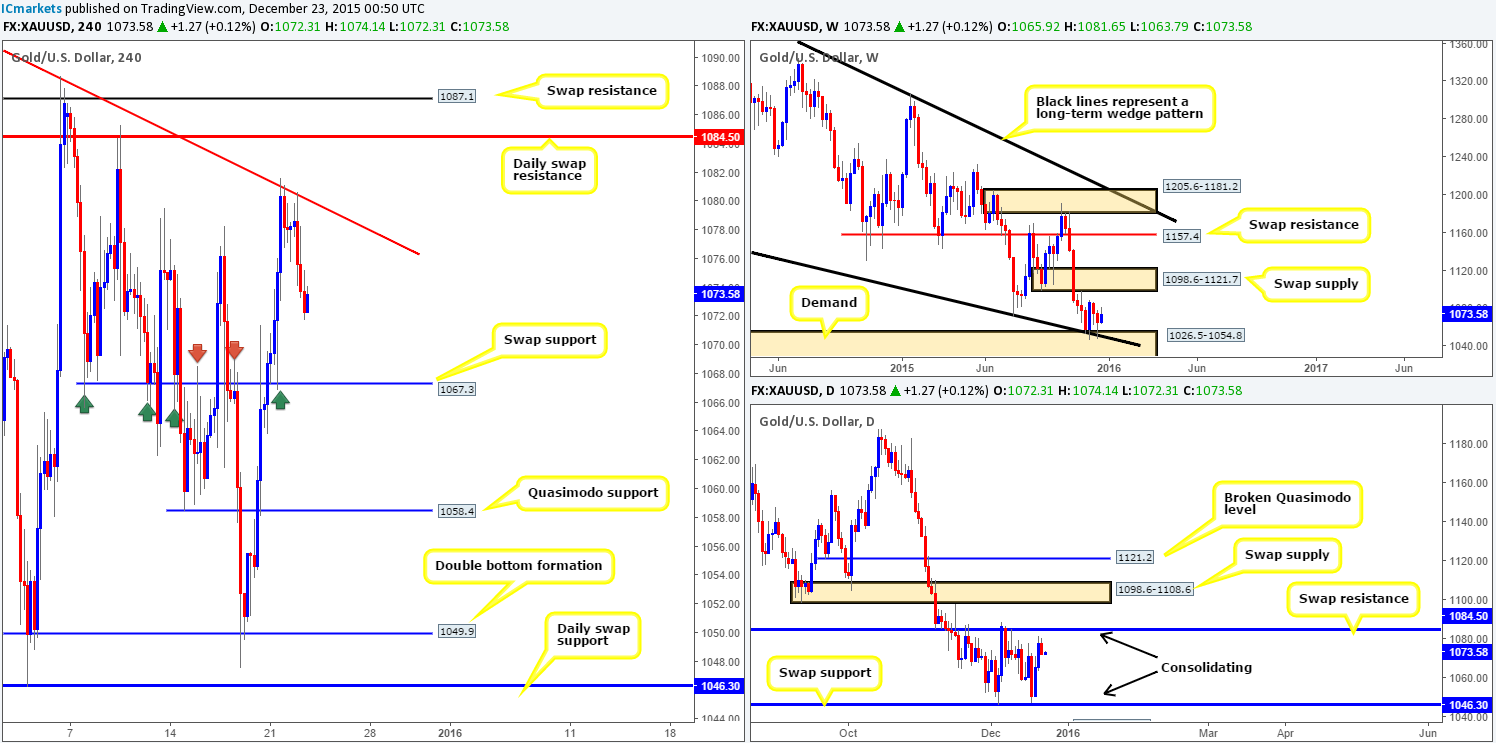
Levels to watch/ live orders:
- Buys: 1067.3 [Tentative – confirmation required] (Stop loss: dependent on where one confirms this level). 1058.4 [Tentative – confirmation required] (Stop loss: dependent on where one confirms this level). 1049.9 [Tentative – confirmation required] (Stop loss: dependent on where one confirms this level). 1046.3 [Dependent on the time of day and H4 approach, we may consider a market entry here] (Stop loss: Will be calculated via the ATR).
- Sells: The trendline resistance extended from the high 1097.9 [Tentative – confirmation required] (Stop loss: dependent on where one confirms this level). 1084.5 [Tentative – confirmation required] (Stop loss: dependent on where one confirms this level).


