
A note on lower timeframe confirming price action…
Waiting for lower timeframe confirmation is our main tool to confirm strength within higher timeframe zones, and has really been the key to our trading success. It takes a little time to understand the subtle nuances, however, as each trade is never the same, but once you master the rhythm so to speak, you will be saved from countless unnecessary losing trades. The following is a list of what we look for:
A break/retest of supply or demand dependent on which way you’re trading.
- A trendline break/retest.
- Buying/selling tails/wicks – essentially we look for a cluster of very obvious spikes off of lower timeframe support and resistance levels within the higher timeframe zone.
- Candlestick patterns. We tend to stick with pin bars and engulfing bars as these have proven to be the most effective.
We typically search for lower-timeframe confirmation between the M15 and H1 timeframes, since most of our higher-timeframe areas begin with the H4. Stops are usually placed 3-5 pips beyond confirming structures.
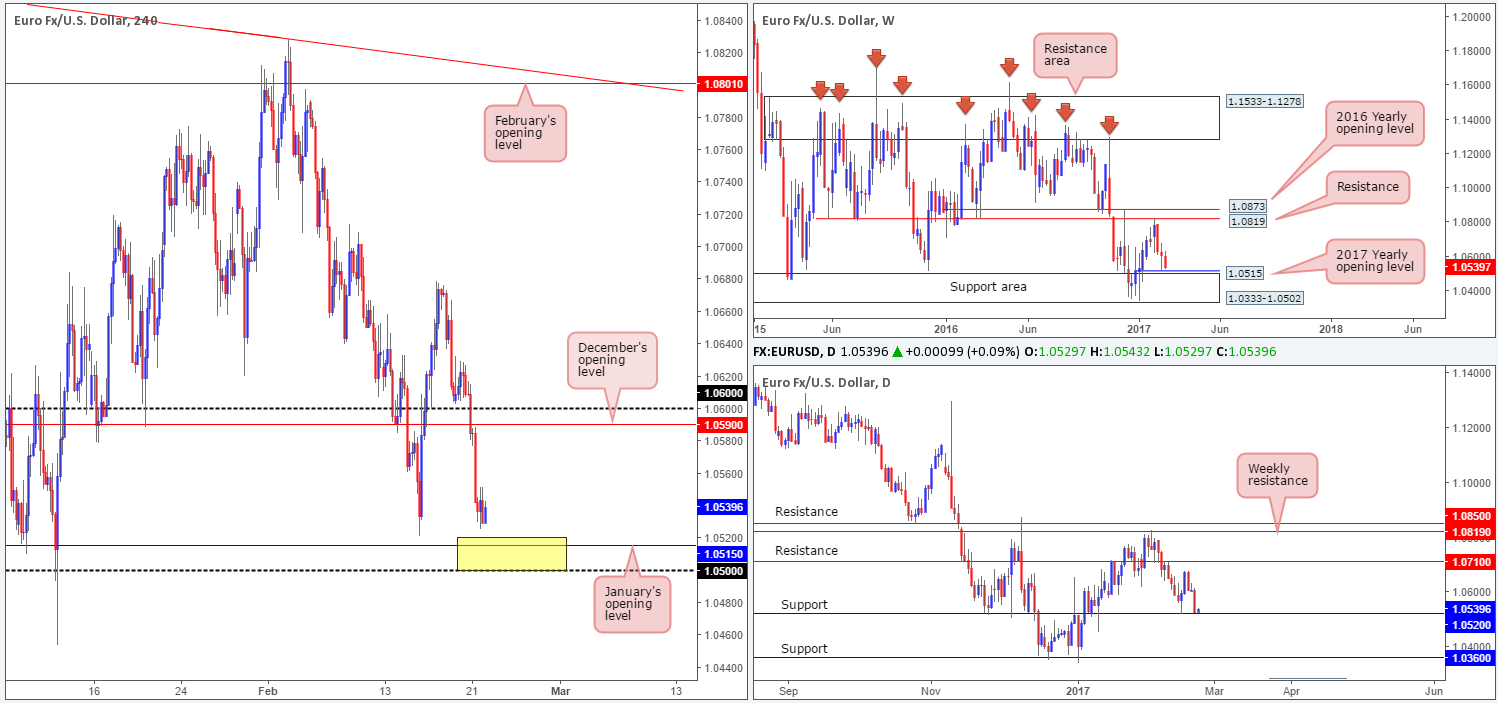
EUR/USD:
The value of the EUR weakened in aggressive fashion on Tuesday despite upbeat PMI data coming in from the Eurozone. Consequent to this, both the psychological boundary 1.06 and December’s opening base at 1.0590 were taken out; with the unit ending the day closing just ahead of January’s opening level seen at 1.0515.
1.0515 is an interesting barrier. Not only because it is this year’s opening number, but also because it is situated five pips below a daily support at 1.0520, as well as positioned nearby the 1.05 handle which effectively represents the top edge of a weekly support area at 1.0502. For that reason, we believe that a reaction could very well be seen from the 1.05/1.0520 region (yellow H4 box) sometime today.
Our suggestions: Although the above buy zone is tempting given the convergence of higher-timeframe structures, we will need additional confirmation in the form of a reasonably sized H4 bull candle before pulling the trigger. The reason for why is simply due to there being very little H4 demand supporting a buy from here.
Data points to consider: German ifo business survey at 9am. FOMC member Powell speaks at 6pm, FOMC meeting minutes at 7pm GMT.
Levels to watch/live orders:
- Buys: 1.05/1.0520 ([wait for a H4 bull candle to form before pulling the trigger] stop loss: ideally beyond the trigger candle).
- Sells: Flat (stop loss: N/A).
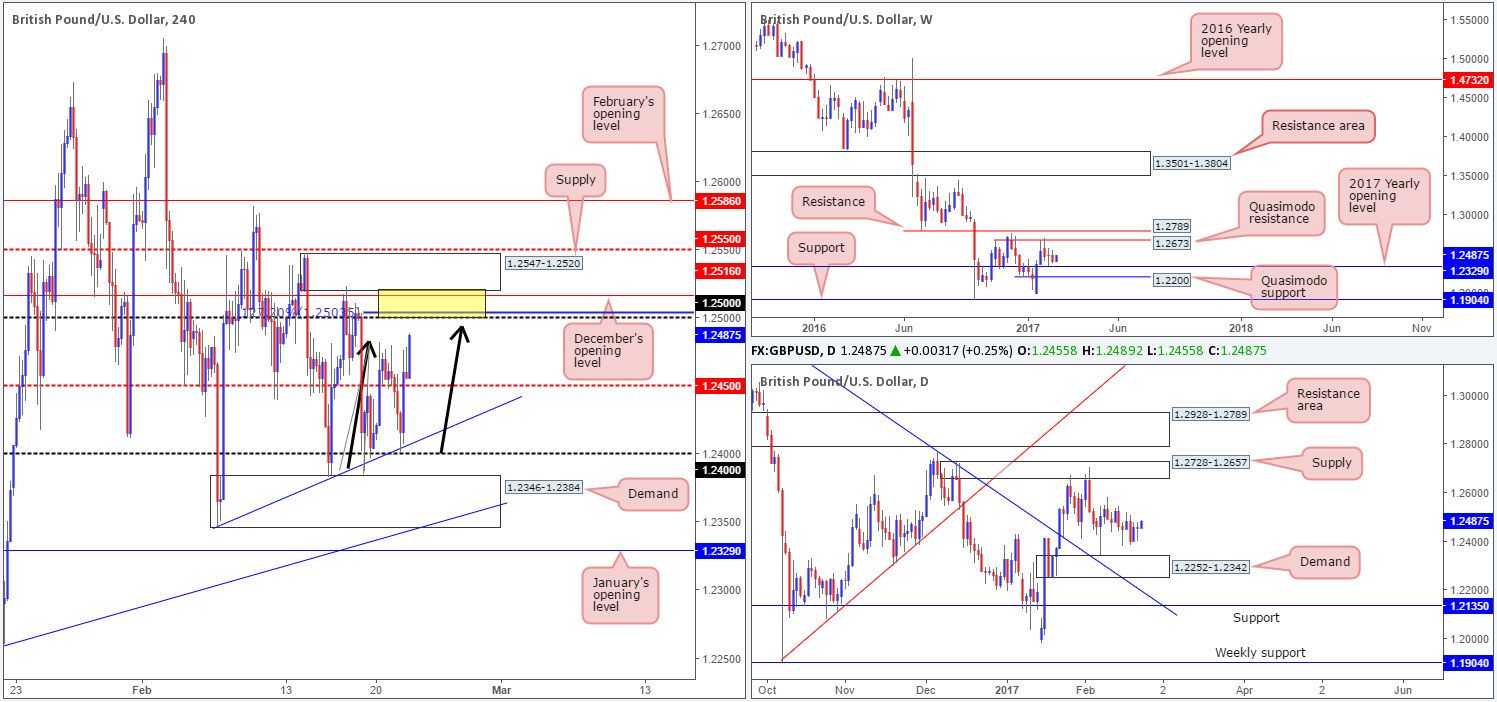
GBP/USD:
Mid-way through yesterday’s London session, the pair caught a fresh bid off a H4 trendline support etched from low 1.2346 and managed to close the day above the nearby H4 mid-way resistance at 1.2450. Seeing as how the unit lacks higher-timeframe (structural) direction at present, our desk sees no reason why price will not continue to gravitate north and connect with the 1.25 handle today, which we believe could potentially hold prices lower.
There are a number of technical aspects that support this view:
- H4 bearish AB=CD (black arrows) 127.2% ext. at 1.2503.
- December’s opening level at 1.2516.
- The underside of a H4 supply coming in at 1.2547-1.2520.
Our suggestions: Assuming one shorts the 1.2520/1.25 H4 zone (yellow box) at market, stop-loss orders should ideally be placed above the H4 mid-way resistance at 1.2550. For the more conservative traders out there, you may want to consider waiting for additional confirmation in the form of a reasonably sized H4 bearish candle. This would, in effect, give you the choice of either placing stops above the trigger candle or beyond the current H4 supply.
Data points to consider: UK GDP (second estimate) at 9.30am, MPC member Cunliffe speaks at 11am, MPC member Shafik speaks at 8am. FOMC member Powell speaks at 6pm, FOMC meeting minutes at 7pm GMT.
Levels to watch/live orders:
- Buys: Flat (stop loss: N/A).
- Sells: 1.2520/1.25 ([wait for a H4 bear candle to form before pulling the trigger] stop loss: ideally beyond the trigger candle or above the current H4 supply zone).
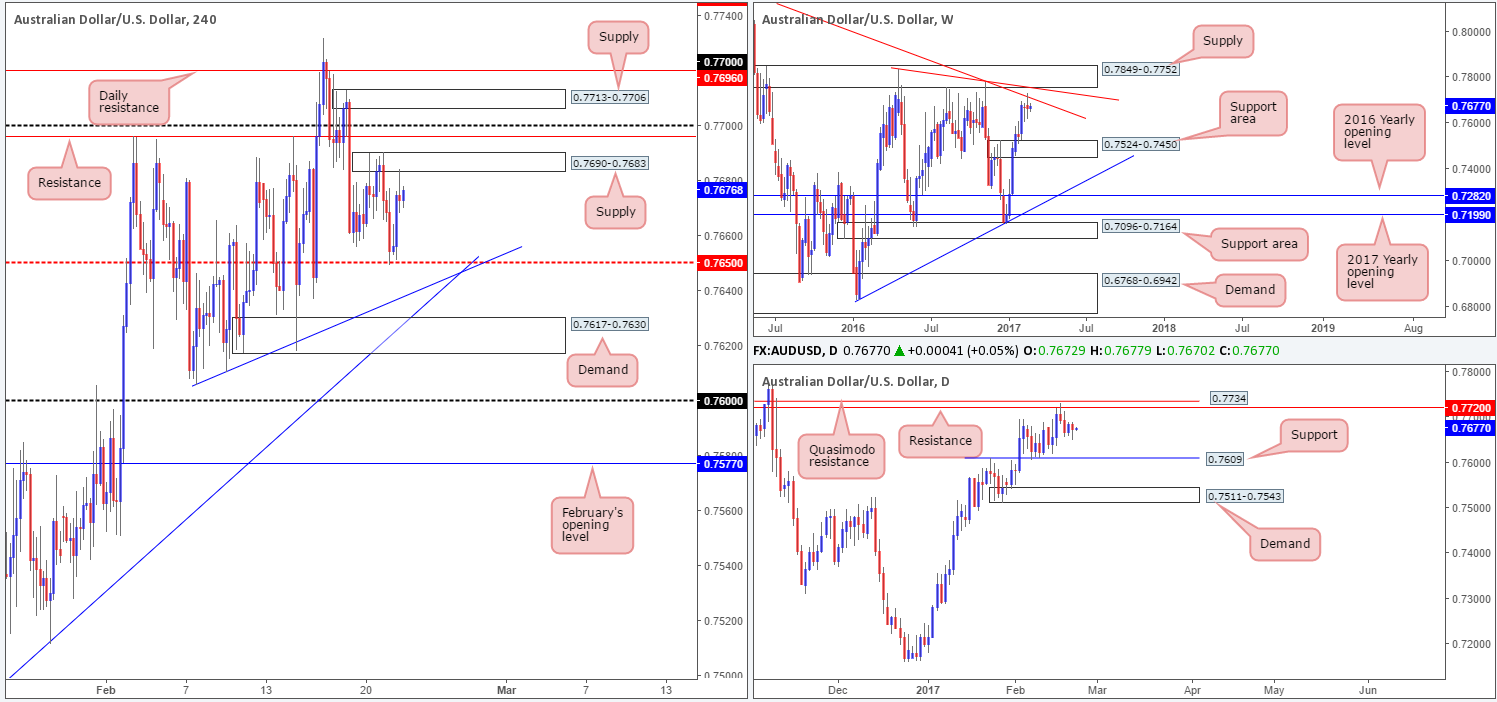
AUD/USD:
The Aussie pair began yesterday’s session on somewhat of a soft footing, after the RBA showed that they were ready to lower rates if needed. This brought price down to the H4 mid-way support level coming in at 0.7650, which held firm going into the early hours of London and eventually trimmed the bulk of the day’s earlier losses.
Going forward, the weekly candles remain undecided at the base of a weekly trendline resistance taken from the high 0.8163. Meanwhile, daily price is seen trading mid-range between a daily resistance at 0.7720 and the daily support line coming in at 0.7609.
Our suggestions: Technically speaking, the H4 supply currently in play at 0.7690-0.7683 has a good chance of holding ground today, given the position of price on the weekly chart. However, there is always the possibility that the unit could fake above this zone to connect with H4 resistance at 0.7696/0.77 handle.
The other key thing to note is the chance that price action may want to retest the daily resistance at 0.7720. Therefore, the pair could potentially ignore all of the above said zones and more! As such, we would strongly recommend waiting for a lower-timeframe sell signal to form (see the top of this report) before looking to execute a trade around the above said H4 zones.
Data points to consider: FOMC member Powell speaks at 6pm, FOMC meeting minutes at 7pm GMT.
Levels to watch/live orders:
- Buys: Flat (stop loss: N/A).
- Sells: 0.7690-0.7683 ([wait for a lower-timeframe confirming signal to form before pulling the trigger] stop loss: dependent on where one confirms this area). 0.77 region ([wait for a lower-timeframe confirming signal to form before pulling the trigger] stop loss: dependent on where one confirms this area).
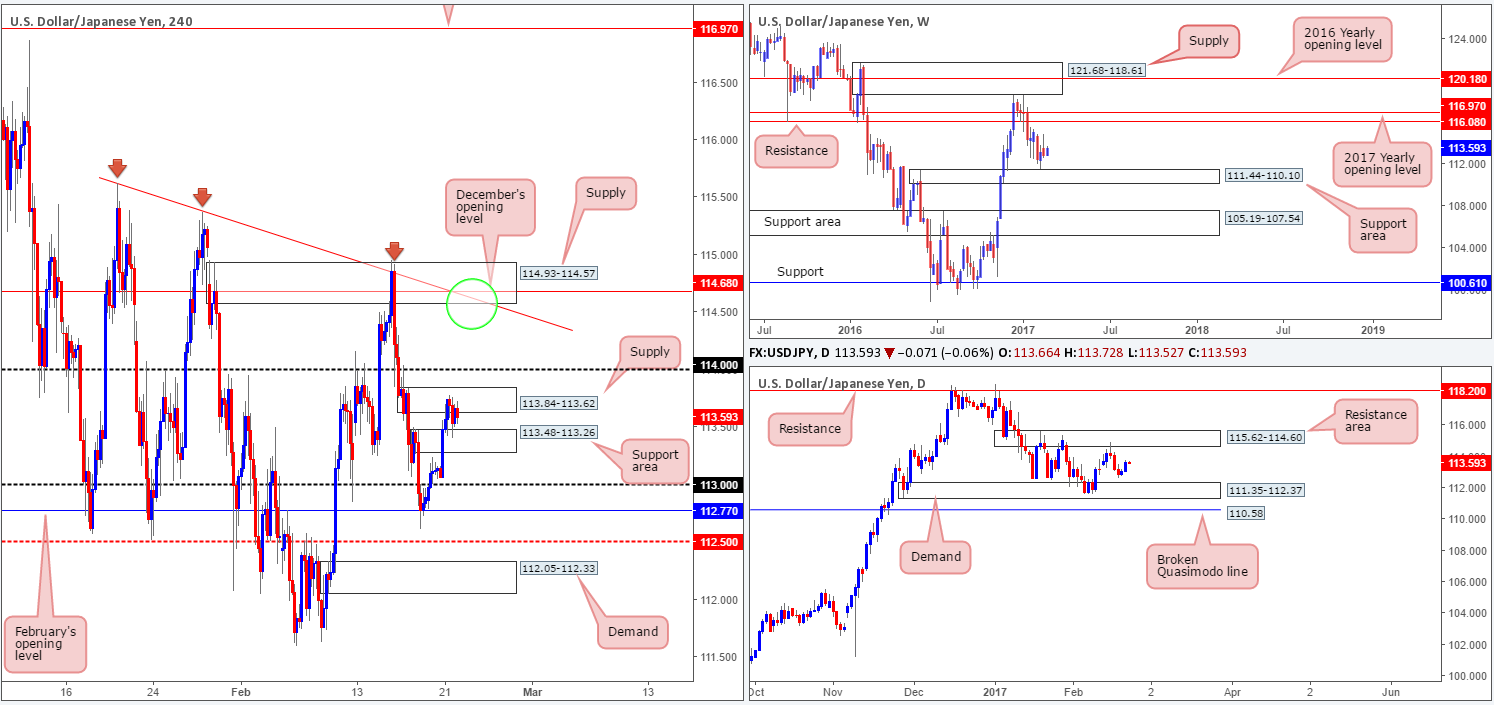
USD/JPY:
Although the USD/JPY did in fact post a second consecutive daily gain yesterday, the H4 candles show that price spent the majority of the trading day capped between a H4 supply at 113.84-113.62 and a newly-formed H4 support area at 113.48-113.26.
If the current H4 supply zone is taken out, along with the nearby psychological level 114, this would likely place the H4 supply zone at 114.93-114.57 in the firing range. This area, as highlighted with a green circle, is bolstered by a H4 trendline resistance from the high 115.62, December’s opening level at 114.68 and it is also situated within the lower limits of a daily resistance area drawn from 115.62-114.60.
Our suggestions: On account of the above, we see two possible trade scenarios:
- Watch for a H4 close to form beyond 114 and look to trade any retest of this level seen thereafter, targeting the H4 supply seen at 114.93-114.57.
- In light of the confluence surrounding the H4 (target) supply zone, a short trade from here is a real possibility. However, we would only consider selling this zone at market on the condition that we have a sound approach in the form of a structured H4 AB=CD formation. If not, we will wait for additional price confirmation (a reasonably sized H4 bearish candle) before pulling the trigger.
Data points to consider: FOMC member Powell speaks at 6pm, FOMC meeting minutes at 7pm GMT.
Levels to watch/live orders:
- Buys: Watch for a H4 close above 114 to form and then look to trade any retest seen thereafter ([waiting for a lower-timeframe confirming buy signal to be seen following the retest is advised] stop loss: dependent on where one confirms the level).
- Sells: 114.93-114.57 ([wait for a H4 bear candle to form before pulling the trigger] stop loss: ideally beyond the trigger candle or above the current H4 supply zone).
USD/CAD:
In view of weekly price still seen trading within the walls of a weekly demand base at 1.3006-1.3115, there is a chance that this market could head up to the weekly trendline resistance taken from the high 1.4689. Before the weekly buyers can target this trendline resistance, however, daily price would need to consume the 1.3212 neighborhood (yellow box – 7th February high).
Stepping across to the H4 chart, we can see that H4 action failed to muster enough strength to break beyond H4 supply at 1.3158-1.3139 yesterday, and is, at the time of writing, pushing lower from this zone! The next support target on tap can be seen at 1.31, which is encapsulated by a H4 demand area at 1.3089-1.3111.
Our suggestions: A bounce from the current H4 demand is a real possibility, in our opinion. Not only because it houses a psychological level (1.31), but also because weekly price is, as we mentioned above, trading from within a weekly demand area! However, this is not what we would label a high-probability trade, partly due to the daily sellers currently in play. Therefore, waiting for lower-timeframe confirming price action to form (see the top of this report) before pulling the trigger is, at least in our view, the safer route to take.
Data points to consider: FOMC member Powell speaks at 6pm, FOMC meeting minutes at 7pm GMT. Canadian retail sales at 1.30pm GMT.
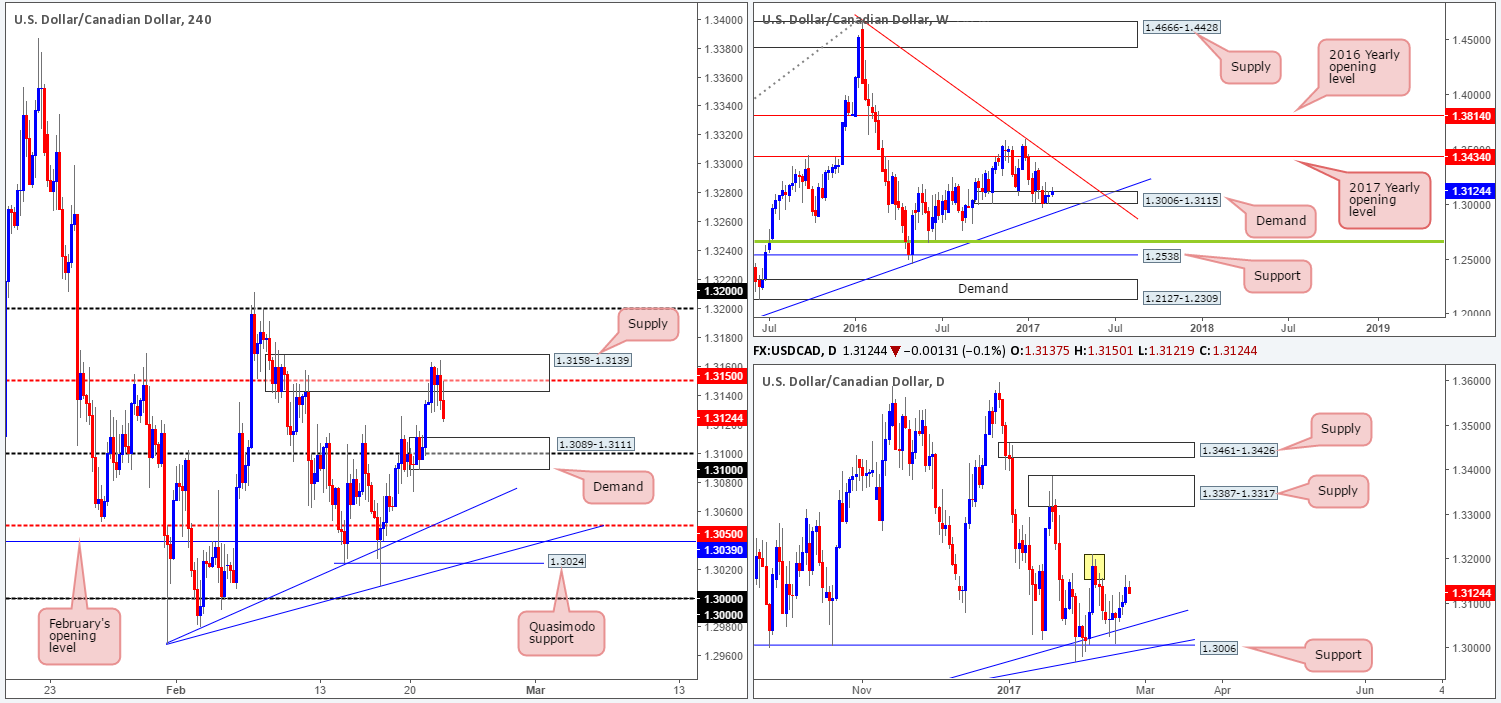
Levels to watch/live orders:
- Buys: 1.3089-1.3111 ([waiting for a lower-timeframe confirming signal is advised before pulling the trigger] stop loss: dependent on where one confirms this area).
- Sells: Flat (stop loss: N/A).
USD/CHF:
In recent sessions, we can see that the USD/CHF advanced north and shook hands with a H4 supply area carved from 1.0122-1.0097. This area, as you can probably see, boasts H4 trendline resistance taken from the high 1.0248, a psychological level at 1.01 and is also positioned within the upper limits of daily supply coming in at 1.0122-1.0060. Given the H4 bearish engulfing candle formed off the H4 supply zone amid the early hours of yesterday’s US segment, our team sold from here at 1.0087, with a stop placed above the current H4 supply at 1.0125. Our first take-profit target is the H4 mid-way support band chalked in at 1.0050, followed closely by H4 demand at 1.0016-1.0033.
Well done to any of our readers who managed to pin down a setup from this region, since this was a noted area in our previous report to hunt for shorting opportunities.
Data points to consider: FOMC member Powell speaks at 6pm, FOMC meeting minutes at 7pm GMT.
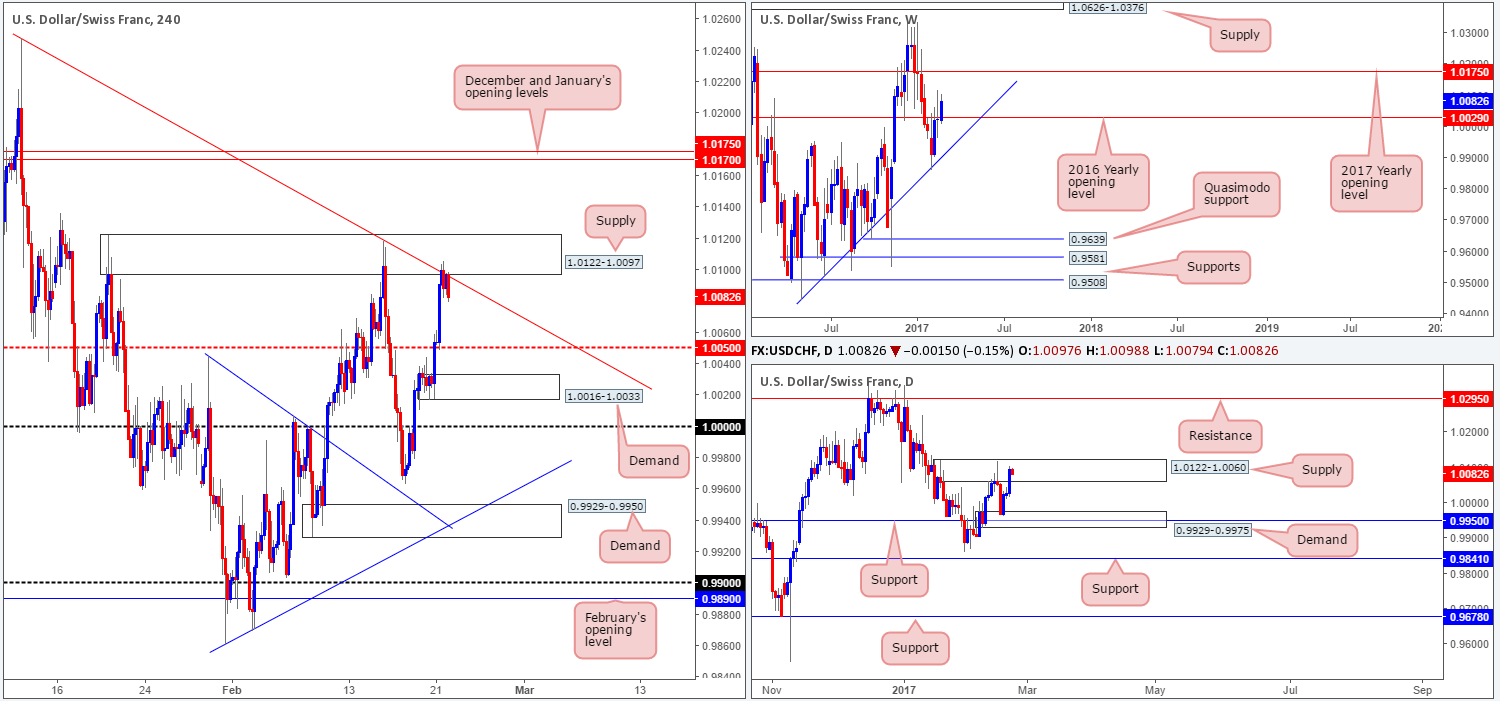
Levels to watch/live orders:
- Buys: Flat (stop loss: N/A).
- Sells: 1.00878 ([live] stop loss: 1.0125).
DOW 30:
Recent action shows that US equities closed higher for a second consecutive day, and managed to tap a fresh record high of 20753! With absolutely no higher-timeframe resistance levels in sight, the best we feel we can do for the time being is continue looking to ‘buy the dips’. The nearest higher-timeframe area can be seen at 20003-20091: a daily demand that is positioned directly above a daily support barrier at 19964.
Our suggestions: The next area of demand on the H4 chart, however, now falls in at 20621-20650. While this zone boasts no higher-timeframe (structural) convergence, we feel it is still worthy of attention simply because it was formed in line with the current uptrend. Just to be clear here though, placing pending orders at this zone is not advised, since there’s little stopping price from ignoring this area and heading to the H4 demand zone below at 20498-20532. Waiting for additional confirmation such as a lower-timeframe buy signal (see the top of this report) or a reasonably sixed H4 bull candle would, at least in our opinion, be the safer, more logical, path to take.
Data points to consider: FOMC member Powell speaks at 6pm, FOMC meeting minutes at 7pm GMT.
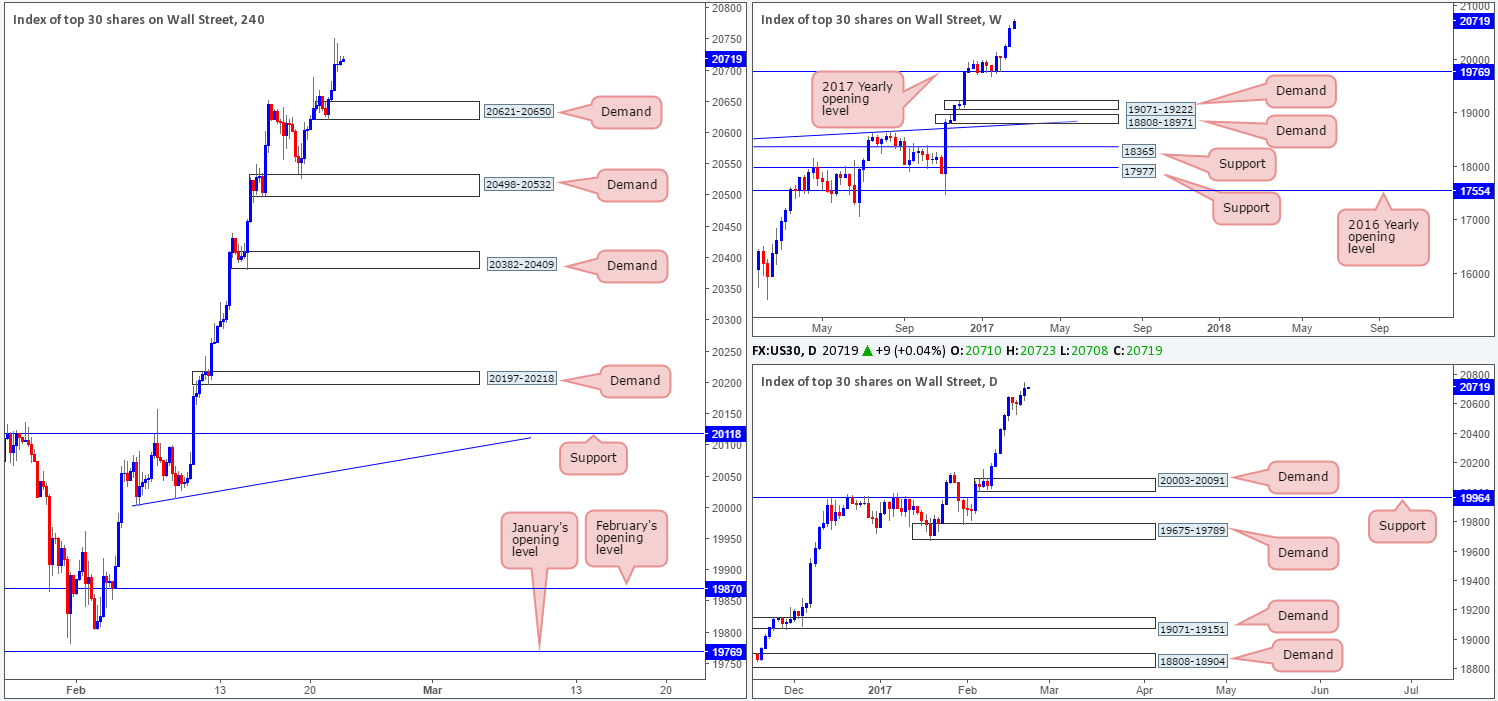
Levels to watch/live orders:
- Buys: 20621-20650 ([waiting for additional confirmation is advised before looking to execute a trade] stop loss: dependent on how one chooses to confirm the zone).
- Sells: Flat (stop loss: N/A).
GOLD:
Although weekly action recently connected with a weekly resistance level registered at 1241.2, the bears have yet to stamp in any authority in this market! This is likely due to daily buyers seen defending the daily support area coming in at 1232.9-1224.5, which happens to be bolstered by a daily trendline support etched from the low 1127.2.
Looking over to the H4 candles, price bounced nicely off a H4 trendline support taken from the high 1236.8 yesterday, and even boasted a beautiful-looking H4 AB=CD approach formation! Well done to any of our readers who traded from this angle!
Our suggestions: While the bears seem to be lacking substance at the moment, we would not really advise entering long until H4 price has cleared the H4 161.8 % ext. level at 1241.9. A retest of this level as support, following a decisive close higher would, in our book of technical setups, be valid, since at that point, price would be reasonably clear of the current weekly resistance. For now, nonetheless, it’s back to sitting on our hands for the time being.
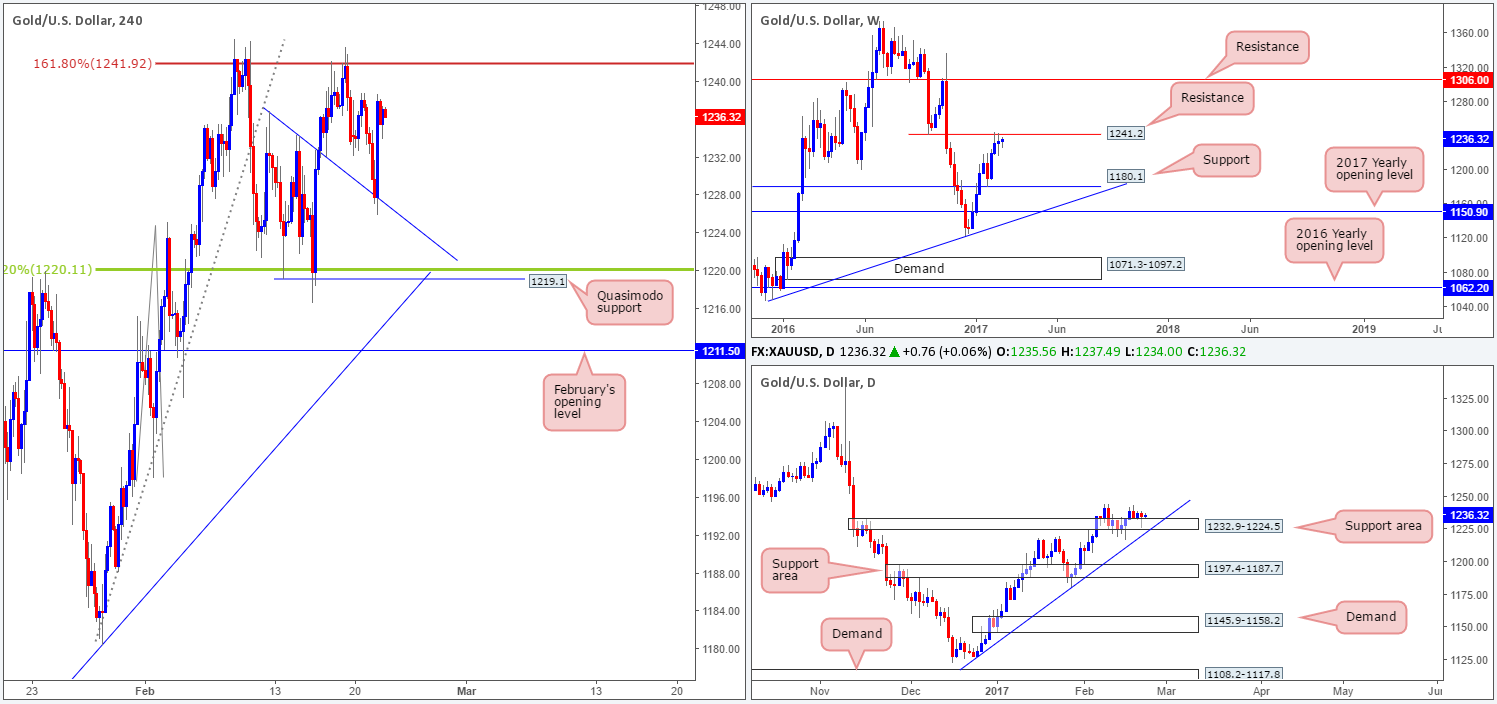
Levels to watch/live orders:
- Buys: Watch for a H4 close above 1241.9 and then look to trade any retest seen thereafter ([waiting for a reasonably H4 bullish close to form following the retest is advised] stop loss: ideally beyond the trigger candle).
- Sells: Flat (stop loss: N/A).


