
A note on lower timeframe confirming price action…
Waiting for lower timeframe confirmation is our main tool to confirm strength within higher timeframe zones, andhas really been the key to our trading success. It takes a little time to understand the subtle nuances, however, as each trade is never the same, but once you master the rhythm so to speak, you will be saved from countless unnecessary losing trades. The following is a list of what we look for:
- A break/retest of supply or demand dependent on which way you’re trading.
- A trendline break/retest.
- Buying/selling tails – essentially we look for a cluster of very obvious spikes off of lower timeframe support and resistance levels within the higher timeframe zone.
- Candlestick patterns. We tend to only stick with pin bars and engulfing bars as these have proven to be the most effective.
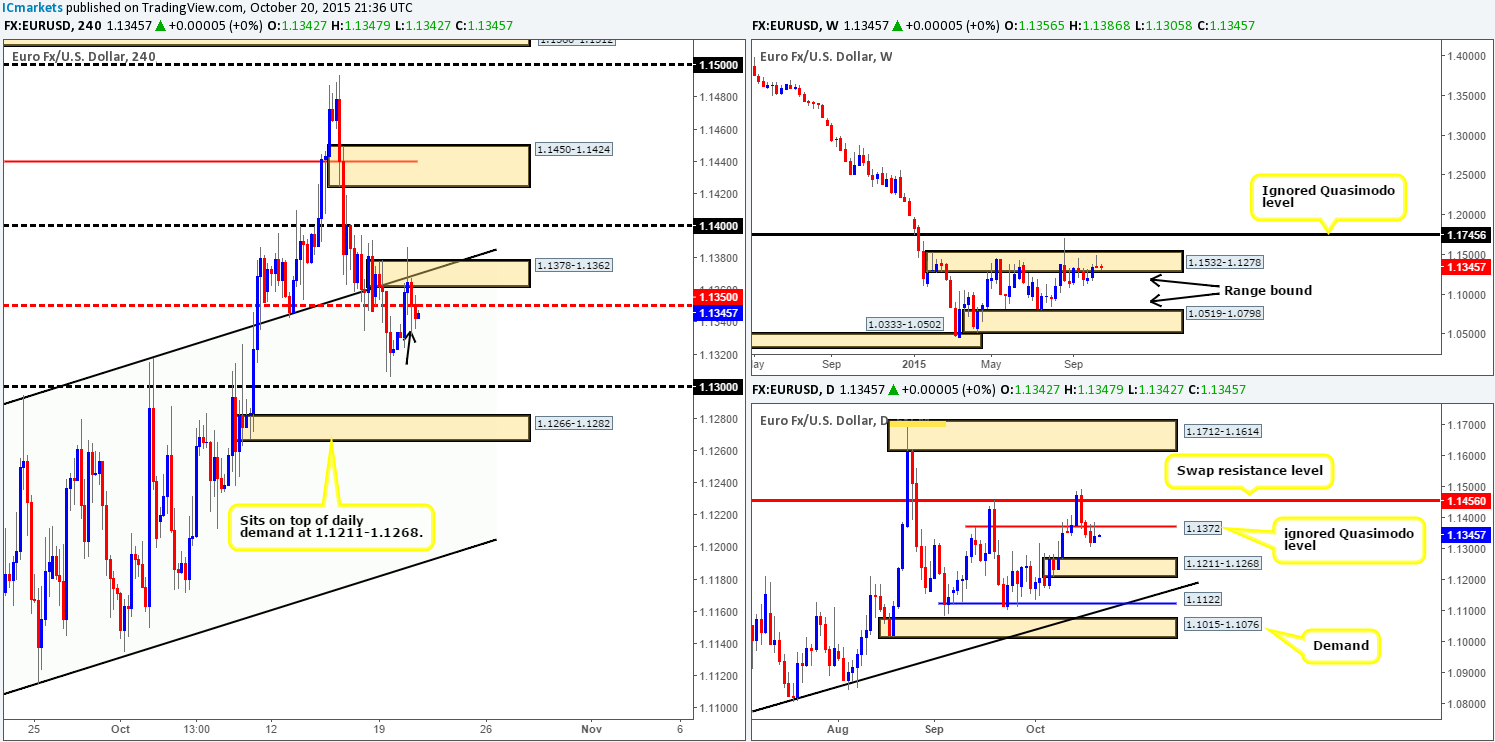
EUR/USD:
In our previous report (http://www.icmarkets.com/blog/tuesday-20th-october-daily-technical-outlook-and-review/), we mentioned that we may, dependent on how price approached supply at 1.1378-1.1362 and the time of day (TOD); take a short at market from the 1.1358 region. As it happens, the approach and the TOD were good enough in our opinion to justify a sell here which led us to being stopped out at 1.1380.
Based on recent action, the market continues to trade within the confines of the upward channel (1.1104/1.1294), with price, at the time of writing, seen flirting with mid-level resistance 1.1350.
Given that the EUR remains loitering within supply on the weekly timeframe at 1.1532-1.1278, and recently stabbed the underside of an ignored Quasimodo on the daily timeframe at 1.1372, we are still biased to the downside.
Should 1.1350 hold as resistance today, which we think it might judging by its historical significance as support and resistance, we will consider a short here if lower timeframe confirmation is seen. Targets for this trade can be seen at psychological support 1.1300, followed closely by demand at 1.1266-1.1282 (positioned on top of daily demand at 1.1211-1.1268). In addition to this, freshly painted candle action also lent a hand in convincing us that this pair may be heading lower today. Have a look at the tail marked with a black arrow at 1.1332. This tail likely consumed enough demand around the 1.1323-1.1339 area to allow prices to decline should 1.1350 hold strong today.
Levels to watch/live orders:
- Buys: Flat (Stop loss: N/A).
- Sells:1.1350 [Tentative – confirmation required] (Stop loss: dependent on where one confirms this level).
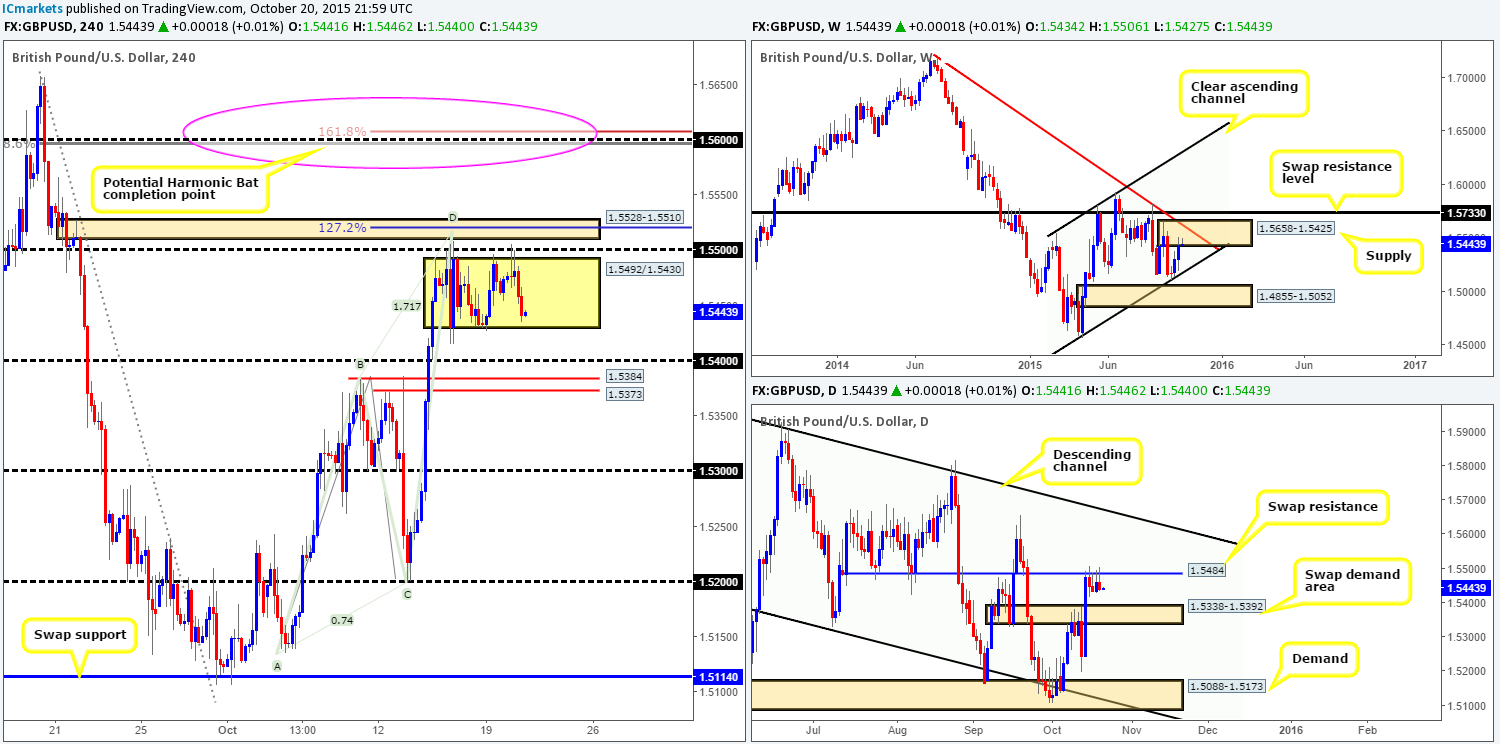
GBP/USD:
For those who read our previous report (http://www.icmarkets.com/blog/tuesday-20th-october-daily-technical-outlook-and-review/), you may recall that we had a live short still in the market from 1.5506 taken last Thursday. This trade was stopped out at breakeven yesterday as price stabbed above the current consolidation (1.5492/1.5430) before selling off from just above the 1.5500 number deep into the range. Well done to any of our readers who managed to lock in a short from this level as 1.5500 was a noted figure to watch for confirmed shorts in yesterday’s analysis.
Seeing as price is now trading around the lower limits of the aforementioned range, where do we see Cable headed today? Well, given that weekly action is kissing the underside of supply right now at 1.5658-1.5425, and the daily timeframe shows price hovering beneath a swap resistance barrier at 1.5484, buying from the 4hr range support is not something we’d be comfortable with.
In the event of a breakout below this range today, however, traders need to remain vigilant. Following a break lower, price faces almost immediate support from not only the 1.5400 figure, but also two closely-knit swap support levels at 1.5384/1.5373 (surrounded by a daily swap demand barrier at 1.5338-1.5392).As such, unless price revisits 1.5500 or the supply positioned above it at 1.5528-1.5510 for potential shorts today, we’ll happily remain flat for the time being.
Levels to watch/ live orders:
- Buys: Flat (Stop loss: N/A).
- Sells:1.5500 [Tentative – confirmation required] (Stop loss: dependent on where one confirms this level) 1.5528-1.5510 [Tentative – confirmation required] (Stop loss: dependent on where one confirms this area).
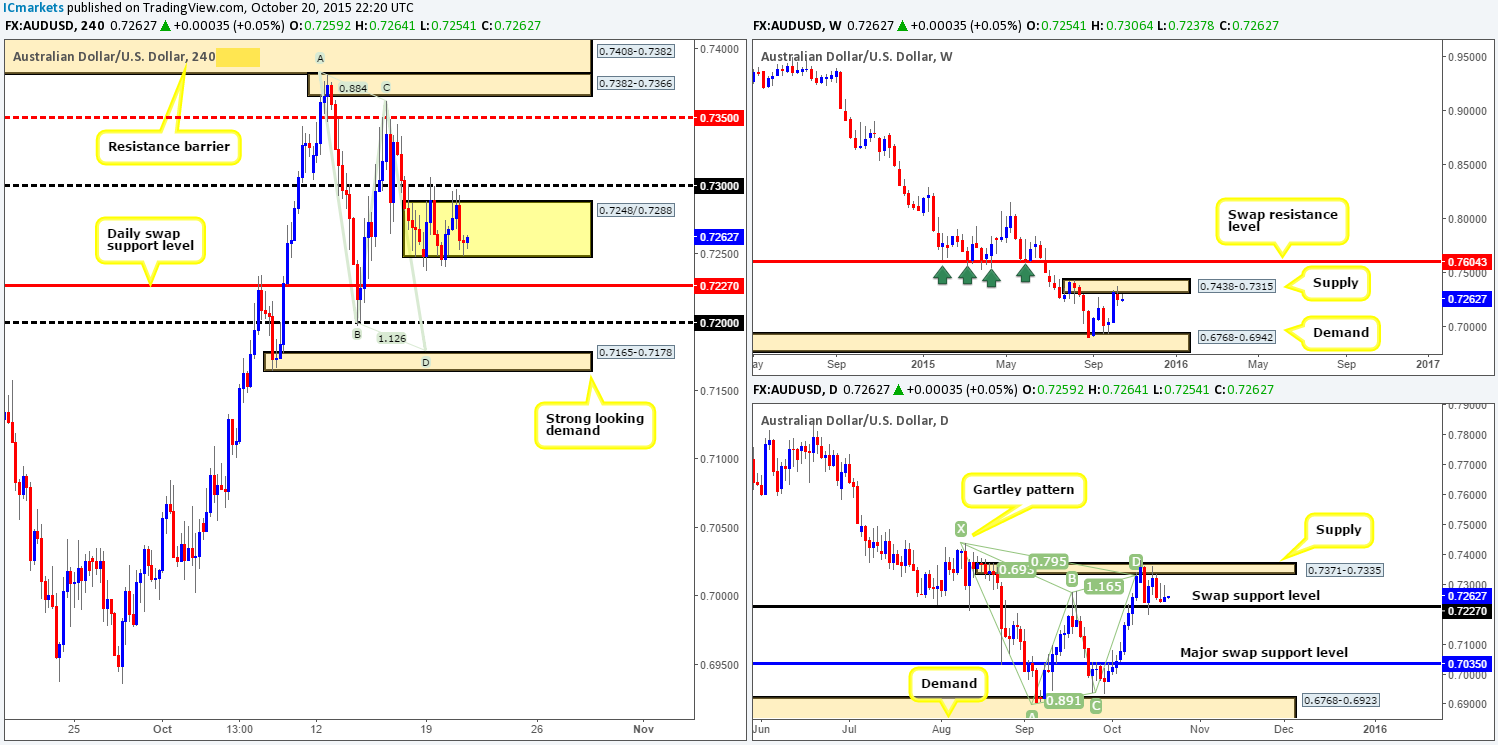
AUD/USD:
Recent action on the Aussie dollar shows price has entered into a phase of consolidation fixed between 0.7248/0.7288. The AB=CD pattern drawn on the chart is, in our opinion, now considered invalid. We like to see symmetry within this pattern and the above said consolidation put an end to any symmetry being seen on this pair for now.
Going forward, market activity is now trading around the lower limits of the above said range, and is, as we write, seen holding firm. In regard to price trading at a possible buy zone right now, what’s the situation like over on the higher timeframe picture? High up on the weekly, we can see supply at 0.7438-0.7315 currently holding this pair lower. Down on the daily timeframe, however, price is seen hovering just above a swap support level coming in at 0.7227.
That being the case, selling any breakout below the current range may not be such a good idea. By shorting here you would be selling right into the aforementioned daily swap support barrier! Granted this swap support level may eventually give way due to selling pressure from weekly supply, but the daily level will likely produce enough of a bounce to take out any 4hr breakout shorts one takes! It is just not worth the risk if you ask us.
Given the structure of this pair on all three timeframes, we’ll remain on the sidelines and wait for further developments.
Levels to watch/ live orders:
- Buys:Flat (Stop loss: N/A).
- Sells:Flat (Stop loss: N/A).
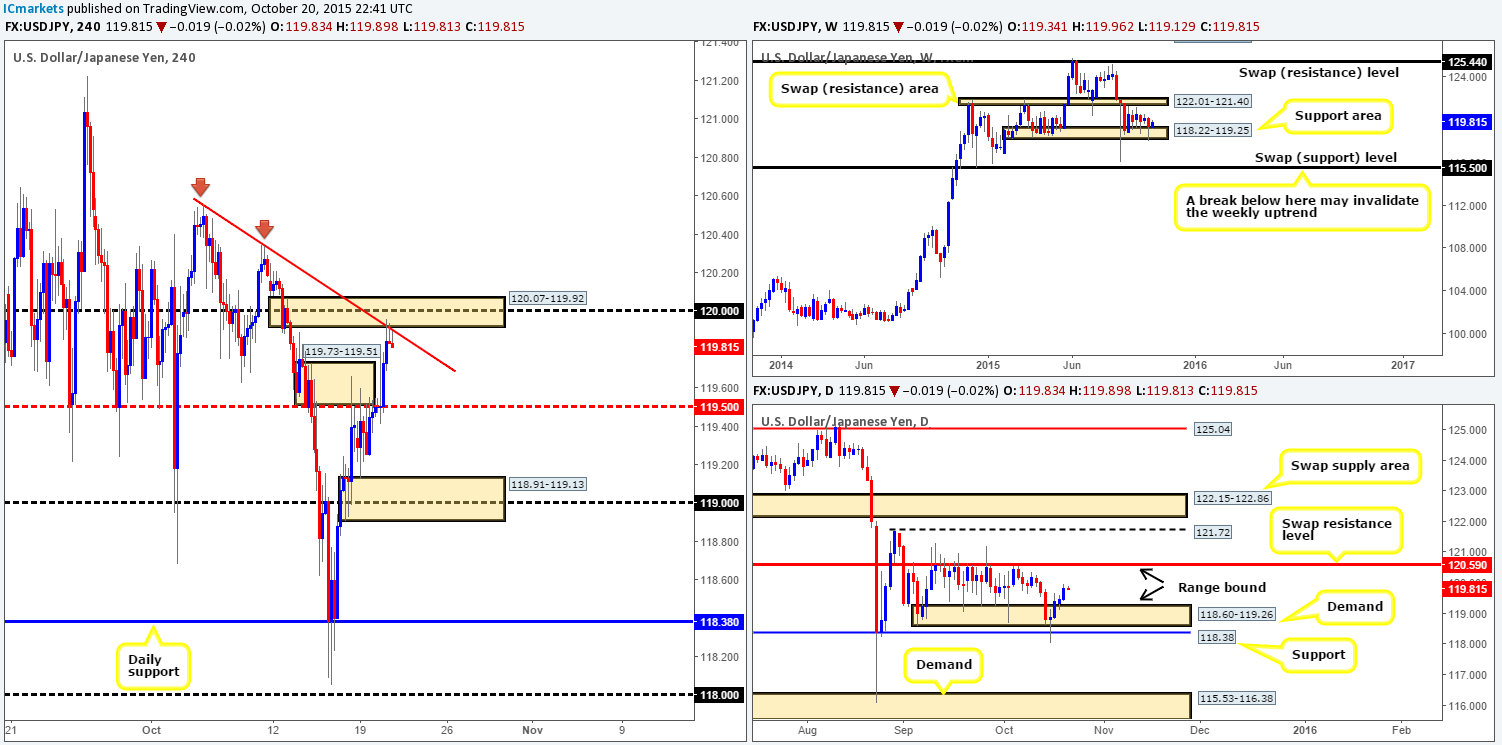
USD/JPY:
Starting from the top this morning, the weekly timeframe shows price is currently rebounding from weekly range support drawn from 118.22-119.25. On the other side of the spectrum, price on the daily timeframe is considered, at least by us, mid-range between demand at 118.60-119.26 and a swap resistance level at 120.59.
Turning our attention to the 4hr timeframe reveals price continued to rally north yesterday (as reported it may do in our previous analysis: http://www.icmarkets.com/blog/tuesday-20th-october-daily-technical-outlook-and-review/), consequently punching through offers within supply at 119.73-119.51, and hitting a relatively confluent area of supply at 120.07-119.92 (trendline convergence from the high 120.55/psychological resistance seen deep within at 120.00).
Looking to sell from this current area of supply may well be inviting due to its converging structures. However, when one takes into account the higher timeframe position of this pair (see above in bold), selling this market does not seem as attractive as it does from the 4hr. The most we see the market bouncing to from here is the top-side of the recently broken supply at 119.73.
Therefore, in the absence of clearer price action, opting to stand on the sidelines is the route we’ve chosen to take today.
Levels to watch/ live orders:
- Buys:Flat (stop loss: N/A).
- Sells: Flat (stop loss: N/A).
USD/CAD:
A strong ceiling of offers was hit just below mid-level resistance 1.3050 during the early hours of yesterday’s sessions. This sent the Loonie southbound, eventually smashing through large psychological support 1.3000 and testing a swap demand base at 1.2948-1.2928, which, as you can see, was clearly enough to support a counter-attack back up to 1.3000 by the day’s end.
As far as we can see, there are several attractive levels to be watching on this pair today/this week. For ease, we have listed them in bullet-point form:
Sells:
- Frist up is 1.3000. Price has just recently stabbed the underside of this number and is so far holding nicely. This could be a level to look for confirmed shorts today, since it ties in nicely with the weekly ignored Quasimodo swap level at 1.3014.
- Mid-level resistance 1.3050 (waiting for confirmation is recommended). This barrier has provided adequate support and resistance to this pair over the past couple of months, thus deserving its place here on our list.
- Supply coming in at 1.3074-1.3059. Although this zone is located deep within the daily supply at 1.3074-1.3025, the spike/wick above this area seen marked with a red arrow at 1.3079 is concerning. Therefore, if you’re looking to short this zone, we would still wait for the lower timeframe selling strength to present itself before risking capital.
- We absolutely love the supply area at 1.3134-1.3097. Reason being is because not only does this zone surround a weekly swap (resistance) level at 1.3128, it is also a lovely area to facilitate a fakeout. What we mean by this is stops from traders looking to short the daily supply area at 1.3074-1.3025are likely positioned just below the 4hr supply at 1.3134-1.3097 – an absolutely perfect base of liquidity to short into. We would, dependent on the time and day and how price approaches this zone, likely consider going short at market here since there is enough confluence to justify such an order in our opinion.
Buys:
- Psychological support 1.2900 looks an interesting level. Not only was it respected beautifully as support on the retest seen on Monday, it also resides within a daily Quasimodo barrier coming in at 1.2859-1.2915.
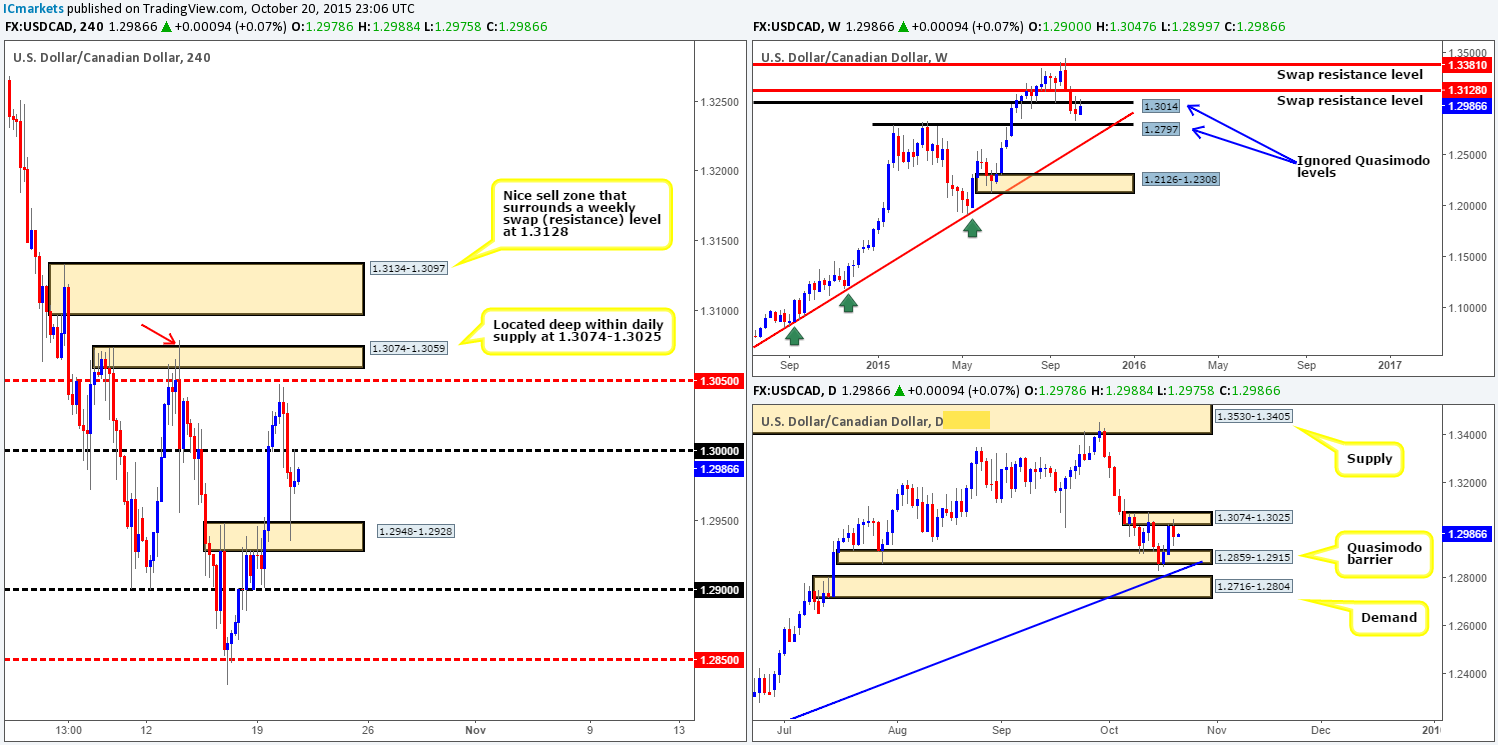
Levels to watch/ live orders:
- Buys:1.2900 [Tentative – confirmation required] (Stop loss: dependent on where one confirms this level)
- Sells:1.3000 [Tentative – confirmation required] (Stop loss: dependent on where one confirms this level) 1.3050 [Tentative – confirmation required] (Stop loss: dependent on where one confirms this level) 1.3074-1.3059 [Tentative – confirmation required] (Stop loss: dependent on where one confirms this area) 1.3093 (Stop loss: 1.3138).
USD/CHF:
The rebound from supply at 0.9585-0.9571, as can be seen from the chart, did eventually fuel further selling going into yesterday’s London session. Mid-level support at 0.9550 was consumed which in turn saw price attack psychological support 0.9500. It was from this point – mid-way through London, did we see buyers coming into this market, and buy they did! The mid-level number 0.9550 was taken out once again and price connected with the aforementioned supply, winding up closing the day unchanged at 0.9560.
In all honesty, this pair is relatively difficult to read right now. On the one hand we have weekly action displaying bullish intent from just above a swap support level at 0.9450, and on the other daily action is currently seen residing deep within a swap resistance area coming in at 0.9526-0.9585. Therefore, selling from the 4hr supply mentioned above at 0.9585-0.9571 is a little too risky for our liking, especially with a potentially problematic bids sitting just below at 0.9550.
The only area that really jumps out to us at the moment is the fresh 4hr supply zone drawn from 0.9645-0.9627 (located deep within daily supply at 0.9645-0.9606). But, even here corresponding lower timeframe confirmation is needed since we would, at that point, be potentially selling to weekly buyers!
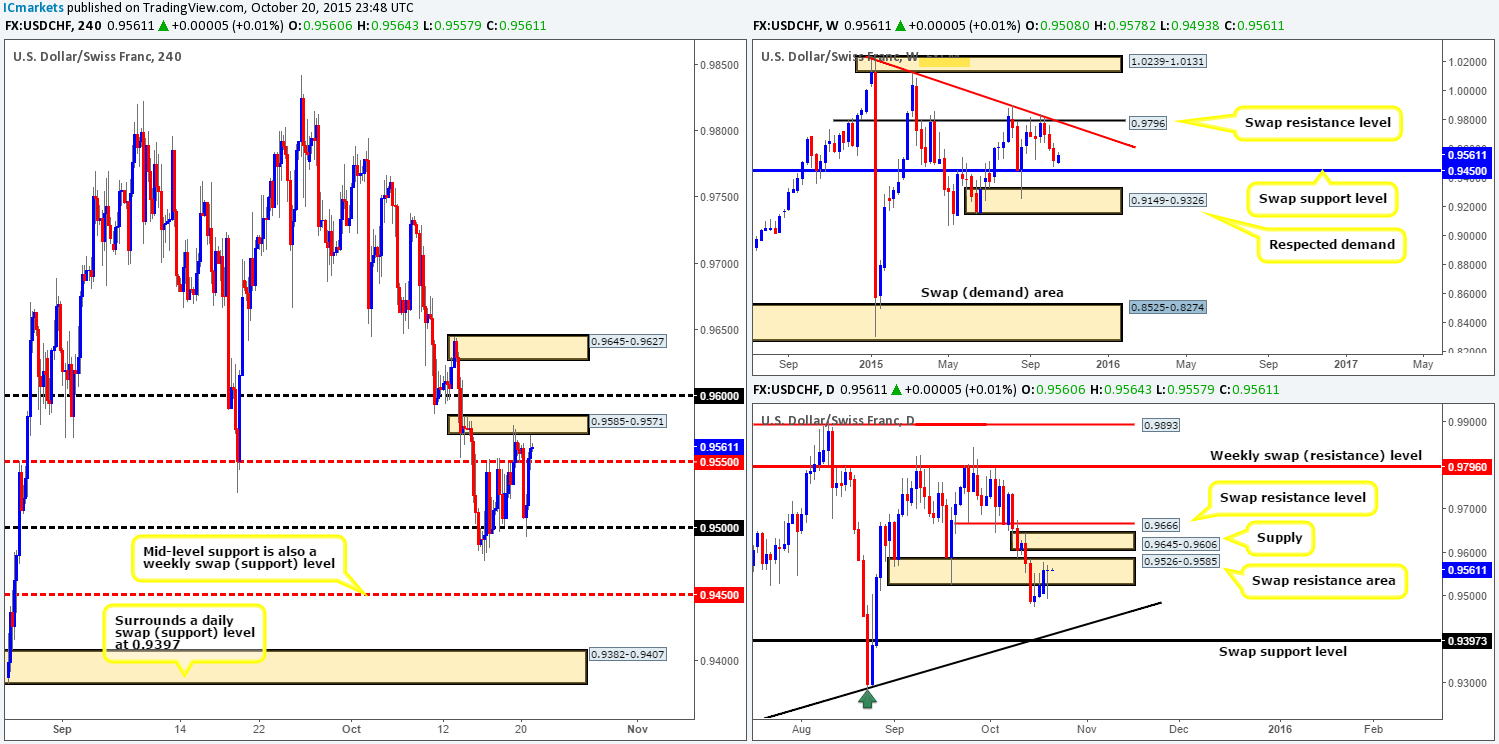
Levels to watch/ live orders:
- Buys: Flat (Stop loss: N/A).
- Sells:0.9645-0.9627 [Tentative – confirmation required] (Stop loss: dependent on where one confirms this area).
DOW 30:
Beginning with a look at the weekly timeframe this morning, we can still seethat following last week’s close above the swap resistance level at 17135, price is, at least for the time being, respecting this level as support. From this angle, the next upside target to reach falls in around supply at 17628-17486.
As far as we can see, there is very little difference between the weekly and daily timeframe at the moment. The only two things we see that is more obvious from the daily chart are the target supply and the current approach. Should the buyers manage to hold above the aforementioned weekly swap (resistance) level, the next area of supply to watch comes in a little lower than its weekly counterpart at 17574-17475. Furthermore, there is also a relatively clear Harmonic AB=CD bearish pattern currently forming, completing a few points above the aforementioned daily supply at 17612.
From the 4hr chart, however, we get a clearer view of just how well-bid 17135 is at the moment. During the early hours of yesterday’s London session, price came so very close to retesting this weekly level for the third time, reaching lows of 17141. This was certainly close enough for us, as a few hours after this, there was beautiful m15 price action confirmation to enter long. The m15 high 17205 was taken out, and we entered on the retrace back into m15 demand at 17142-17151. Our entry was beautifully filled at 17153 and price rocketed north. Now, before anyone begins calculating the super risk/reward here, we did not place our stop below the m15 demandunfortunately. The stop was set below Friday’s 4hr low (17104) at 17101.
Ultimately, our plan of attack regarding this trade is ‘set-and-forget’ at least until price either reaches our first take-profit level at 17344 (50% will be taken off here), or stops us out for a loss.
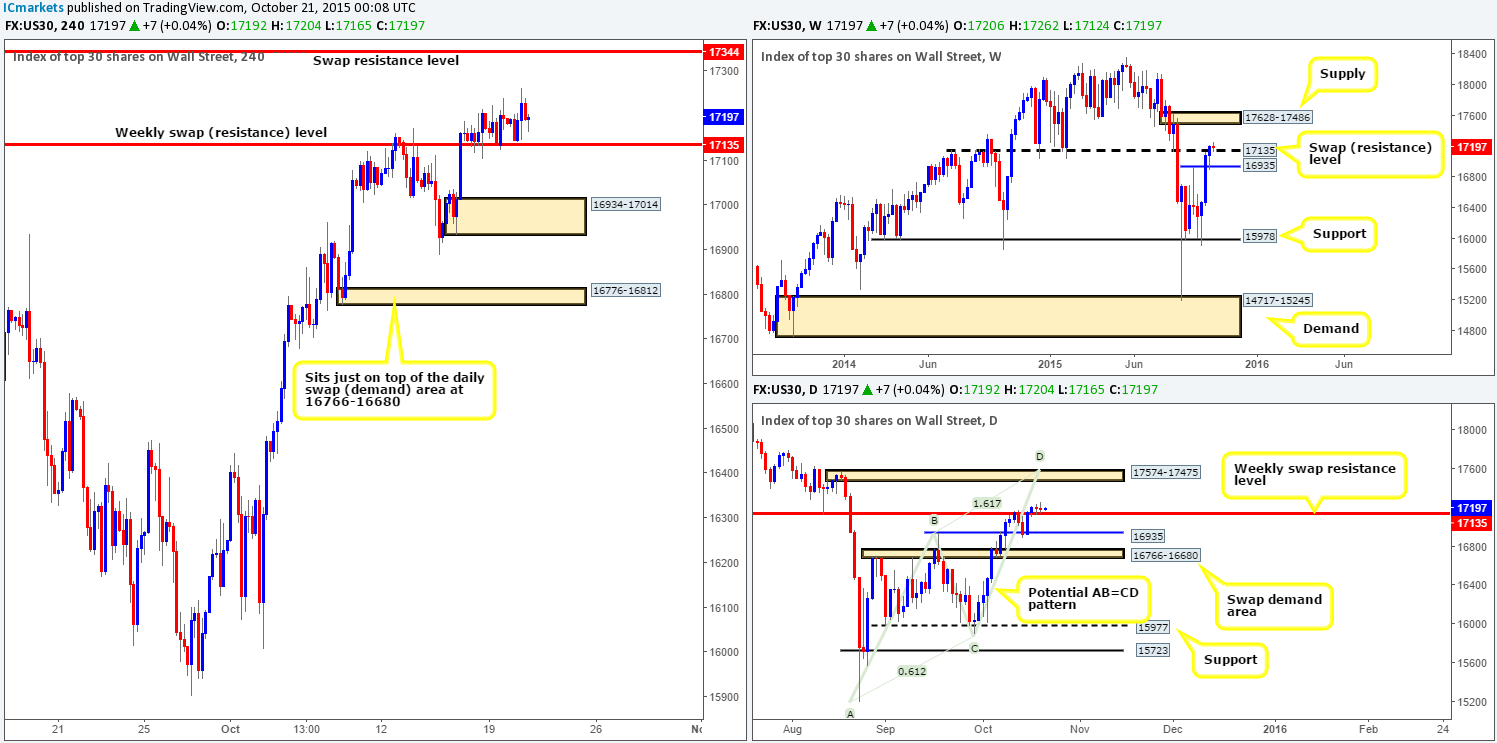
Levels to watch/ live orders:
- Buys: 17153 [LIVE] (Stop loss: 17101).
- Sells:Flat (Stop loss: N/A).
XAU/USD: (Gold)
Coming at you directly from the weekly timeframe this morning shows that Gold remains nibbling at the underside of weekly supply drawn from 1205.6-1181.2.This zone, as we mentioned in our previous weekly report, is a perfect barrier to look for shorts back down to 1157.4 – now acting support. It not only converges with a bearish Harmonic AB=CD pattern (1199.4), but also with the underside of a long-term trendline extended from the high 1488.0.
Turning our attention to the daily timeframe, the action here is now fixed between supply coming in at 1187.6-1179.6, and a swap demand area seen at 1169.8-1154.7.
Winding down to the 4hr timeframe, however, we can see that during the course of yesterday’s sessions, Gold rallied from the swap demand area at 1169.8-1162.5, reaching highs of 1180.6 on the day. Assuming that Gold continues to rally, surpassing the swap resistance level at 1187.5 and up to supply at 1205.6-1200.4, we’d have no hesitation in shorting at market from this zone. Here’s why:
- Located deep within both weekly and daily supply (see above in bold).
- Also converges nicely with the aforementioned weekly Harmonic AB=CD bearish pattern (see above).
- In addition to point two, there is a potential 4hr Harmonic AB=CD bearish pattern forming with a completion zone seen in green at 1202.3/1207.1.
Of course, the above said 4hr supply zone is a little way off for now, but is certainly something to keep your eye on! In regard to today’s battle lines, we are once again watching the swap demand area at 1169.8-1162.5 (located within a daily swap demand area at 1169.8-1154.7), and also the swap resistance level at 1187.5. For trades taken at either of the above said levels, we would advise waiting for lower timeframe confirmation due to the following:
- A trade short from 1187.5 is susceptible to a fakeout as we saw last Thursday.
- The swap demand base at 1169.8-1162.5 may have held price once already but that does not mean it will happen again. Be prepared for a fake below here, which, as a result will see price trade very deep within the daily swap demand base mentioned above at 1169.8-1154.7.
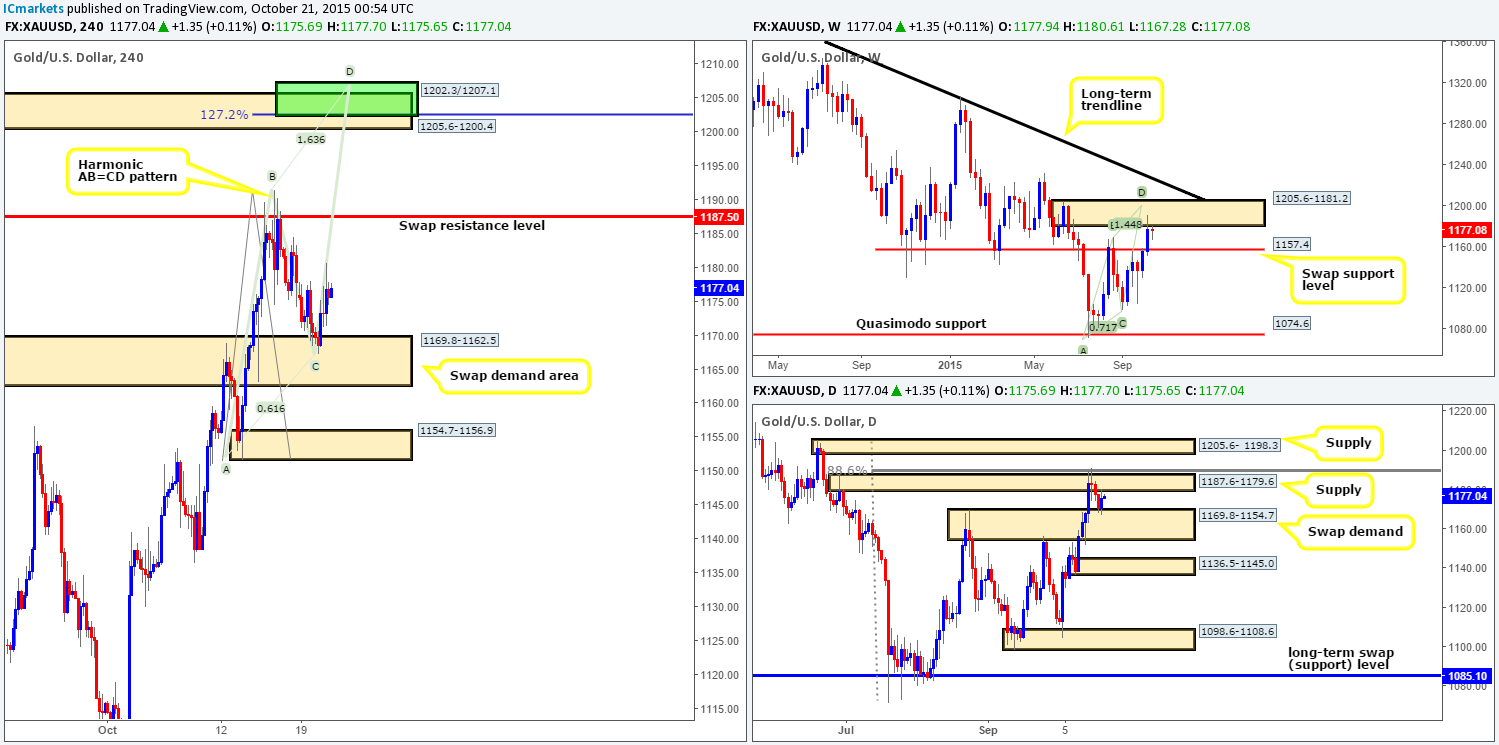
Levels to watch/ live orders:
- Buys:1169.8-1162.5 [Tentative – confirmation required] (Stop loss: dependent on where one confirms this zone since a fake lower could very well take place).
- Sells:1187.5 [Tentative – confirmation required] (Stop loss: dependent on where one confirms this level) 1199.5 (Stop loss: 1208.3).


