
EUR/USD:
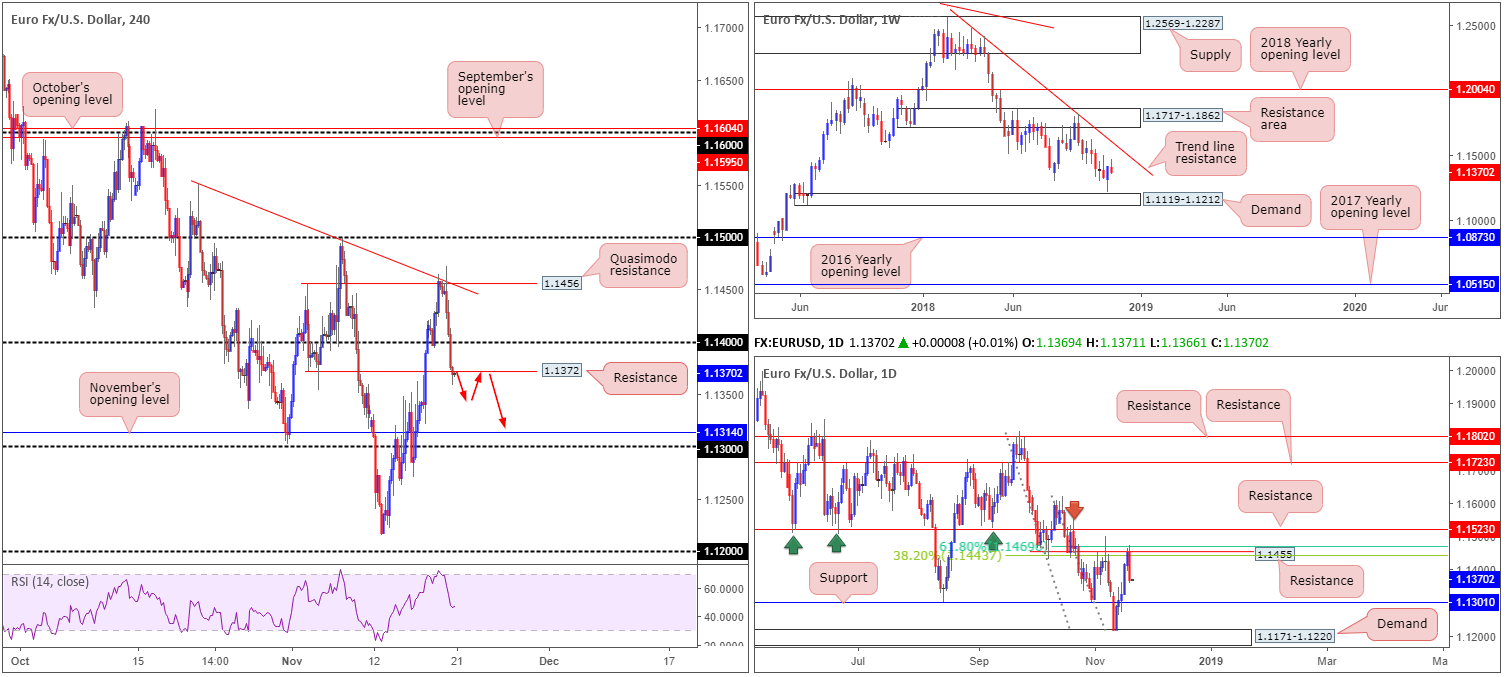
As risk aversion spreads from global stocks, the greenback stood triumphant against the bulk of its peers Tuesday. This – coupled with ongoing Italian-EU deficit divisions – directed the EUR/USD southbound, consequently losing grip of the 1.14 handle and mildly engulfing nearby H4 support found at 1.1372 (now acting resistance).
For folks who read Tuesday’s briefing you may recall the piece emphasized potential shorting opportunities from the H4 Quasimodo resistance level at 1.1456/H4 trend line resistance (taken from the high 1.1550), given its connection to the daily timeframe: daily resistance priced in at 1.1455/two daily Fibonacci resistances: 38.2%/61.8% at 1.1443 and 1.1469, respectively. Well done to any of our readers who managed to board this move – just incredible risk/reward to be had here!
According to our technical studies on the H4 and daily timeframe, additional downside could be in store. The H4 candles show the next support target rests around November’s opening level at 1.1314, trailed closely by the 1.13 handle, which happens to be accompanied by a daily support at 1.1301 (the next support on the daily timeframe). In addition to this, the USD/CHF, an inversely correlated market, is currently attempting to make headway above H4 resistance at 0.9949.
Areas of consideration:
Preferably, it’d be ideal to see the EUR/USD print more of a pivotal H4 close below 1.1372. This, followed up with a decisive retest is likely adequate to draw in sellers towards 1.13ish (see red arrows).
While aggressive traders are unlikely to wait for additional confirmation, conservative traders may opt to wait and see how price action behaves before pulling the trigger from 1.1372. A bearish candlestick formation would not only help confirm seller intent, it’d also provide entry/stop parameters.
Today’s data points: US core durable goods orders m/m; US revised UoM consumer sentiment.
GBP/USD:
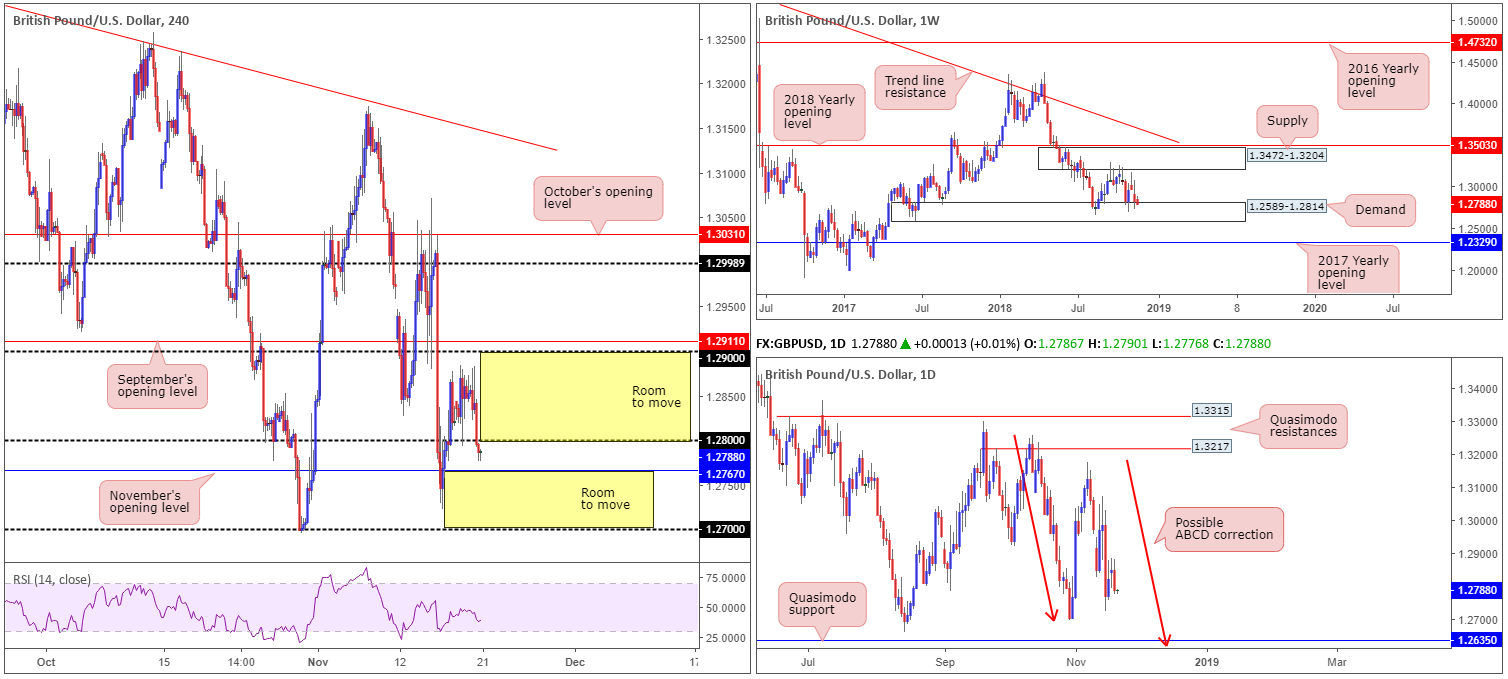
Amidst heightened risk aversion, resurgent USD demand and what seems a never-ending stream of Brexit drama, the pound turned lower Tuesday, reclaiming 1.28 at the closing stages of the day. Despite a relatively upbeat speech from BoE Governor Mark Carney, growing concerns over Spain’s claim over Gibraltar have since weighed on sentiment.
Technically speaking, little change is observed in regard to higher-timeframe structure:
Weekly price, as highlighted in previous reports, remains limited to a consolidation carved from demand at 1.2589-1.2814 and a supply drawn from 1.3472-1.3204 (price is currently testing the lower edge of this range). A closer look at price action on the daily timeframe, nevertheless, shows the unit positioned within close proximity to the 1.2695 Oct 30 low. While a response from this neighbourhood is possible, the Quasimodo support seen at 1.2635 remains an appealing level, given the amount of stop-loss orders likely positioned beneath the said low and the 1.2661 Aug 15 low (taking out these stops provide liquidity for pro money to buy), along with a possible ABCD approach (red arrows) terminating just south at 1.2614.
A closer read of price action on the H4 timeframe, however, brings November’s opening level at 1.2767 into the spotlight. Should 1.28 hold as resistance, 1.2767 may be overthrown, leaving the runway reasonably clear to approach the 1.2723 Nov 15 low/1.27 handle.
Areas of consideration:
While H4 price action is reasonably cramped at the moment, lower-timeframe traders may find an opportunity to fade the underside of 1.28 and target November’s opening level at 1.2767.
A H4 close back above 1.28 today, nevertheless, has yesterday’s highs of 1.2883 to target, followed closely by 1.29. A retest of 1.28 as support is likely to secure buyer interest – even more appealing would be if the retest formed in the shape of a bullish candlestick pattern.
The research team here is also looking at the possibility of a break of 1.2767, possibly freeing downside towards 1.27ish. Similar to above, a retest of 1.2767 (by way of a candlestick pattern) as resistance is likely to secure seller interest.
Today’s data points: UK public sector net borrowing; US core durable goods orders m/m; US revised UoM consumer sentiment.
AUD/USD:
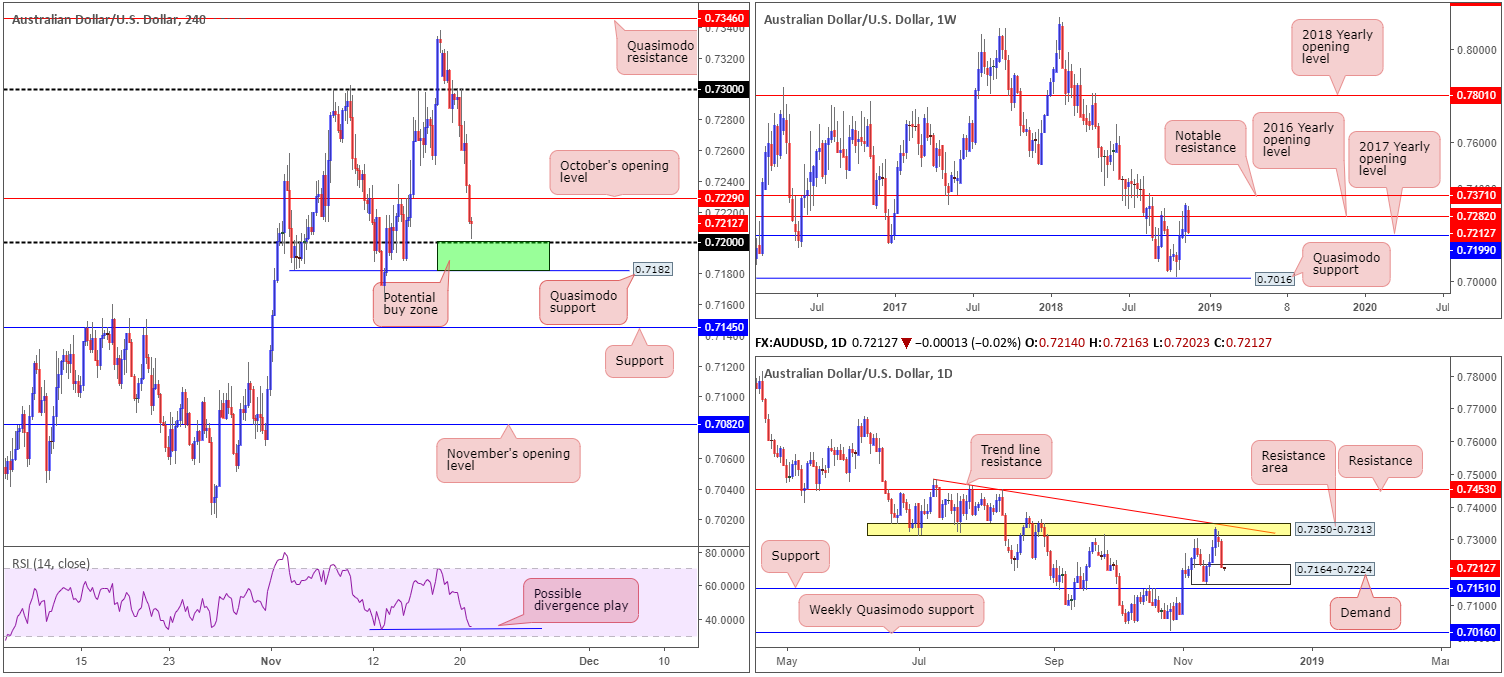
In wake of the RBA minutes emphasizing an on-hold policy stance, along with resurgent USD demand, the commodity currency tumbled lower in lock-step with declining stocks Tuesday. Extending losses from recent 0.73+ peaks, the H4 candles captured October’s opening level at 0.7229 and are currently seen hovering just north of the 0.72 handle.
0.72 is likely an interesting level for buyers this morning. On the weekly timeframe, you’ll see the 2017 yearly opening level at 0.7199 converges with the psychological number. Daily movement is also seen trading within the walls of a demand zone coming in at 0.7164-0.7224. Further adding to this, we also have a H4 Quasimodo support seen positioned nearby at 0.7182 and a possible divergence play out of the RSI indicator.
Areas of consideration:
Keeping it Simple Simon this morning, all three timeframes point to a possible recovery move off 0.72ish today. The area between the H4 Quasimodo support mentioned above at 0.7182 and the round number 0.72 (green) is, according to the overall market picture, considered a high-probability reversal zone.
Conservative traders may opt to wait and see how H4 price action behaves before pulling the trigger. A bullish candlestick formation would help confirm buyer interest, and also provide entry/stop parameters. Aggressive traders, on the other hand, may have eyes on 0.72 as an entry point with stop-loss orders planted a few pips beyond 0.7182. That’s a 20-pip stop (including spread), which offers nearly a 1:1:5 move to the underside of October’s opening level at 0.7229 (initial take-profit target) in terms of risk/reward.
Today’s data points: US core durable goods orders m/m; US revised UoM consumer sentiment.
USD/JPY:
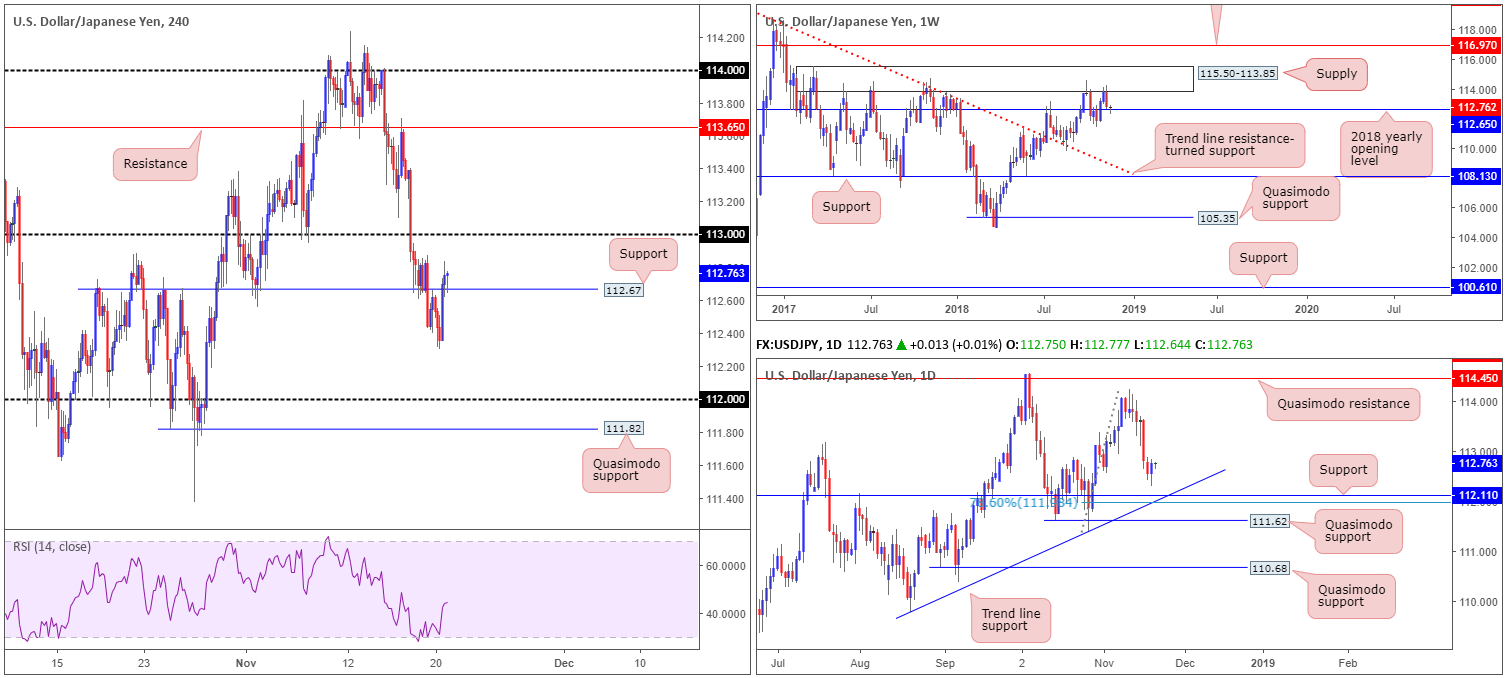
USD/JPY movement clocked fresh November lows of 112.31 Tuesday, after retesting the underside of 112.67 on the H4 timeframe, as risk aversion dominated markets. Despite this, sentiment turned positive as the market entered US trade, reclaiming 112.67, which, as you can see, is now being retested as support. Defensive buying off this level could lead to the 113 handle entering the fight. Beyond 113, the team sees little in terms of resistance until reaching 113.65.
Although daily flow shows room to continue pressing lower towards support at 112.11, weekly price is seen respecting its 2018 yearly opening level at 112.65 with the next upside target residing around supply at 115.50-113.85.
Areas of consideration:
Buying this market remains a challenge, despite where the unit is trading from on the weekly timeframe. The chief reason behind this is the 113 handle could act as resistance and hinder upside, as well as the threat of further selling on the daily timeframe. To prove buyer intent off the current weekly support, the team has noted to watch for a H4 close above 113. This – coupled with a retest (preferably by way of a bullish candlestick signal as this helps provide entry/stop parameters) – would likely be sufficient enough to condone a long, targeting H4 resistance mentioned above at 113.65, followed by the underside of weekly supply at 113.85.
Today’s data points: US core durable goods orders m/m; US revised UoM consumer sentiment.
USD/CAD:
Up 1.04% on the day, the USD/CAD aggressively advanced northbound Tuesday on the back of a healthy USD across the board, along with a collapse observed in crude oil prices and comments from BoC’s Wilkins. Wilkins announced the central bank will review monetary policy framework in the run up to late 2021, indicating it is open to major changes.
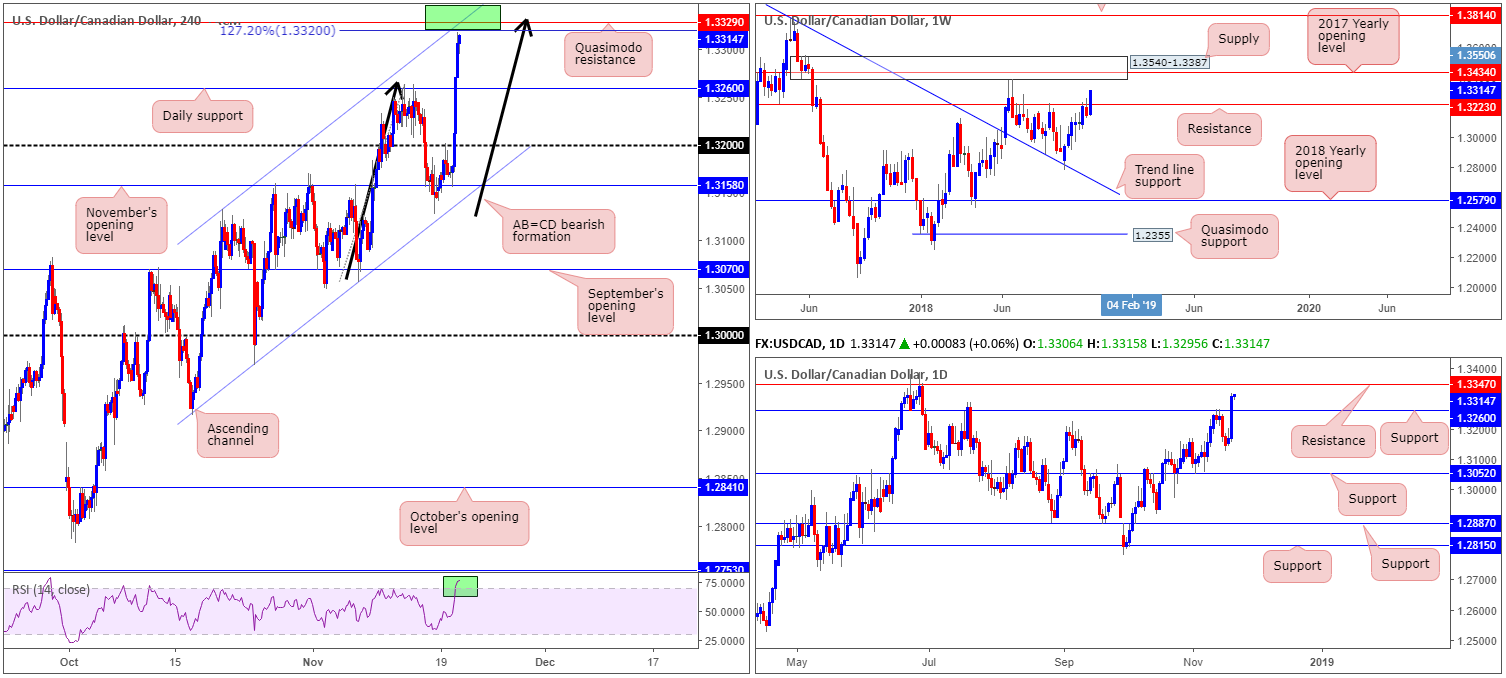
In terms of weekly price, recent buying brought the market above resistance at 1.3223, with supply at 1.3540-1.3387 in view as the next upside target. Daily movement, on the other hand, overthrew resistance at 1.3260 (now acting support), potentially clearing the runway towards resistance plotted at 1.3347.
Here’s where it gets interesting! H4 price is currently hovering just south of a Quasimodo resistance level at 1.3329, which joins nicely with an AB=CD (black arrows) 127.2% bearish pattern at 1.3320 and a channel resistance (taken from the high 1.3132). This area – coupled with the nearby daily resistance mentioned above at 1.3347 (green H4 zone) – provides an awesome area of interest for sellers today.
Areas of consideration:
Should the market witness a H4 bearish candlestick formation take shape out of 1.3347/1.3320 today, this offers traders the opportunity to sell this market, targeting daily support at 1.3260 as the initial downside target.
The reason behind requiring additional candlestick confirmation simply comes down to the possibility of further buying being seen on the weekly timeframe towards the lower edge of weekly supply at 1.3387.
Today’s data points: US core durable goods orders m/m; US revised UoM consumer sentiment; Crude oil inventories.
USD/CHF:
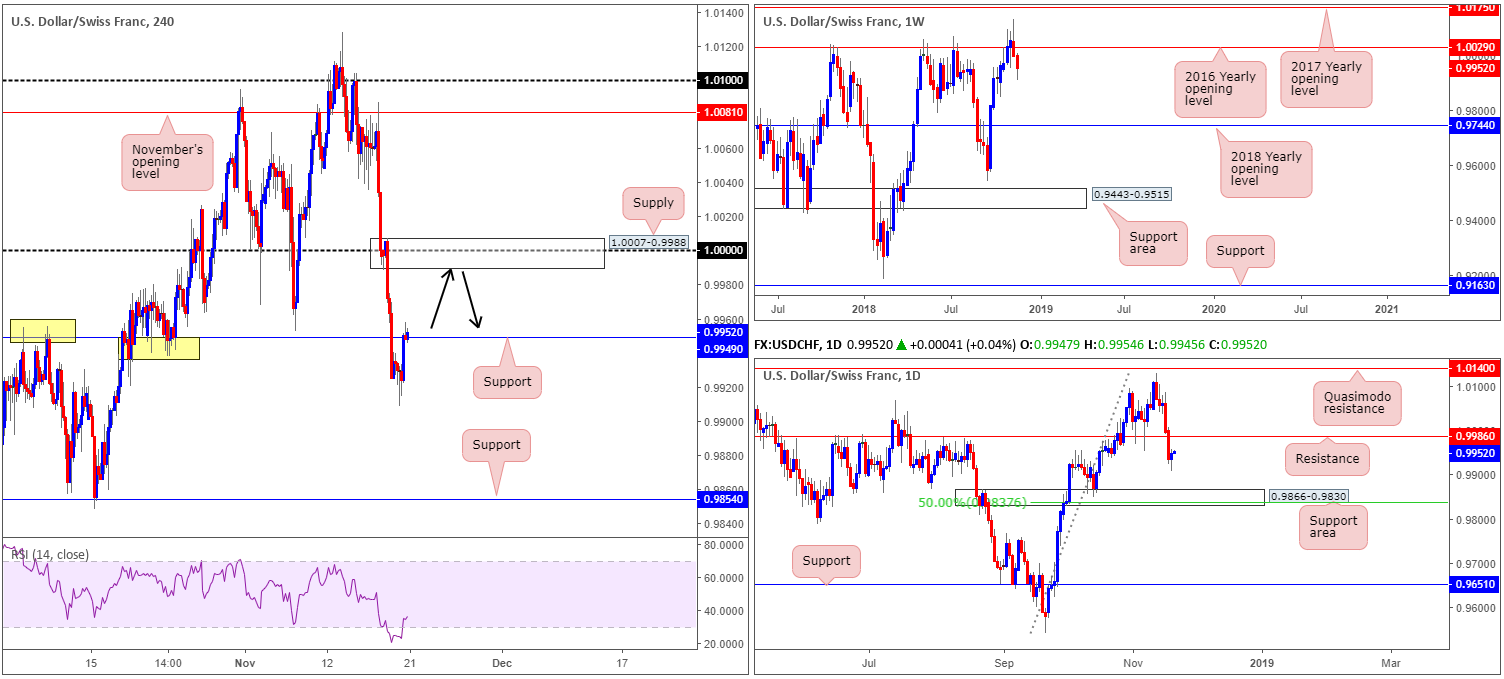
Having observed the US dollar index gravitate towards its upper 96s Tuesday, the USD/CHF witnessed a sharp change in mood after clocking fresh November lows of 0.9908. The H4 candles, as you can see, elbowed their way marginally above resistance at 0.9949 (now acting support). Assuming a defensive play is seen from buyers here, the next port of call falls in around parity (1.0000) on the H4 scale, though do bear in mind price could potentially fail to reach this number should sellers defend daily resistance plotted at 0.9986.
On a wider perspective, however, weekly movement continues to reflect a bearish stance beneath its 2016 yearly opening level at 1.0029, with the possibility of price pushing as far south as the 2018 yearly opening level at 0.9744.
Areas of consideration:
1.0000, in particular the H4 supply area surrounding the number at 1.0007-0.9988, is attractive for shorts today. The lower edge of the H4 supply is seen sited two pips above daily resistance at 0.9986, making it a prime location for active sellers to make an appearance.
As for stop-loss placement, above the aforementioned H4 supply appears reasonable. With respect to an initial take-profit target, H4 support at 0.9949 is a logical starting point.
Today’s data points: US core durable goods orders m/m; US revised UoM consumer sentiment.
Dow Jones Industrial Average:
Down 2.46% on the day, the Dow Jones Industrial Average recorded its second consecutive daily loss Tuesday, influenced largely on the back of a collapse in crude oil prices.
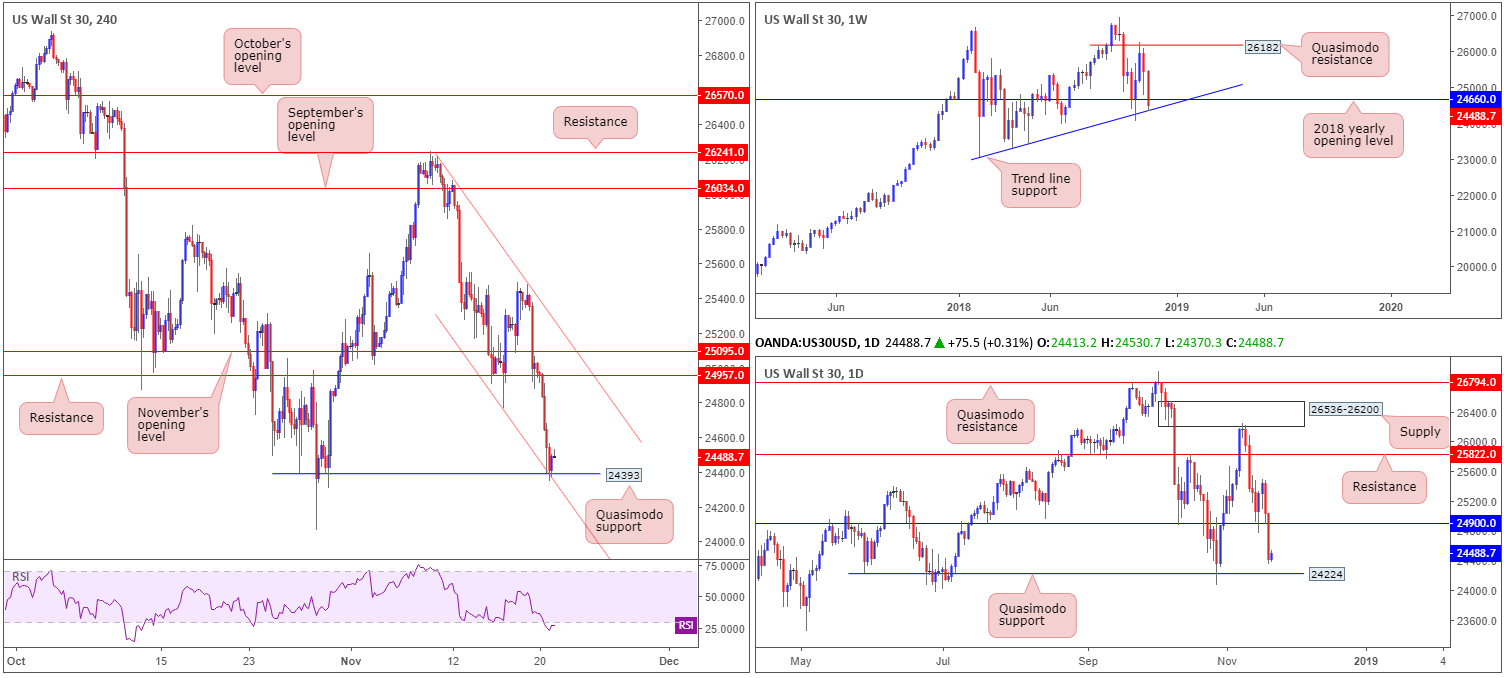
In spite of recent selling, weekly price is attempting to hold from trend line support (extended from the low 23055), which surfaces just beneath the 2018 yearly opening level at 24660. Daily price, on the other hand, displays room to probe lower before reaching notable support: a Quasimodo support at 24224.
A closer reading brings in the H4 candles, which, as is evident from the chart, are seen recovering from a Quasimodo support at 24393. This level actually lines up perfectly with the aforementioned weekly trend line support and a H4 channel support (extended from the low 24769). Therefore, there’s a strong chance we may observe a move north from here towards H4 resistance at 24957.
Areas of consideration:
Although daily price shows room to push lower, the combination of weekly and H4 support is attractive.
Aggressive traders may look to enter at current price, with stops tucked beneath yesterday’s low 24345, with a target objective set at 24957.
Conservative traders, however, might be looking for additional candlestick confirmation before pulling the trigger. As of now, we do have a completed bullish inside candle pattern formed, which could be enough to draw in buyers to push higher.
Today’s data points: US core durable goods orders m/m; US revised UoM consumer sentiment.
XAU/USD (Gold):
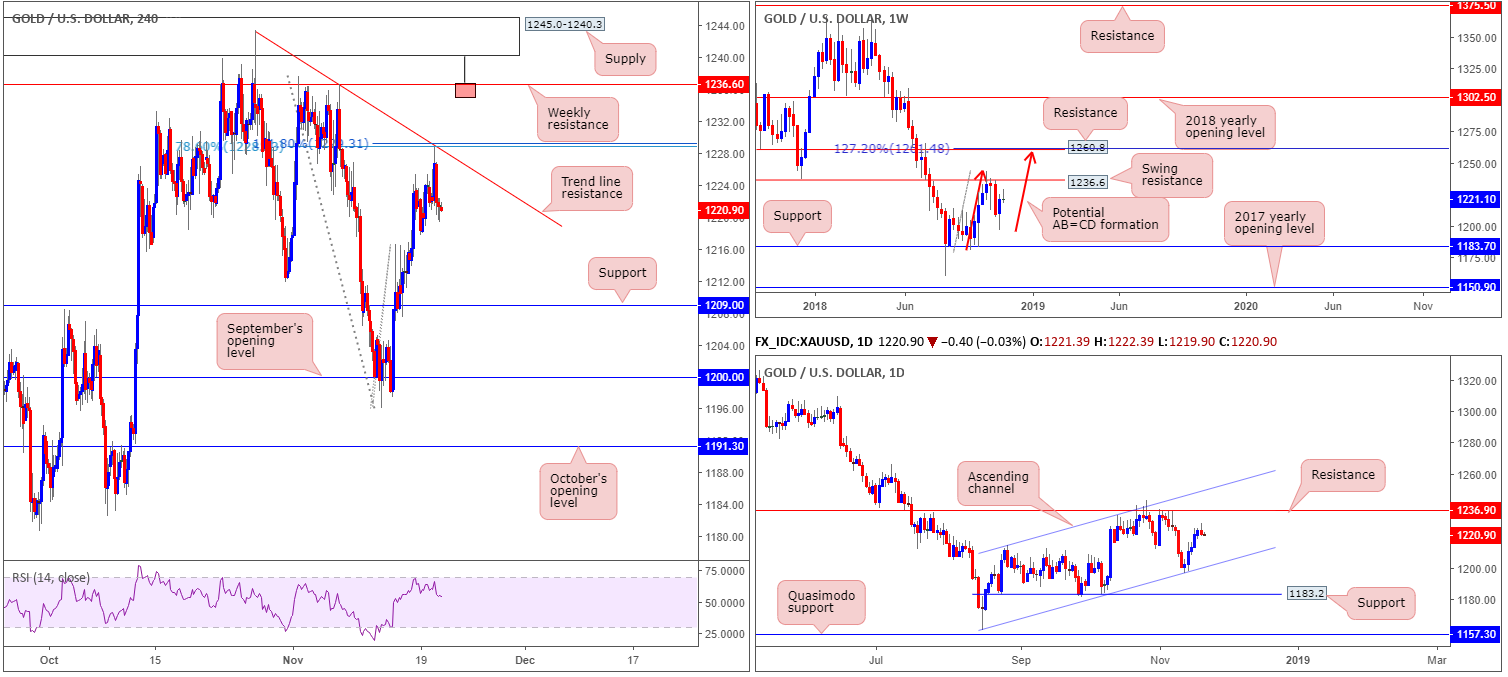
As is visible from the H4 timeframe this morning, broad-based USD buying allowed bullion to fade nearby trend line resistance (extended from the high 1243.4) Tuesday, and its converging 78.6% Fib resistance at 1228.7/161.8% Fib ext. point at 1229.3.
Assuming further selling takes shape, the H4 candles have support at 1209.0 in view, followed then by September’s opening level at 1200.0. Whether additional selling will take place, however, is difficult to judge. We say this simply because both weekly and daily timeframes exhibit room to track higher ground:
- Weekly price shows space to maneuver until swing resistance priced in at 1236.6 is brought into the mix. Another consideration worth noting on the weekly timeframe is the potential for an AB=CD (red arrows) 127.2% bearish formation to complete just north of another layer of resistance (1260.8) at 1261.4.
- Looking at this market in more detail, we can see the yellow metal is currently compressing within an ascending channel formation (1160.3/1214.3) on the daily timeframe, with the candles possibly working their way towards a test of resistance at 1236.9 (essentially representing the weekly swing resistance mentioned above at 1236.6).
Areas of consideration:
With the above in mind, the research team still feels bullion is likely to press higher.
While a bounce from the current H4 trend line resistance has taken form, the majority of traders will still likely be honing in on the weekly resistance level at 1236.6. With H4 supply at 1245.0-1240.3 positioned just north of this weekly line, traders should prepare for the possibility of a fakeout play. Therefore, in the event a H4 bearish pin-bar formation take shape that pierces through the weekly resistance and tests the H4 supply (see H4 chart for a visual), this would be considered a high-probability shorting opportunity (stop-loss orders can be positioned either beyond the noted H4 supply or a few pips above the pin-bar’s wick), targeting the other side of the trend line resistance (at that point support) as an initial take-profit zone.
The use of the site is agreement that the site is for informational and educational purposes only and does not constitute advice in any form in the furtherance of any trade or trading decisions.
The accuracy, completeness and timeliness of the information contained on this site cannot be guaranteed. IC Markets does not warranty, guarantee or make any representations, or assume any liability with regard to financial results based on the use of the information in the site.
News, views, opinions, recommendations and other information obtained from sources outside of www.icmarkets.com.au, used in this site are believed to be reliable, but we cannot guarantee their accuracy or completeness. All such information is subject to change at any time without notice. IC Markets assumes no responsibility for the content of any linked site. The fact that such links may exist does not indicate approval or endorsement of any material contained on any linked site.
IC Markets is not liable for any harm caused by the transmission, through accessing the services or information on this site, of a computer virus, or other computer code or programming device that might be used to access, delete, damage, disable, disrupt or otherwise impede in any manner, the operation of the site or of any user’s software, hardware, data or property.


