
A note on lower timeframe confirming price action…
Waiting for lower timeframe confirmation is our main tool to confirm strength within higher timeframe zones, and has really been the key to our trading success. It takes a little time to understand the subtle nuances, however, as each trade is never the same, but once you master the rhythm so to speak, you will be saved from countless unnecessary losing trades. The following is a list of what we look for:
- A break/retest of supply or demand dependent on which way you’re trading.
- A trendline break/retest.
- Buying/selling tails/wicks – essentially we look for a cluster of very obvious spikes off of lower timeframe support and resistance levels within the higher timeframe zone.
- Candlestick patterns. We tend to only stick with pin bars and engulfing bars as these have proven to be the most effective.
We search for lower timeframe confirmation between the M15 the H1 timeframes, since most of our higher-timeframe areas begin with the H4. Stops are usually placed 5-10 pips beyond confirming structures.
EUR/USD:
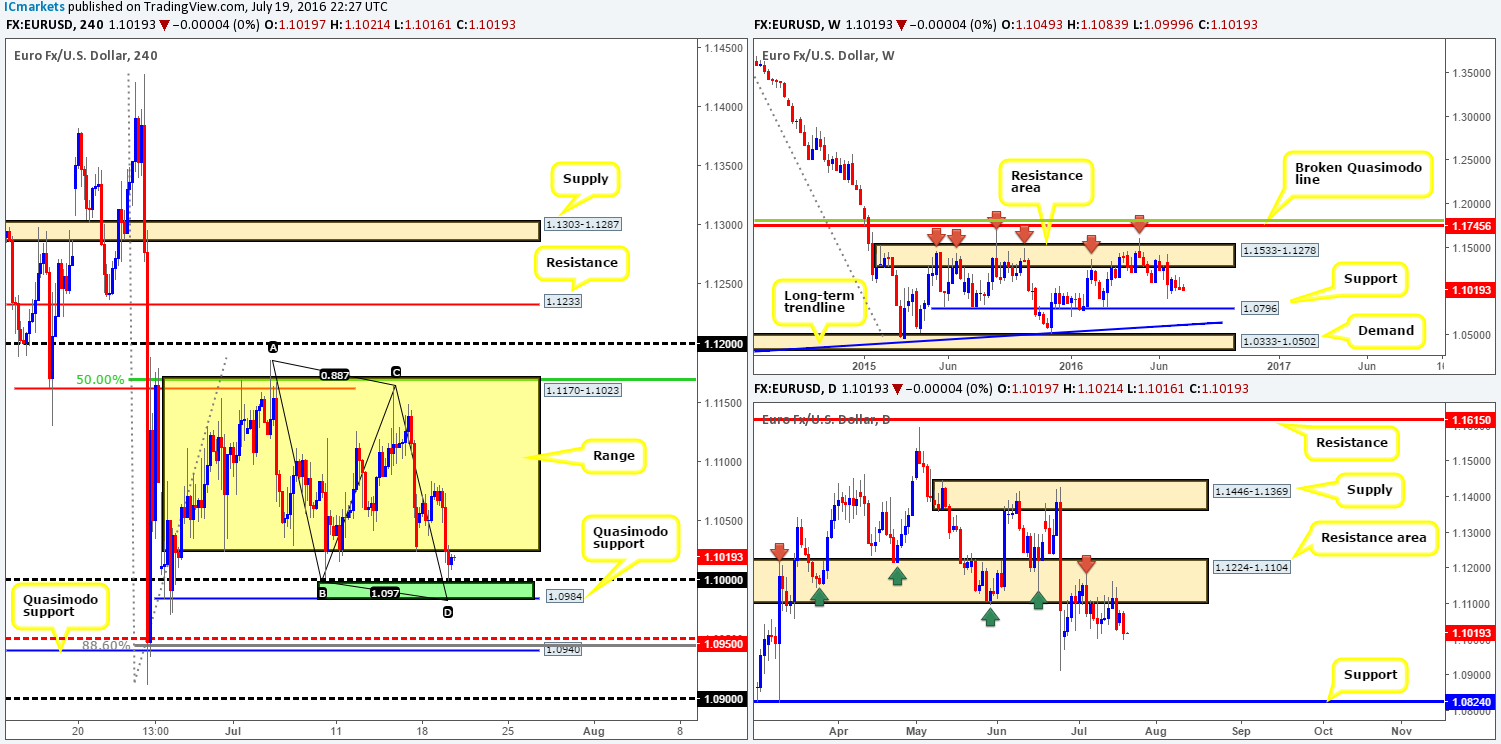
Supported by better than expected US housing data, yesterday’s action saw the EUR break below the H4 range low 1.1023 and touch base with the key figure 1.10. Although the 1.10 handle formed part of a buy zone for us (the minor H4 Quasimodo support line at 1.0984 and the H4 AB=CD completion point at 1.0979 – green area), we ultimately wanted to see price drive a little deeper into this area before looking for a lower timeframe entry. Therefore, this base along with the larger H4 Quasimodo support seen below at 1.0940 (fuses with a H4 88.6% Fib retracement line at 1.0945 and a H4 mid-way support at 1.0950) are still areas we believe that price could bounce from this week.
For all of the above though, lower prices still remain the more likely route overall. Our reasoning lies within the higher timeframe structure. The weekly chart shows space to move lower down to support drawn from 1.0796, while down on the daily chart the major is being held lower by a daily resistance area at 1.1224-1.1104. Apart from the referendum low seen at 1.0911, there’s little support stopping price from reaching the daily support chalked in at 1.0824 this week.
Our suggestions: Keep an eye on both of the aforementioned H4 support barriers this week for potential long positions. We are confident a bounce will be seen from these areas, but would still advise traders to trade cautiously (wait for lower timeframe confirmation – see the top of this report) in light of what’s been noted on the higher timeframes.
Levels to watch/live orders:
- Buys: 1.0984/1.10 [Tentative – confirmation required] (Stop loss: dependent on where one confirms this area). 1.0940/1.0950 [Tentative – confirmation required] (Stop loss: dependent on where one confirms this area).
- Sells: Flat (Stop loss: N/A).
GBP/USD:
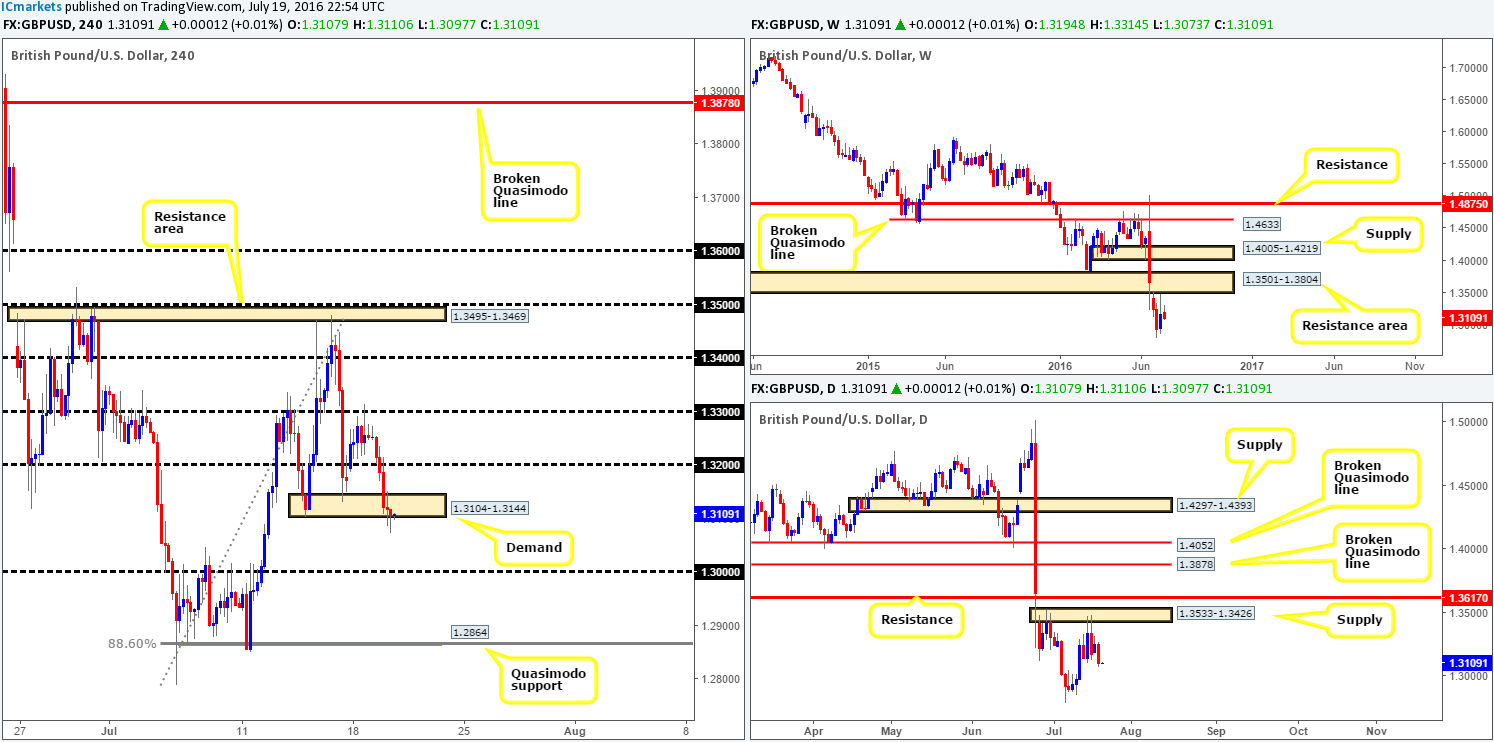
Housing data in the US reported a stronger than expected month yesterday, consequently pushing cable below the H4 demand at 1.3104-1.3144. For those who read yesterday’s report you may recall us mentioning to watch for a close below the current H4 demand base, since our team still remains in favor of further downside.
Our reasoning lies within the higher timeframe structure. Over on the weekly chart the pair continues to reflect a bearish stance after coming within a few pips of connecting with a resistance area penciled in at 1.3501-1.3804. By and large, we see little support to the left of current price until the market reaches the 1.20 region (we had to go all the way back to 1986 to find this). In line with weekly expectations of further selling, daily price struck supply at 1.3533-1.3426 (glued to the underside of the aforementioned weekly resistance area), and is currently holding this unit lower. In the event that this zone continues to suppress buying, a move down to the 1.30 area is very likely we feel.
Our suggestions: Ultimately, what we’re looking for is a CLOSE below the current H4 demand base, followed by a continuation move down to the 1.30 region. For our team to be given the green light to short below here, nevertheless, a retest of the broken H4 demand would need to be seen as well as a lower timeframe sell signal (see the top of this report for a list of lower timeframe entry techniques). The initial take-profit target would be the 1.30 mark, which is where we’d also look to reduce risk to breakeven.
Levels to watch/live orders:
- Buys: Flat (Stop loss: N/A).
- Sells: Watch for price to consume the H4 demand at 1.3104-1.3144 and look to trade any retest seen thereafter (lower timeframe confirmation required).
AUD/USD:
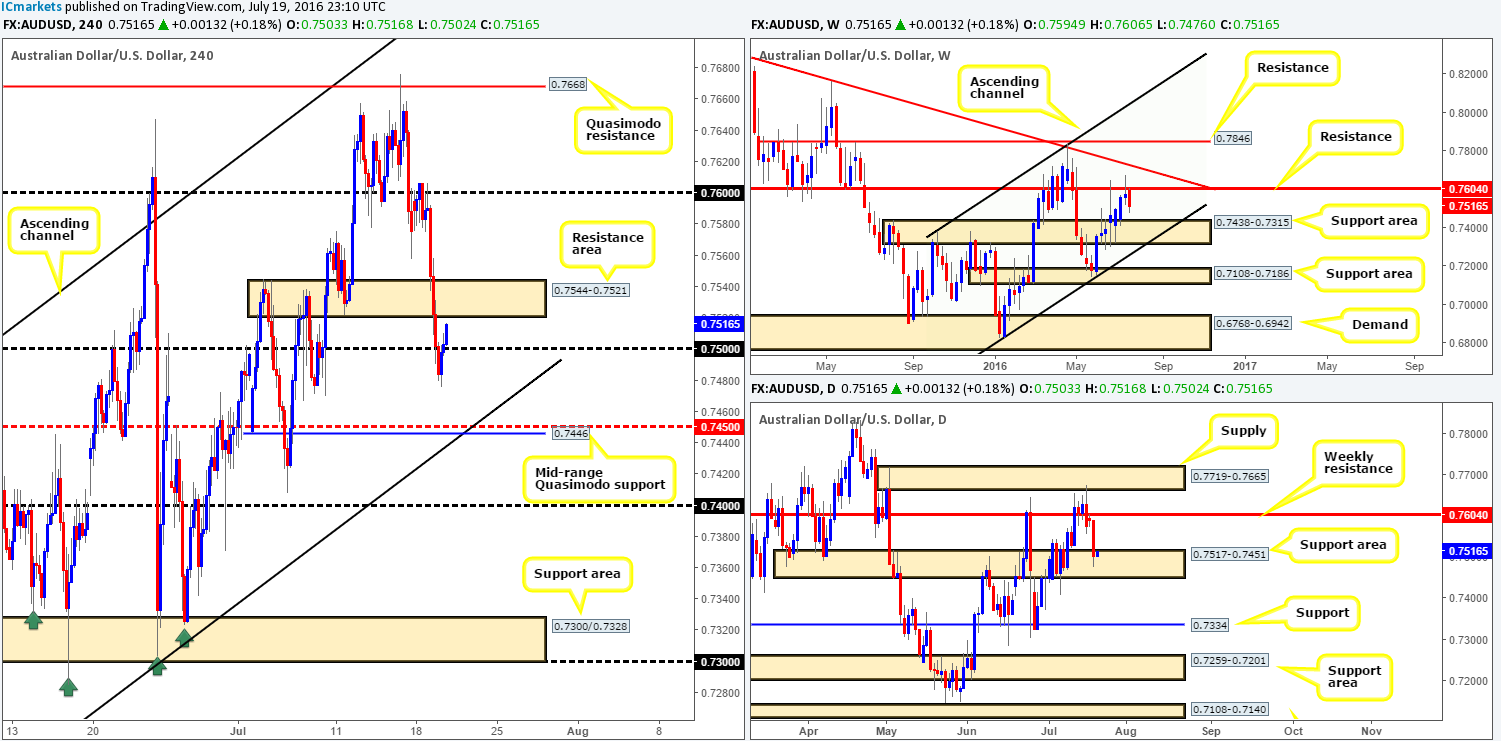
The US dollar gained across the board yesterday while the Aussie dollar clocked fresh lows at 0.7476. At the time of writing, however, the commodity currency is seen trading on the offensive, breaking back above the 0.75 handle and is now positioned within touching distance of the recently broken H4 support area at 0.7544-0.7521. This now begs the question, is a short from this area a viable option today? According to the weekly chart, we feel it is since there’s room for further selling down to weekly support area drawn from 0.7438-0.7315. Be that as it may, daily movement is now seen checking in with a daily support area registered at 0.7517-0.7451, which in our view, has to potential to cause trouble to anyone looking to short this market.
Our suggestions: One could still look to sell from the nearby H4 resistance area today, but we would highly recommend waiting for lower timeframe price action to confirm selling interest resides here before risking capital (see the top of this report for further information on pinning down a lower timeframe entry). The reason as to why should be obvious. Although you’re effectively selling in line with weekly flow, at the same time you are also going up against daily buying from the current support area (see above). In regard to take-profit targets, we’d be looking to take some off the table around the 0.75 mark, then look to run the remaining position down to the 0.7450 region (sits just above the weekly support area at 0.7438-0.7315, and coincides nicely with a H4 channel support extended from the low 0.7148 as well as a H4 mid-range Quasimodo support at 0.7446).
Levels to watch/live orders:
- Buys: Flat (Stop loss: N/A).
- Sells: 0.7544-0.7521 [Tentative – confirmation required] (Stop loss: dependent on where one confirms this area).
USD/JPY:
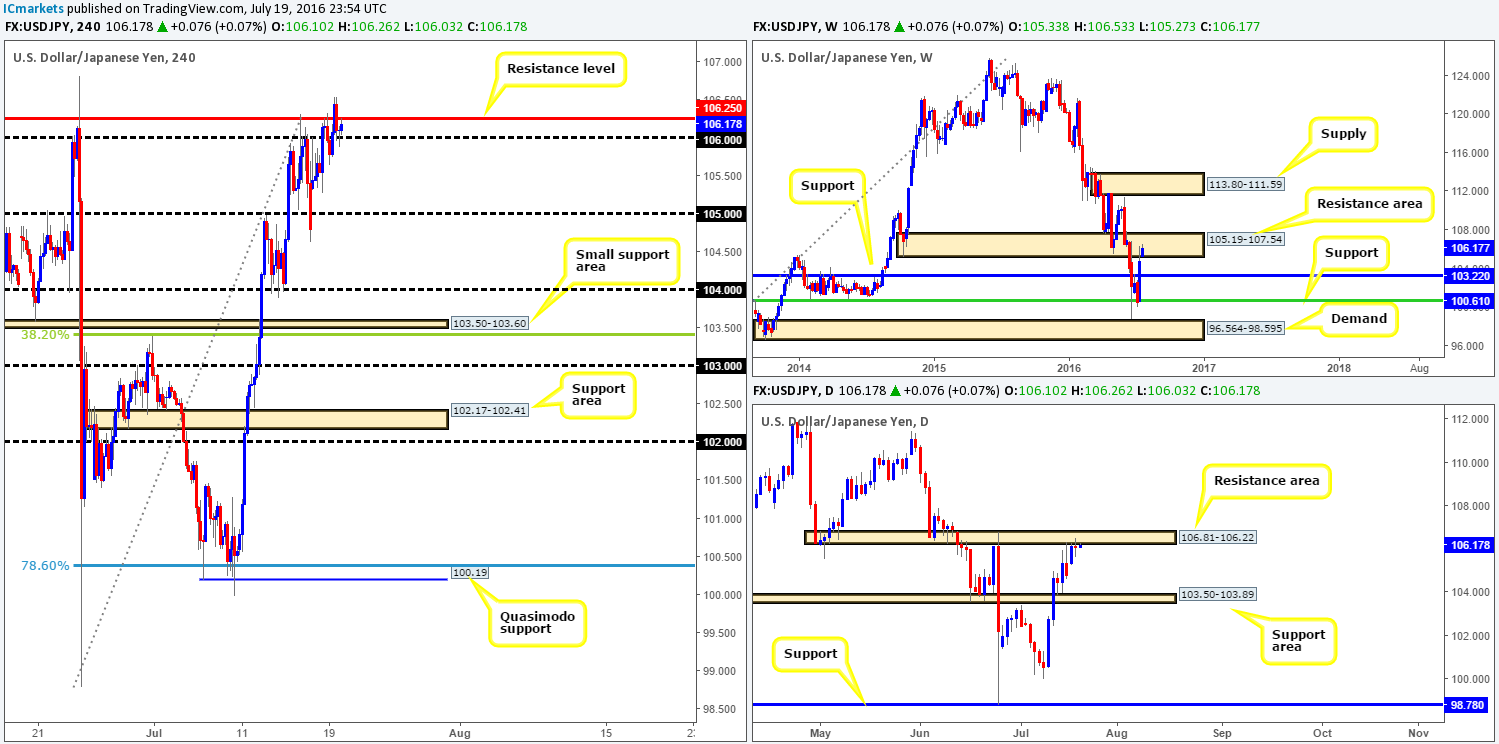
Despite the USD/JPY ranging around ninety pips yesterday, the market closed the day relatively unchanged. This, as you’ll see over on the daily chart, chalked up what candle enthusiasts would likely call a ‘doji’, suggesting indecision.
For those who read our previous report you may recall that we mentioned we were looking for price to close below the 106 handle followed by a retest. The close lower did come to fruition, but the retest was weak and therefore we passed on selling here. Shortly after this, H4 price broke back above 106 and went on to whipsaw through a H4 resistance line coming in at 106.25. As we write, the buyers and sellers are seen battling for position in between these two barriers. Quite frankly, we’d be surprised if the buyers came out on top here! Not only is daily action flirting with the underside of a daily resistance area registered at 106.81-106.22, but weekly price is also seen trading within a weekly resistance area at 105.19-107.54.
Our suggestions: Once again, watch for a close below the 106 line. This, alongside a retest would be sufficient (considering the higher timeframe structures) enough for our team to sell down to at least the 105 region.
Levels to watch/live orders:
- Buys: Flat (Stop loss: N/A).
- Sells: Watch for price to consume the 106 handle and look to trade any retest seen thereafter.
USD/CAD:
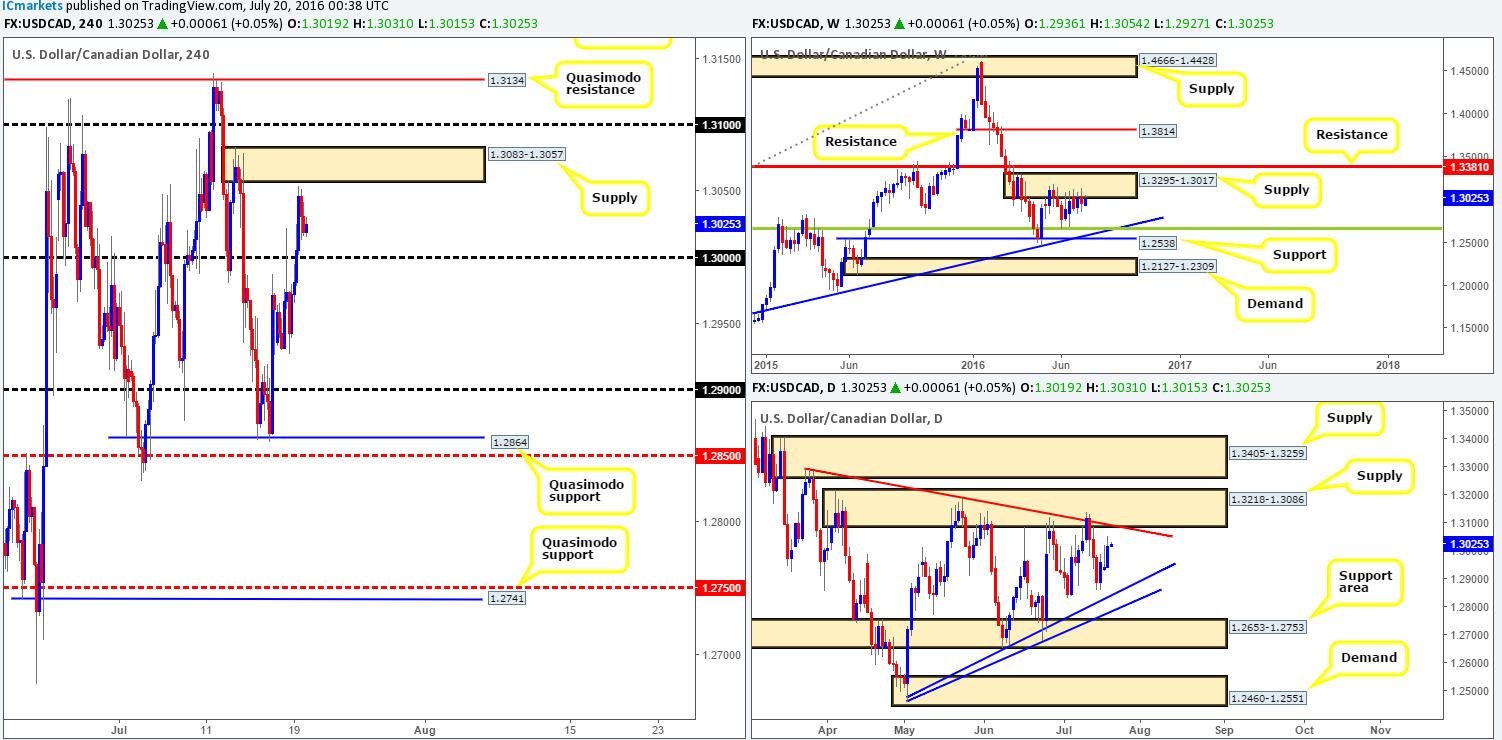
In recent sessions, the USD/CAD swallowed the key figure 1.30 before selling off a few pips ahead of a H4 supply at 1.3083-1.3057. This rotation was supported by a H4 demand over in oil drawn from 43.94-44.63.
Taking into consideration that daily price looks to be en route towards a daily supply at 1.3218-1.3086 (bolstered by a daily trendline resistance extended from the high 1.3295), and the weekly remains clinging to the underside of a weekly supply base drawn from 1.3295-1.3017, where do we go from here? Well, selling at current prices may not be the best path to take given 1.30 is lurking just below! Ideally, what we’re looking for is price to fakeout above the current H4 supply and tag either the 1.31 handle or one of the two H4 Quasimodo resistance levels at 1.3134/1.3173. The reason for this simply comes down to the H4 supply zone not being positioned within the above said daily supply. Both 1.31 and the two H4 Quasimodo lines are, however, housed within the aforementioned higher timeframe supplies, hence more significance being placed on these levels
Our suggestions: Keep a tab on the above said levels this week. Since it is almost impossible to know which area will bounce, if any, we recommend being patient and waiting for lower timeframe price action (see the top of this report). However, should price climb to the most extreme H4 Quasimodo resistance line at 1.3173, we would enter with a market order since we then have the option of placing our stop above the current daily supply zone!
Levels to watch/live orders:
- Buys: Flat (Stop loss: N/A).
- Sells: 1.31 region [Tentative – confirmation required] (Stop loss: dependent on where one confirms this area). 1.3134 region [Tentative – confirmation required] (Stop loss: dependent on where one confirms this area). 1.3173 [Entering at market here is viable but is still dependent on the time of day] (Stop loss: 1.3220).
USD/CHF:
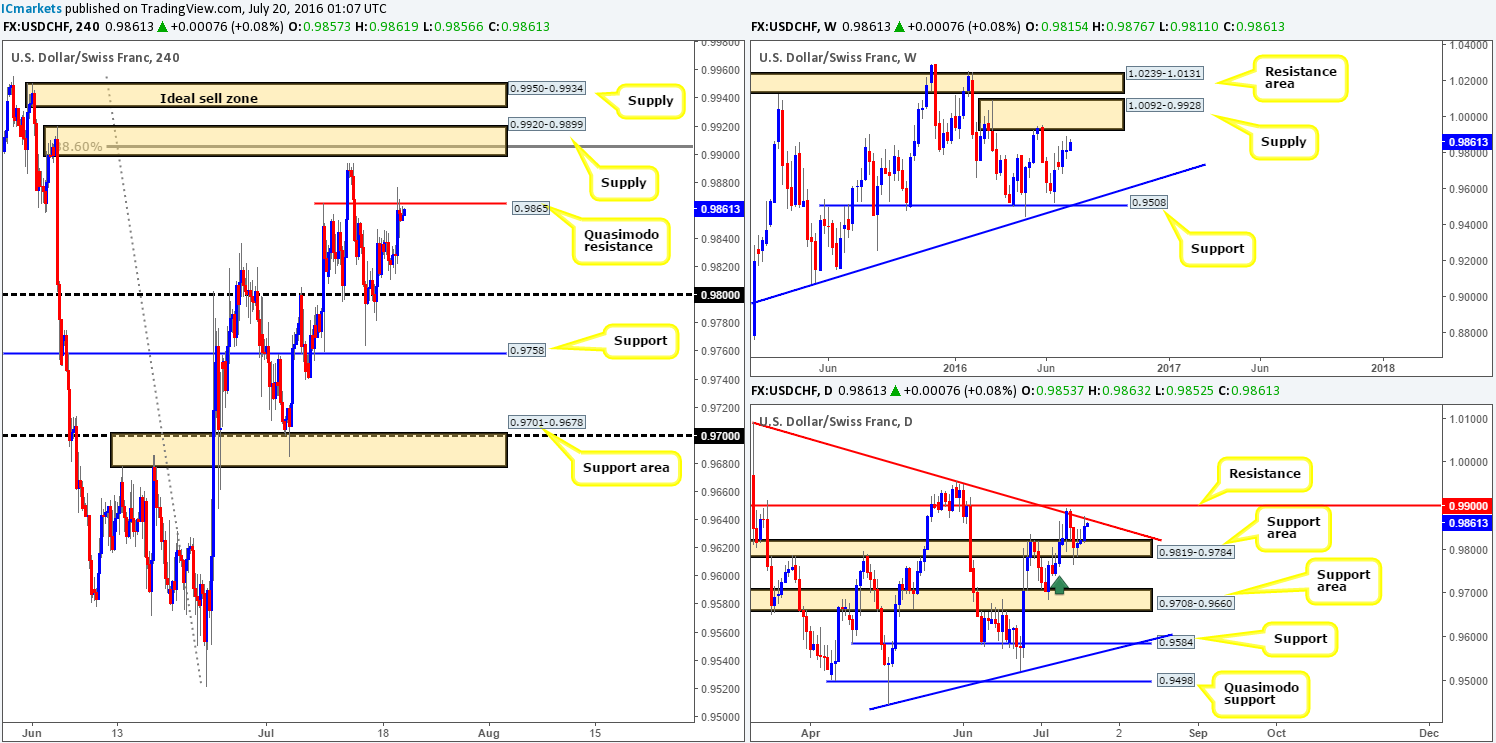
From the weekly chart this morning, we can see that the buyers and sellers remain loitering ahead of a weekly supply zone coming in at 1.0092-0.9928. Down on the daily chart on the other hand, the pair recently touched gloves with a daily trendline resistance extended from the high 1.0092.
With the EUR plummeting lower yesterday, it was no surprise to see that the Swissy had also rallied! However, as the EUR/USD found a pocket of bids around the 1.10 handle, the USD/CHF likewise found a pocket of offers around a H4 Quasimodo resistance line chalked up at 0.9865. Of course, in that this H4 Quasimodo level unites with a daily trendline resistance, a sell off from here is certainly possible today. Our team has noted that a sell trade from here would only be permitted following a lower timeframe sell signal (see the top of this report).
In addition to the above level, two H4 supply zones seen at 0.9920-0.9899 and 0.9950-0.9934 have also caught our eye! The lower of the two boasts a deep H4 88.6% Fib resistance at 0.9906, as well as the 0.99 handle which represents a daily resistance line! The upper H4 supply, the better zone of the two in our opinion, does not necessarily have any merging structures, but it is glued to the underside of the above said weekly supply zone!
Our suggestions: Watch the above said zones for potential sell trades today. Each area, as we’ve shown, has different qualities. If you’re unsure of a level, it is recommended to wait for lower timeframe confirmation to form before risking capital (see the top of this report). Personally, out of the three zones, the only area that we’d risk trading with a market order is at the 0.9950-0.9934 H4 supply zone due to its position on the weekly chart (see above).
Levels to watch/live orders:
- Buys: Flat (Stop loss: N/A).
- Sells: 0.9865 region [Tentative – confirmation required] (Stop loss: dependent on where one confirms this area). 0.9920-0.9899 [Tentative – confirmation required] (Stop loss: dependent on where one confirms this area). 0.9933 [Possible entry at market here depending on the time of day] (Stop loss: 0.9955).
DOW 30:
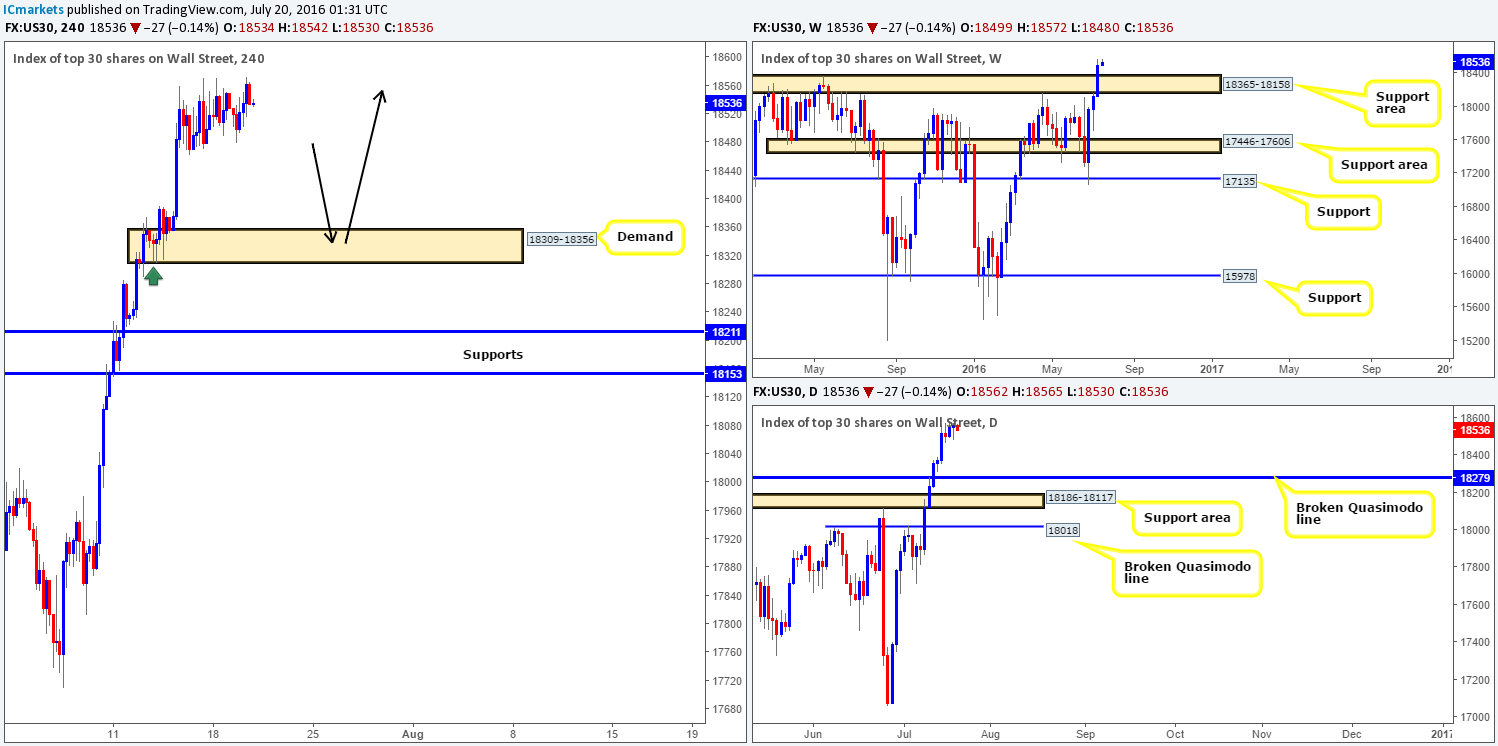
Since the DOW closed above both the weekly resistance area at 18365-18158 and the daily Quasimodo resistance line at 18279, and reached all-time highs, price action has been somewhat muted! As a result, until this market regains consciousness, our outlook remains unchanged…
Given that there’s very little to suggest selling this market at this time, our team will look to ‘buy the dips’ until price action suggests otherwise. Our first port of call will be the H4 demand zone coming in at 18309-18356 (see black arrows). This base is housed nicely within the recently broken weekly resistance area at 18365-18158 (now an acting support area), and sits just above a broken daily Quasimodo level mentioned above at 18279. In addition to this, the tails seen marked on the H4 chart with a green arrow represent buying interest around this level, thus there is a strong possibility (given the higher timeframe picture as well) that there are unfilled orders still residing here.
Our suggestions: Watch for a lower timeframe buy entry from the H4 demand area mentioned above at 18309-18356. The reason for requiring extra confirmation here simply comes down to the possibility that price may fake beyond the aforementioned H4 demand into the broken daily Quasimodo line. For those who struggle to find reliable setups on the lower timeframes, please see the top of this report for a list of techniques we regularly use.
Levels to watch/live orders:
- Buys: 18309-18356 [Tentative – confirmation required] (Stop loss: dependent on where one confirms this area).
- Sells: Flat (Stop loss: N/A).
GOLD:
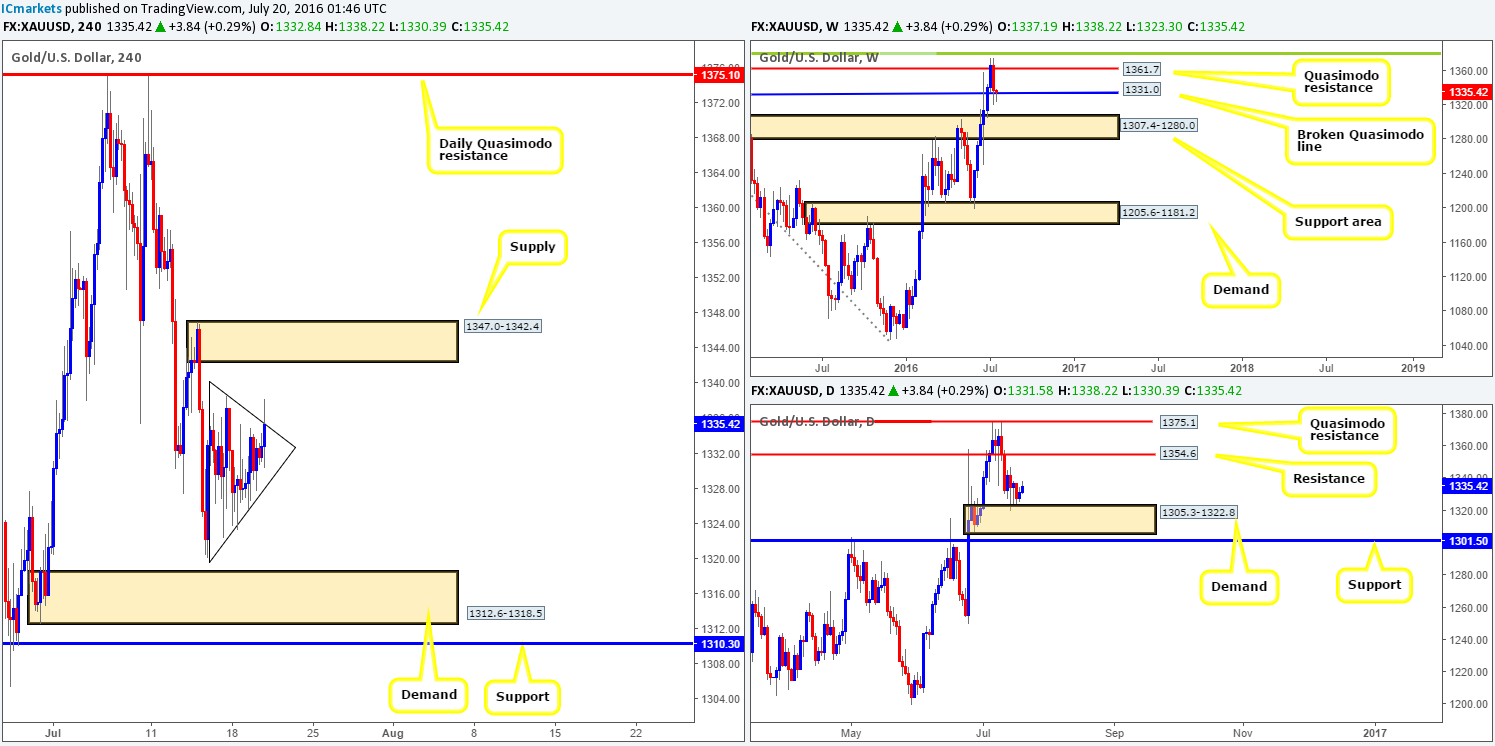
Once again the yellow metal was relatively sluggish during the course of yesterday’s sessions, failing to break out of the prior day’s range! All may not be lost though! What this mellow price action appears to be chalking up is a H4 bearish pennant, which are continuation patterns. This – coupled with the current weakness being seen around the weekly broken Quasimodo line at 1331.0 suggests further downside is possible. In spite of weakness being seen around the current weekly level, daily action reveals that the metal is facing off with a daily demand base carved from 1305.3-1322.8. This could be enough to half further selling in this market this week.
Our suggestions: A close below the current H4 pennant formation followed by a retest would, at least for us, be tempting to trade, targeting the H4 demand base at 1312.6-1318.5. Nevertheless, this would mean selling directly into the jaws of a daily demand – not exactly ideal trading conditions!
On the other hand, a close above and retest to upper edge of the current H4 pennant might be something to consider, targeting the H4 supply at 1347.0-1342.4 followed closely by the daily resistance line at 1354.6. Not only would we then be trading in line with daily flow from demand, but this H4 movement could possibly indicate buying strength is entering the market from the current weekly broken Quasimodo line. To trade this move, however, we would recommend waiting for a lower timeframe buy signal after the retest has been seen (see the top of this report for lower timeframe entry techniques), as this will help one avoid the dreaded fakeout, or worse a complete loss.
Levels to watch/live orders:
- Buys: Flat (Stop loss: N/A).
- Sells: Watch for price to close above the H4 pennant edge and look to trade any retest seen thereafter (lower timeframe confirmation required).


