
A note on lower timeframe confirming price action…
Waiting for lower timeframe confirmation is our main tool to confirm strength within higher timeframe zones, and has really been the key to our trading success. It takes a little time to understand the subtle nuances, however, as each trade is never the same, but once you master the rhythm so to speak, you will be saved from countless unnecessary losing trades. The following is a list of what we look for:
- A break/retest of supply or demand dependent on which way you’re trading.
- A trendline break/retest.
- Buying/selling tails – essentially we look for a cluster of very obvious spikes off of lower timeframe support and resistance levels within the higher timeframe zone.
- Candlestick patterns. We tend to only stick with pin bars and engulfing bars as these have proven to be the most effective.
For us, lower timeframe confirmation starts on the M15 and finishes up on the H1, since most of our higher timeframe areas begin with the H4. Stops usually placed 5-10 pips beyond your confirming structures.
EUR/USD:
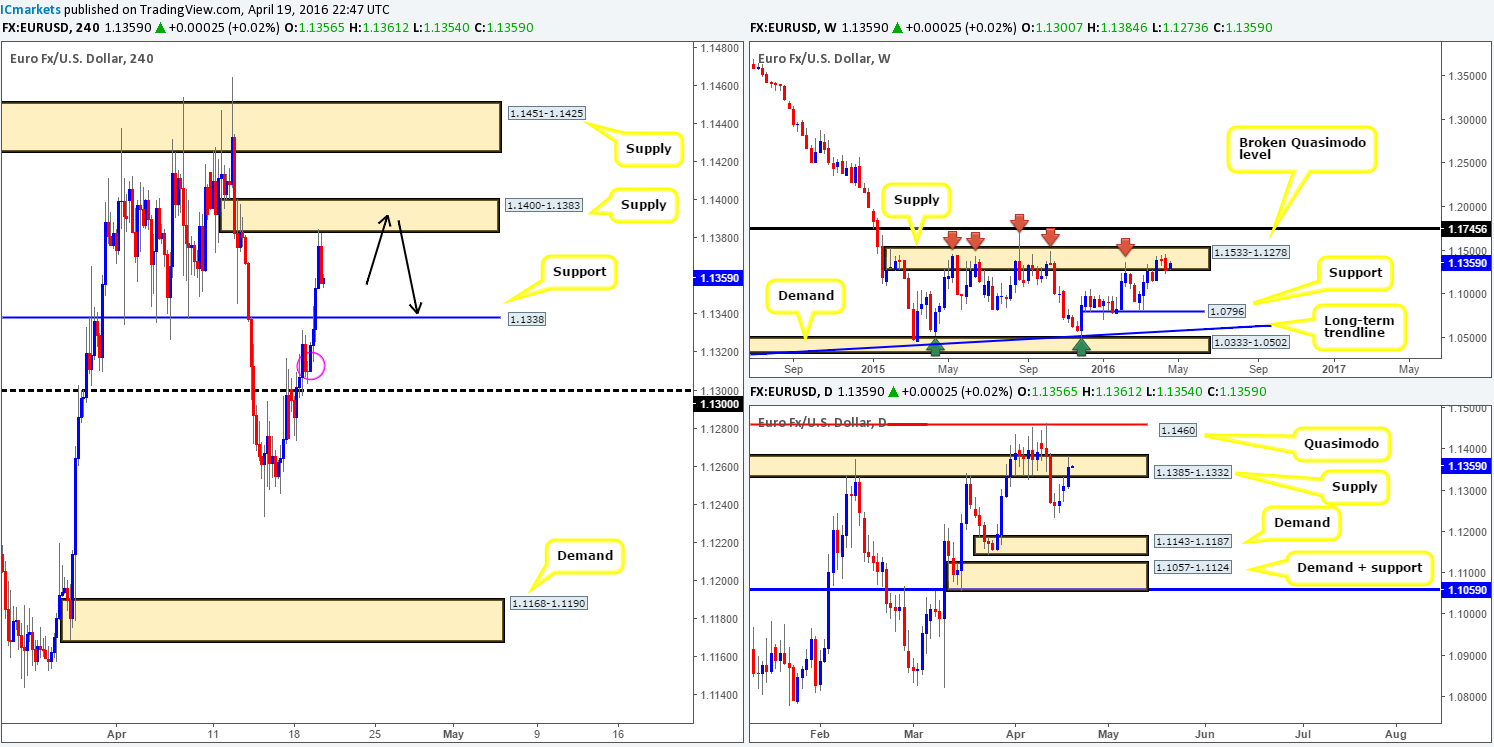
During the course of yesterday’s sessions the single currency advanced north, consequently taking out H4 resistance at 1.1338 (now acting support) and shaking hands with H4 supply drawn from 1.1400-1.1383 going into the close. The response from this zone, as you can see, has so far been very impressive. Other than the mid-level support 1.1350, which has not really played a big role in this pair’s structure of late, we see little reason for the EUR not to continue lower to retest the 1.1338 mark sometime today.
With price still loitering within the confines of a major weekly supply zone at 1.1533-1.1278, and daily action holding ground amid supply at 1.1385-1.1332, there’s scope for a push beyond the current H4 support. Below this line, however, there appears to be limited downside potential, with a near-term H4 demand seen marked with a pink circle at 1.1303-1.1315, followed by psychological support at 1.1300! Therefore, shorts on the break of 1.1338, at least to us, would be a risky play in our book. The only other alternative we see here today is to wait and see if price retests the current H4 supply for a second time and look to short with lower timeframe price action (see the top of this report for confirmation techniques). This, to us, would only be a viable setup assuming price does not hit 1.1338 beforehand since this would be our initial take-profit target (see black arrows).
Entering long from 1.1338 today would of course place one against higher-timeframe structure. This is not to say buying from this line is not viable, it’s just we prefer to dabble when the cards are stacked more in our favor.
Levels to watch/live orders:
- Buys: Flat (Stop loss: N/A).
- Sells: 1.1400-1.1383 [Tentative – confirmation required] (Stop loss: dependent on where one confirms this area).
GBP/USD:
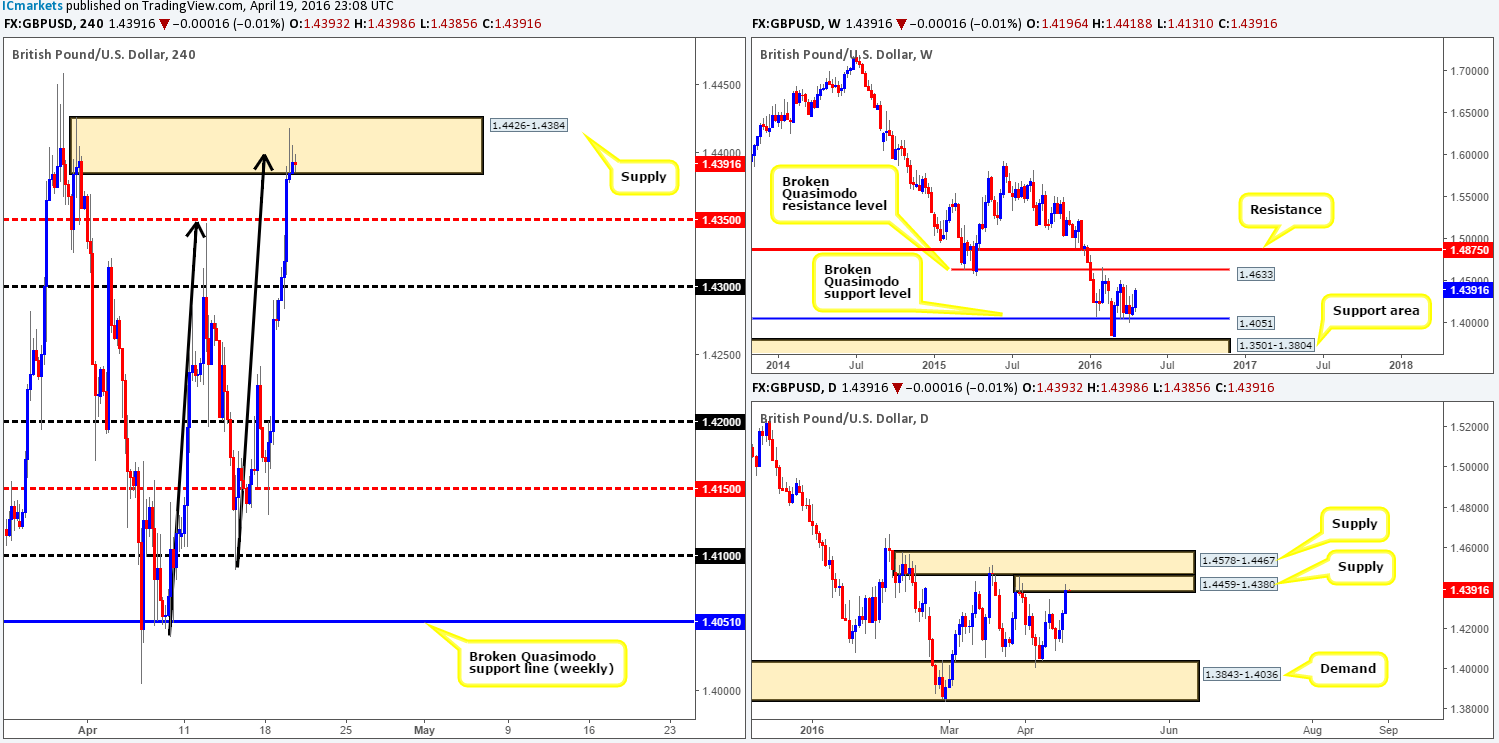
Following an early break above and retest of the psychological number 1.4300 in yesterday’s trading, Cable rocketed over 100 pips north. Price surpassed a H4 mid-level resistance at 1.4350 and ended the day jabbing into H4 supply coming in at 1.4426-1.4384.
Now, given that this H4 supply converges with not only a psychological resistance at 1.4400, but also boasts a very nice-looking H4 AB=CD approach (see black arrows), would we consider this a viable platform to short today? Well, over on the daily chart price is seen nibbling at the underside of supply chalked up at 1.4459-1.4380, thus adding weight to a reversal from our H4 supply. The weekly chart on the other hand shows price extending higher from a broken Quasimodo support level at 1.4051, with upside potential still seen towards a broken Quasimodo resistance line at 1.4633.
In view of the above points, we feel that price will likely decline from its current position. Owing to the convergence seen at the H4 supply (see above), our team has entered short at market from 1.4393 with a stop placed above at 1.4430. Yes, we know we have effectively sold into weekly flow here, but we’re quite confident at least 1.4350 will be achieved, which is where we plan to take partial profits and significantly reduce risk.
Levels to watch/live orders:
- Buys: Flat (Stop loss: N/A).
- Sells: 1.4393 [LIVE] (Stop loss: 1.4430).
AUD/USD:
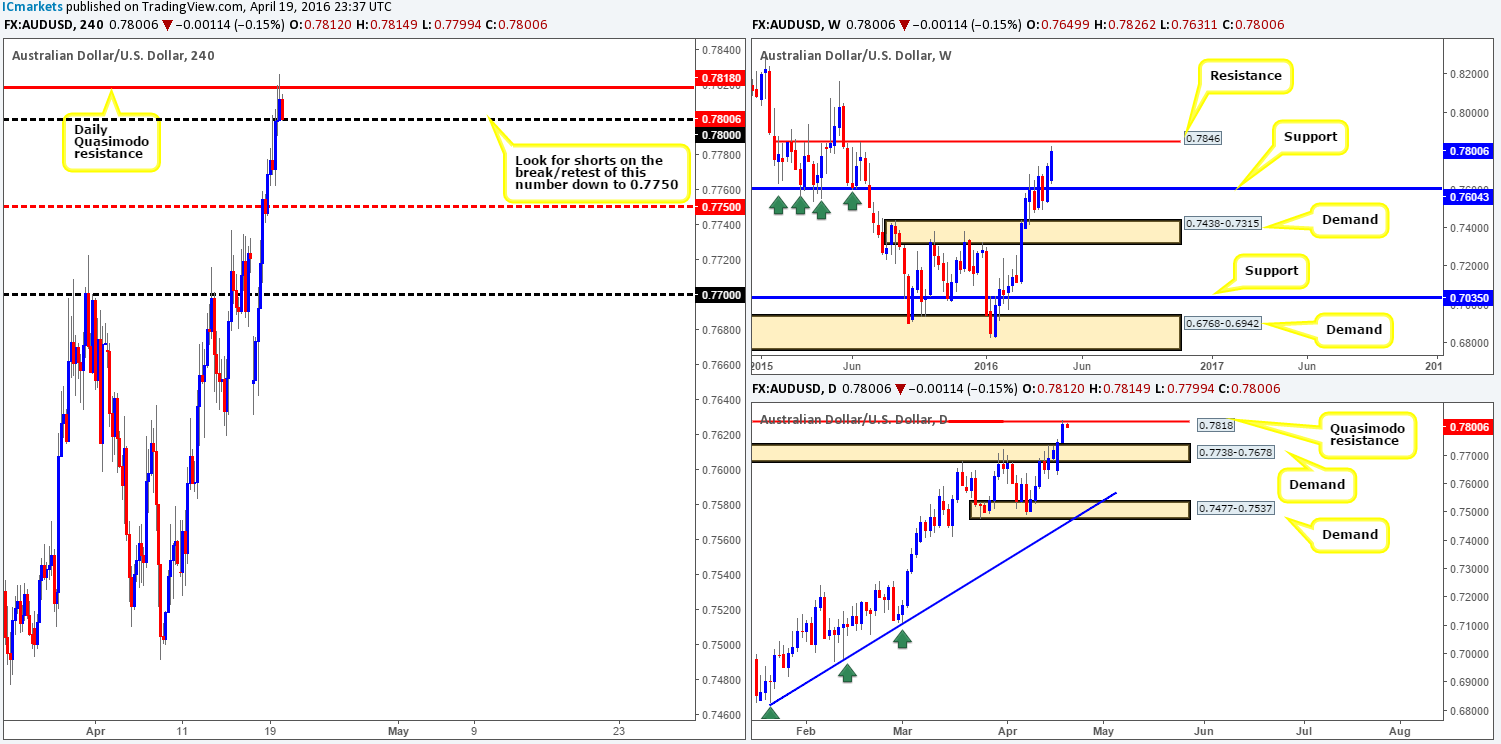
Using a top-down approach on the Aussie this morning, one can see that weekly price is now trading within shouting distance of a major resistance line printed at 0.7846. Remember, support and resistance lines such as this one here should not be treated as fixed price levels in the market. We prefer to look at these lines as zones as price often reverses before our chosen number and on many occasions extends slightly beyond before a reaction is seen.
Turning our attention to the daily structure, the commodity currency is currently seen teasing a Quasimodo resistance level extended forward from mid-2015 at 0.7818. From this timeframe, there’s little support stopping price from driving lower from here to test the top-side of demand given at 0.7738.
Looking across to the H4 chart, there is clearly some selling interest being seen around the aforementioned daily Quasimodo resistance. Nevertheless, shorting this market with price seen testing 0.7800 as support right now is not really something we’d stamp high probability! Should price close beyond 0.7800 and retest it as resistance, then it’d be a different story entirely as there’s little structure seen below until the H4 mid-level support line at 0.7750 (sits just above the top-side of daily demand mentioned above at 0.7738). Should one manage to pin down a short trade below 0.7800 today, 0.7750 would obviously be our first port of call, likely followed by the 0.7700 handle. It will be interesting to see how this one plays out!
Levels to watch/live orders:
- Buys: Flat (Stop loss: N/A).
- Sells: Watch for price to consume 0.7800 and look to trade any retest seen thereafter (lower timeframe confirmation required).
USD/JPY:
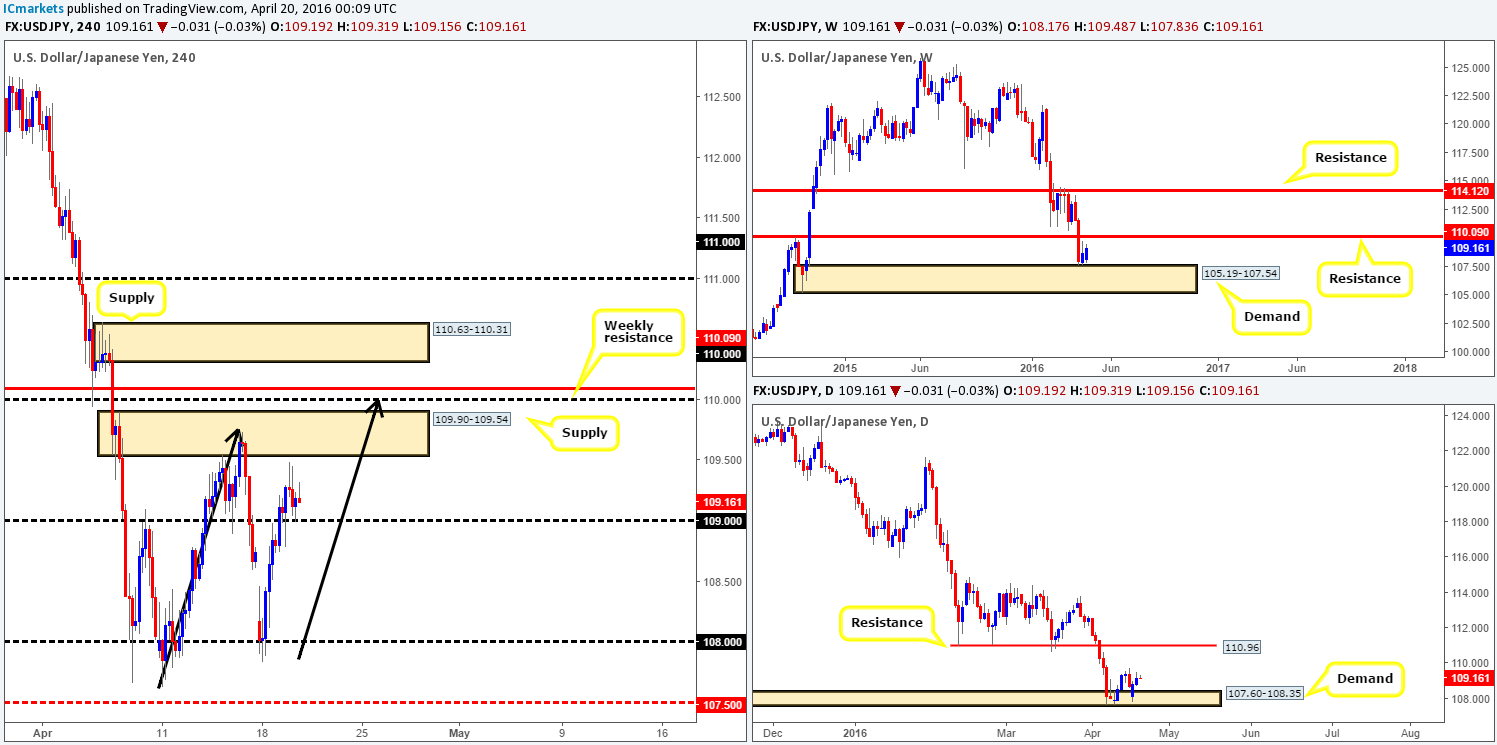
Starting from the weekly timeframe this morning, the bulls still appear to have the upper hand above demand coming in at 105.19-107.54. Should this market remain bolstered, it’s possible that we may see price retest the 110.09 mark as resistance sometime soon. Similar to the weekly timeframe, daily action is also currently supported by demand given at 107.60-108.35. However, from this angle, we can see minor resistance forming around the 109.33 region – beyond here we see little in the way of resistance until 110.96.
Stepping across to the H4 chart, this is what’s currently in view:
- Price respecting 109.00 during yesterday’s American afternoon session.
- Proven H4 supply seen lurking overhead at 109.90-109.54.
- The D-leg of an AB=CD approach is in the process of forming (black arrows), which if completes should terminate around the 110.00 handle.
In light of these three points and the higher-timeframe picture (see above), our team is no longer interested in the current H4 supply zone. Our energy will now be focused on looking for shorts around the 110.00 line and the weekly resistance level seen just above it at 110.09, as this seems the more logical route to us. We would not advise placing pending orders around this area due to the strong possibility that a fakeout up to H4 supply sitting at 110.63-110.31 will likely take place before sellers step in!
Levels to watch/live orders:
- Buys: Flat (Stop loss: N/A).
- Sells: 110.09/110.00 [Tentative – confirmation required] (Stop loss: dependent on where one confirms this area).
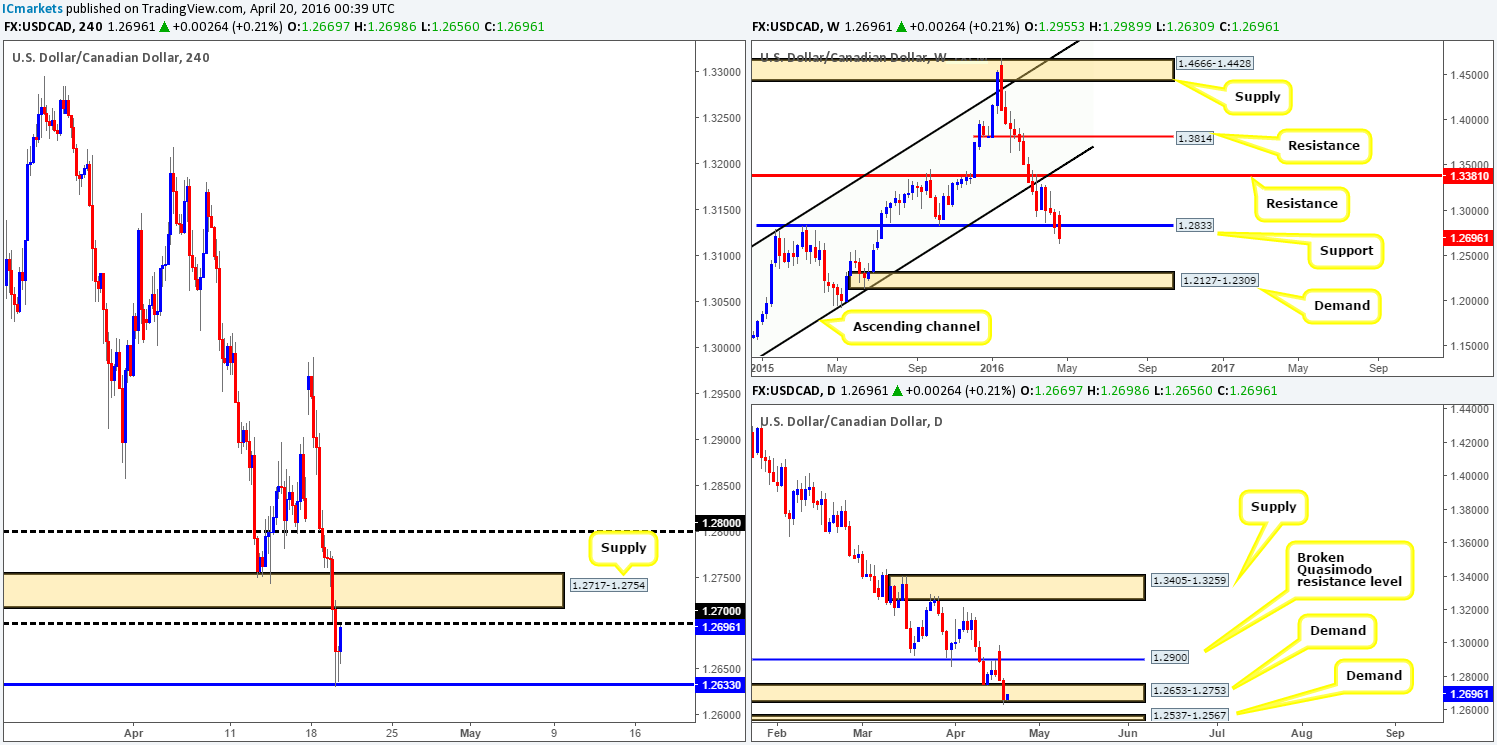
USD/CAD:
The USD/CAD remained well-offered going into London trading yesterday, consequently breaking below H4 demand at 1.2717-1.2754 (now acting supply) and also psychological support 1.2700. It was only once price collided with H4 support at 1.2633 going into the American session did we see price begin to stabilize.
As we can all see, H4 activity is now nibbling at the underside of 1.2700 which could potentially halt further buying in this market. We believe that shorting from this number today could also be a possibility due to the following points:
- Weekly support at 1.2833 is seen struggling to hold ground with price trading beneath this number at the moment. In the event that a sustained move south is seen beyond here, demand drawn from 1.2127-1.2309 is likely the next target on the hit list.
- Daily demand at 1.2653-1.2753 was recently breached, potentially clearing the path south down to daily demand seen at 1.2537-1.2567.
Owing to H4 supply at 1.2717-1.2754 lurking just above 1.2700, there is a strong possibility that a fakeout above this number will take place. For this reason, we would advise against placing pending orders at 1.2700, and instead only enter should you manage to spot a lower timeframe selling opportunity around this region (see the top of this report for confirmation techniques).
Levels to watch/live orders:
- Buys: Flat (Stop loss: N/A).
- Sells: 1.2700/1.2717-1.2754 [Tentative – confirmation required] (Stop loss: dependent on where one confirms this area).
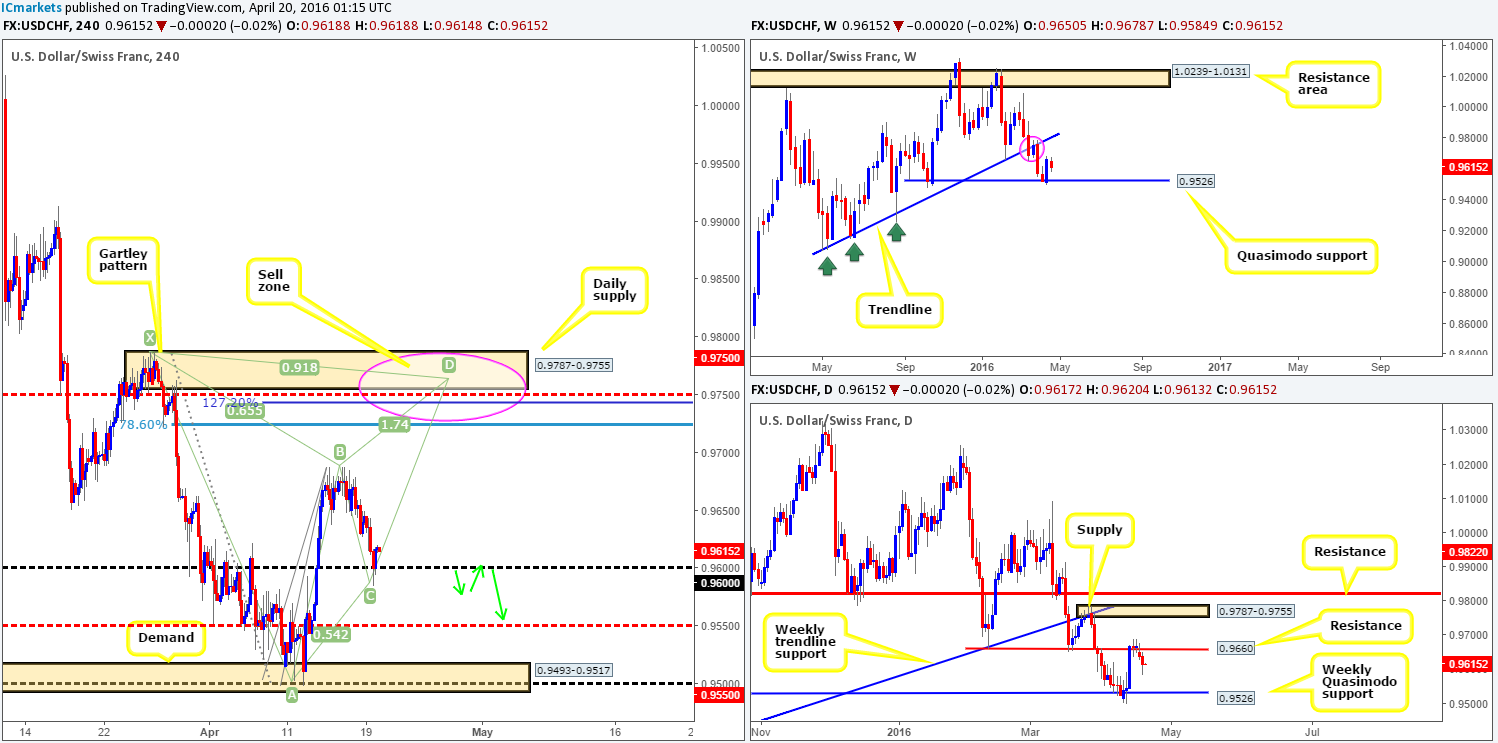
USD/CHF:
Since the beginning of the week, H4 price has been grinding lower down from its peak at 0.9688. This, as shown on the chart, brought the Swissy down into the jaws of psychological support 0.9600 going into yesterday’s U.S. open, which for the time being is holding firm. Assuming that 0.9600 continues to hold as support, we may see a beautiful-looking bearish Gartley pattern begin to take shape (see chart). This setup may not come to fruition today/ this week, but it is certainly something to have noted down in your watch lists, as not only does this Harmonic pattern converge with daily supply at 0.9787-0.9755, it is also bolstered by a H4 mid-level resistance 0.9750.
Before we all get too excited by this pattern, however, price has its work cut out for it if it is to complete. Currently we can see daily resistance at 0.9660 proving itself valid as well as a small weekly supply seen marked with a pink circle at 0.9787-0.9695 in play right now. Therefore, as far as higher-timeframe structure is concerned there is a chance the H4 Harmonic pattern may not take form and 0.9600 could be taken out. That being the case, do keep an eyeball on this line today for a break/retest trade (see green arrows), targeting mid-level support 0.9550 first and foremost.
Levels to watch/live orders:
- Buys: Flat (Stop loss: N/A).
- Sells: Watch for price to consume 0.9600 and look to trade any retest seen thereafter (lower timeframe confirmation required). 0.9750 region [Potentially a zone where one can place a pending order should price head in this direction] (Stop loss: 0.9794).
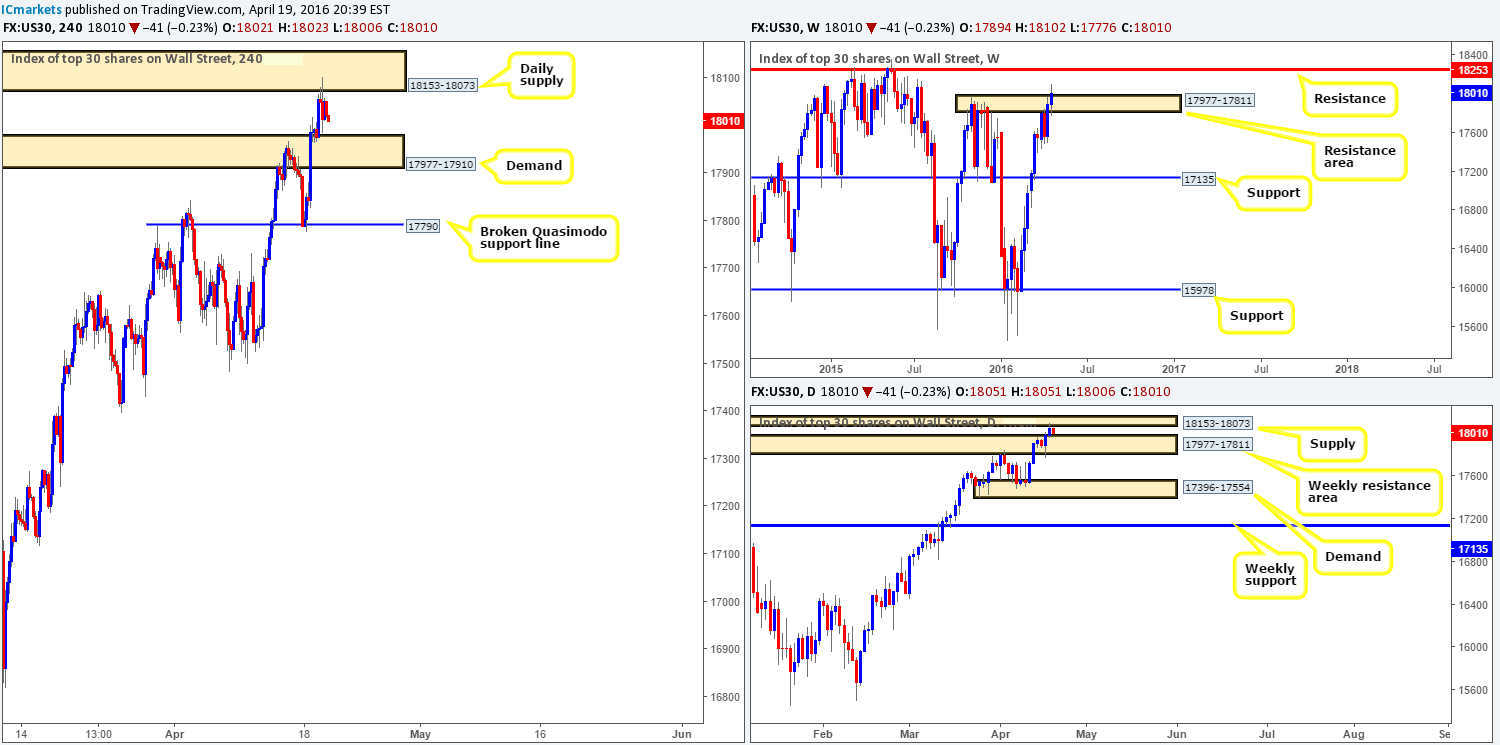
DOW 30:
Beginning with a look at the weekly chart this morning, the resistance area at 17977-17811 is currently under attack. Supposing that offers completely dry up here, it’s very likely that we’ll see a continuation move north to test resistance drawn in from 18253. Climbing down into the daily chart, supply at 18153-18073 was recently brought into the action. To our way of seeing things, this area is the last obstacle standing in the way of a move north towards weekly resistance mentioned above at 18253.
Climbing down one more level to the H4 shows us that price is currently bid from H4 demand coming in at 17977-17910, but at the same time, also offered from the aforementioned daily supply. As far as we can see, technical elements are just too mixed at the moment in this market, leaving us with little choice but to remain flat for now.
Levels to watch/live orders:
- Buys: Flat (Stop loss: N/A).
- Sells: Flat (Stop loss: N/A).
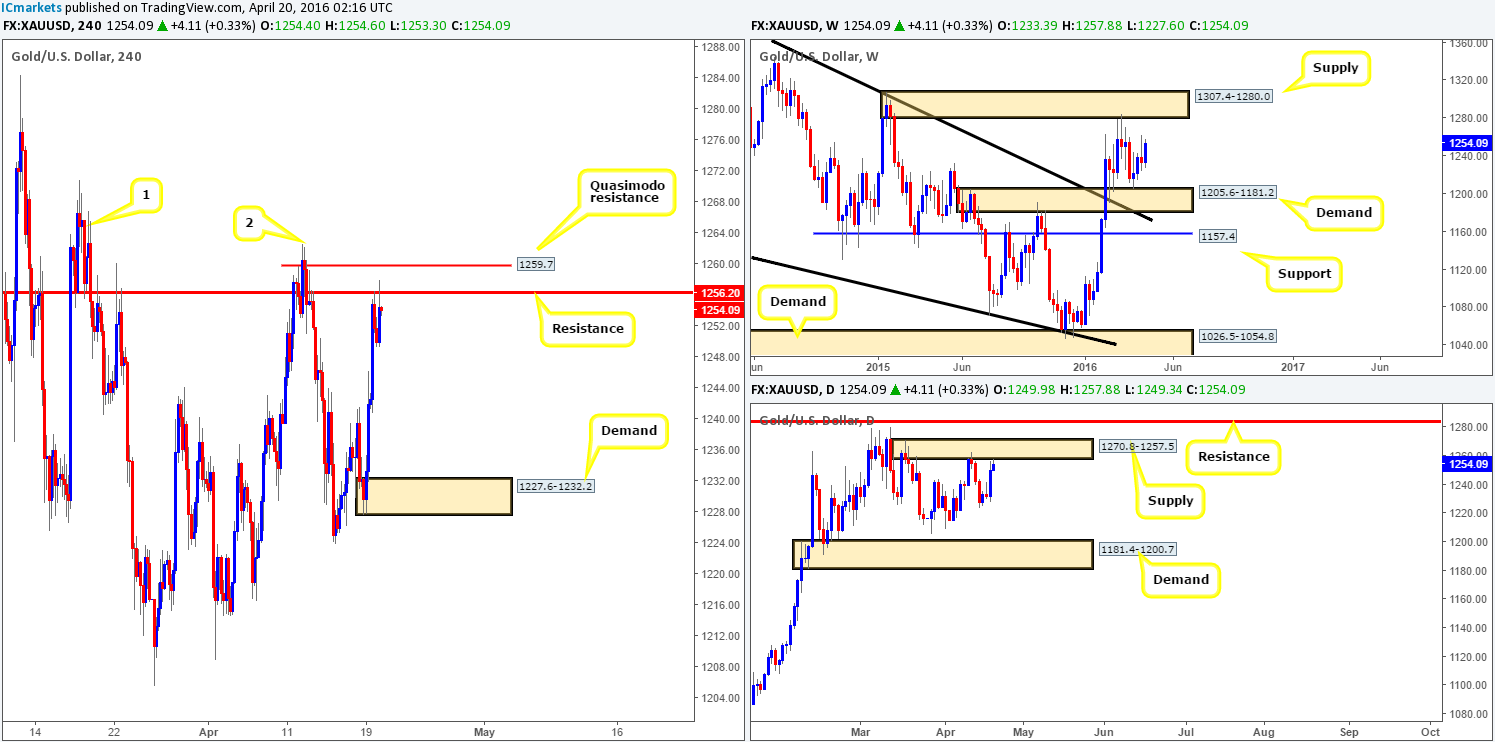
XAU/USD:
Kicking off our analysis with a look at the weekly chart this morning shows very little direction in this market at the moment. To the upside, price is seen capped by supply drawn from 1307.4-1280.0, while to the downside demand at 1205.6-1181.2 continues to hold the yellow metal higher. As such, we recommend keeping an eyeball on both of these zones in the coming days.
On the other side of the field, the buyers and sellers on the daily chart are seen battling for position at the underside of supply coming in at 1270.8-1257.5. This is effectively the third visit to this zone, which may end in price driving above this area to connect with resistance lurking at 1283.4 (positioned within the above said weekly supply).
With the higher-timeframe picture in mind, here is what we see on the H4 chart:
- Price defending resistance coming in at 1256.2 – essentially the lower edge of daily supply at 1257.5.
- A relatively nice-looking Quasimodo resistance level positioned just above the current resistance sitting at 1259.7.
- Points one (1266.7) and two (1262.6) show what we believe to be consumption wicks i.e. little active supply left within this region.
Therefore, given the relatively soft response seen from the current H4 resistance level and very little of interest above the H4 Quasimodo resistance at 1259.7, we’ll be looking to short 1259.7 today as this remains the only fresh area. Be that as it may, we would not feel comfortable selling here without some sort of lower timeframe confirmation (a break/retest of demand, a trendline break/retest or even simply a collection of selling wicks around a lower timeframe resistance), since let’s not forget that the weekly chart shows room for price to rally north up to the aforementioned weekly supply. The first take-profit target from 1259.7 will be dependent upon the approach to our sell line.
Levels to watch/live orders:
- Buys: Flat (Stop loss: N/A).
- Sells: 1259.7 [Tentative – confirmation required] (Stop loss: dependent on where one confirms this level).


