
A note on lower timeframe confirming price action…
Waiting for lower timeframe confirmation is our main tool to confirm strength within higher timeframe zones, and has really been the key to our trading success. It takes a little time to understand the subtle nuances, however, as each trade is never the same, but once you master the rhythm so to speak, you will be saved from countless unnecessary losing trades. The following is a list of what we look for:
- A break/retest of supply or demand dependent on which way you’re trading.
- A trendline break/retest.
- Buying/selling tails/wicks – essentially we look for a cluster of very obvious spikes off of lower timeframe support and resistance levels within the higher timeframe zone.
- Candlestick patterns. We tend to stick with pin bars and engulfing bars as these have proven to be the most effective.
We typically search for lower-timeframe confirmation between the M15 and H1 timeframes, since most of our higher-timeframe areas begin with the H4. Stops are usually placed 3-5 pips beyond confirming structures.
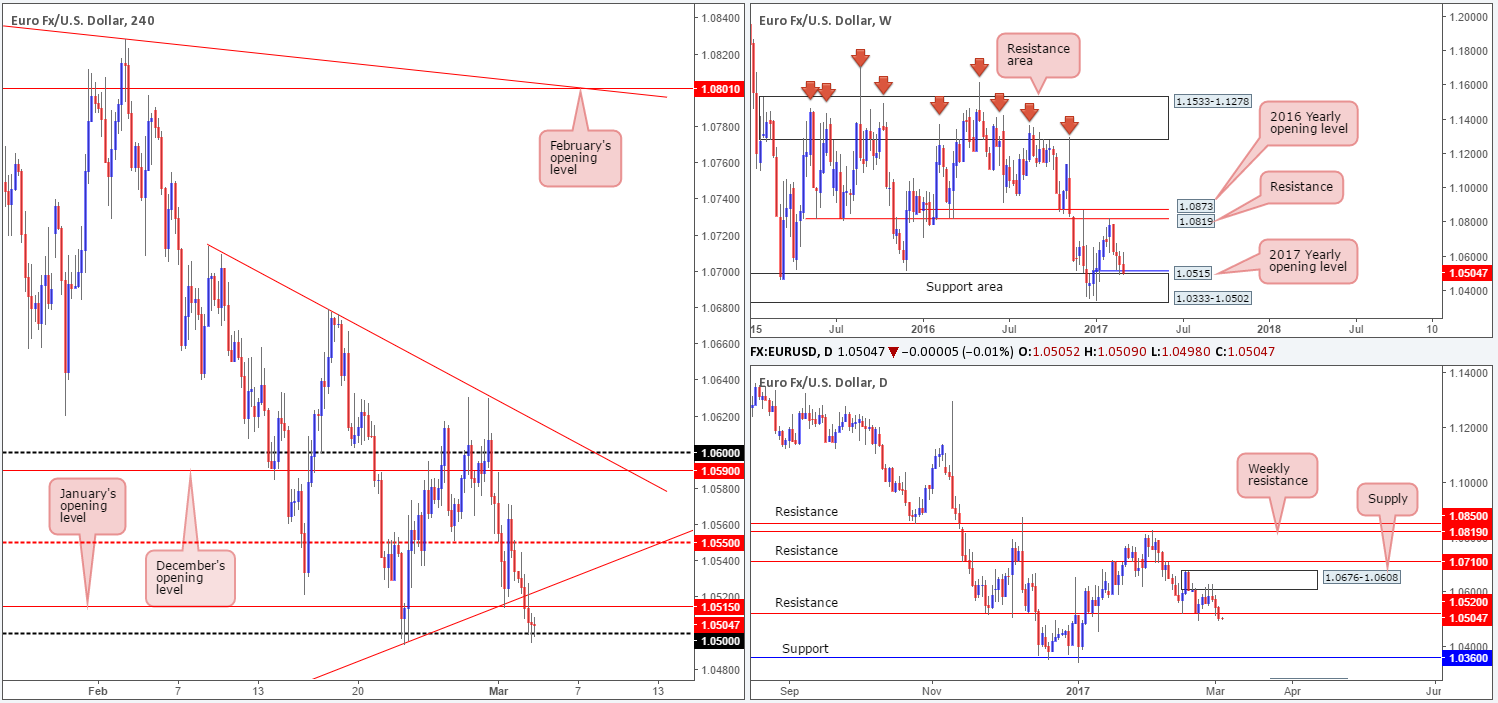
EUR/USD:
Kicking this morning’s report off with a look at the weekly chart shows that price remains hovering above the 2017 yearly opening base at 1.0515, which, as you can see, is shadowed closely by a weekly support area coming in at 1.0333-1.0502. Down on the daily chart, yesterday’s segment chalked up its second consecutive bearish pin bar out of the daily supply zone seen at 1.0676-1.0608. Providing that the sellers continue to defend the noted daily supply, the next downside objective falls in at a daily support level fixed from 1.0520. Swinging across to the H4 chart, price, for the most part, is in a similar position to yesterday! With that said, much of the following will echo thoughts put forward during Tuesday’s report…
With the H4 candles now seen trading below December’s opening level at 1.0590, the next downside hurdle in the firing range, in our view, falls in at the H4 mid-level support drawn from 1.0550, followed closely by January’s opening base at 1.0515.
Our suggestions: Personally, we would not consider shorting at this time. The 1.05/1.0520 area, nevertheless, looks great for a bounce north (yellow rectangle). The zone comprises of: a round number at 1.05, a H4 trendline support taken from the low 1.0339, January’s opening level at 1.0515, daily support at 1.0520 and let’s not forget that all of this is further reinforced by the weekly support area at 1.0333-1.0502. This barrier, in our humble opinion, has sufficient confluence to justify a trade without the need for additional confirmation.
Data points to consider: US President Trump speaks at 2am, US Core PCE price index at 1.30pm, US ISM manufacturing PMI at 3pm, FOMC member Kaplan speaks at 6pm, FOMC member Brainard speaks at 11pm GMT.
Levels to watch/live orders:
- Buys: 1.05/1.0520 ([an area one could possibly trade at market] stop loss: 1.0490).
- Sells: Flat (stop loss: N/A).
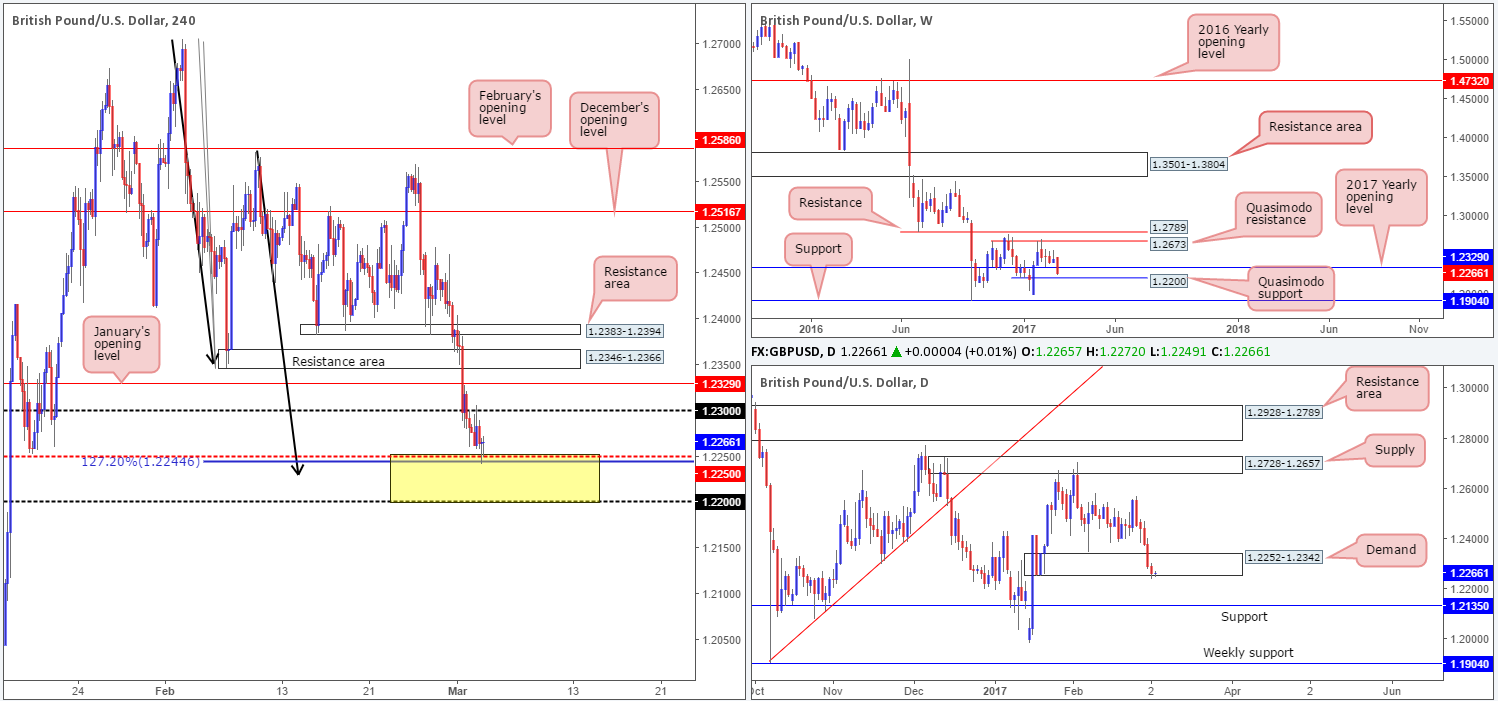
GBP/USD:
Based on recent H4 action, we can see that strong sellers stepped in during the early hours of yesterday’s US segment and drove the GBP lower for a third consecutive day. The 1.24 handle, along with a H4 support area at 1.2383-1.2394 (now an acting resistance area) was consumed amid the selloff, leaving the gates open for price to challenge the nearby H4 demand logged in at 1.2346-1.2366.
What is quite notable from a technical perspective is the fact that the above noted H4 demand converges with a H4 AB=CD (symmetrical) completion point at 1.2367 (black arrows), and is positioned a few pips above a daily demand coming in at 1.2252-1.2342.
Our suggestions: Although we do believe a bounce from the current H4 demand is on the cards, one thing to keep in mind here is the 2017 yearly opening level lurking just below at 1.2329. Therefore, before one places a pending order, this level may need to be factored in to your stop-loss calculation.
Our desk has noted that they will be watching the lower-timeframe action for bullish intent before committing to a trade long here. This could be a signal in the form of: an engulf of supply followed by a retest, a trendline break/retest or simply a well-defined collection of buying tails printed within the higher-timeframe zone. We typically search for lower-timeframe confirmation between the M15 and H1 timeframes, since most of our higher-timeframe areas begin with the H4. Stops are usually placed 3-5 pips beyond confirming structures.
Data points to consider: UK manufacturing PMI at 9.30am. US President Trump speaks at 2am, US Core PCE price index at 1.30pm, US ISM manufacturing PMI at 3pm, FOMC member Kaplan speaks at 6pm, FOMC member Brainard speaks at 11pm GMT.
Levels to watch/live orders:
- Buys: 1.2346-1.2366 ([wait for a lower-timeframe signal to form before looking to pull trigger here] stop loss: dependent on where one confirms the zone).
- Sells: Flat (stop loss: N/A).
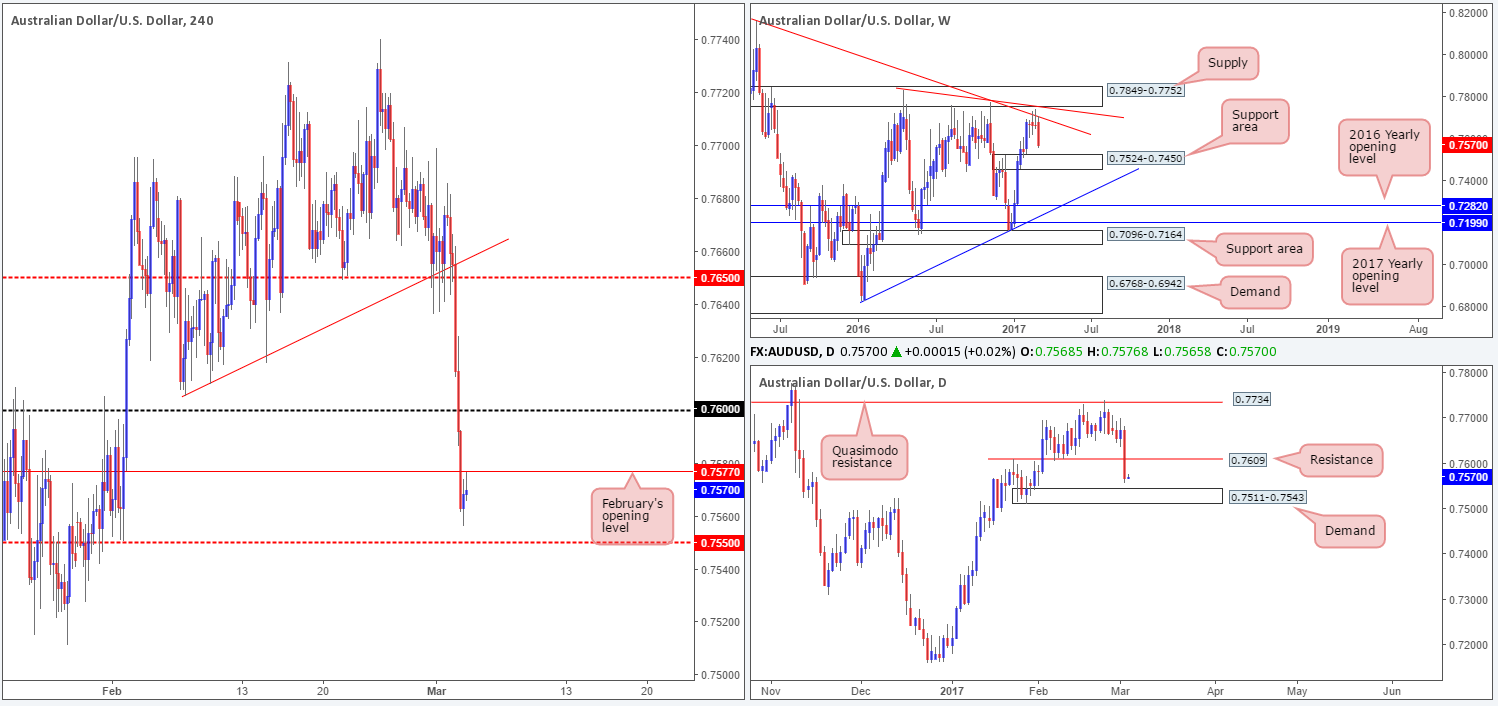
AUD/USD:
In recent hours, the commodity-linked currency drove below a H4 mid-way support at 0.7650 and its intersecting H4 channel support line taken from the low 0.7605. Assuming that the H4 candles close below 0.7650, we may have an interesting setup at hand.
The ingredients behind our current line of thought stems from the following:
- Weekly price is currently selling off from a weekly trendline resistance stretched from the high 0.8163, and shows room to trade as far down as the weekly support area drawn from 0.7524-0.7450.
- Along the same vein, daily structure indicates that there is space to continue selling off down to a daily support level coming in at 0.7609.
- On the H4 chart, there appears to be little active demand to the left of current price (see the green arc).
Our suggestions: With the above points in mind, we will be watching for a H4 close to form beyond the 0.7650 neighborhood, and then look to trade any (confirmed – a reasonably sized H4 bearish candle) retest seen at this area, targeting the 0.76 region (which, as we’re sure you’re aware by now also represents the daily support level mentioned above).
Data points to consider: Australian GDP figures at 12.30am, Caixin Manufacturing PMI at 1.45am. US President Trump speaks at 2am, US Core PCE price index at 1.30pm, US ISM manufacturing PMI at 3pm, FOMC member Kaplan speaks at 6pm, FOMC member Brainard speaks at 11pm GMT.
Levels to watch/live orders:
- Buys: Flat (stop loss: N/A).
- Sells: Watch for a H4 close below 0.7650 and look to trade any retest seen thereafter ([we would also advise waiting for a reasonably sized H4 bear candle to form following the retest before looking to execute a trade] stop loss: ideally beyond the trigger candle).
USD/JPY:
Throughout the course of yesterday’s US session, the bulls, as you can see, aggressively nudged higher. Several H4 tech resistances were consumed, with price now seen trading beyond the 113 handle. For those who read Tuesday’s report you may recall our team mentioning that we would need to see the H4 candles close above the 113 neighborhood before considering becoming buyers in this market.
Assuming that the current H4 candle does in fact close above 113 today and the number holds firm as support, we feel there is a good chance that price will look to reach the H4 supply zone at 113.84-113.62. Our reasoning lies within the higher-timeframe structures. Weekly action has been hovering above a weekly support area at 111.44-110.10 for the best part of a month now, and daily price is trading from a daily demand base that sits on top of the aforementioned weekly support area at 111.35-112.37. Therefore, we feel the bulls do have a slight edge this morning.
Our suggestions: We will be watching for a H4 close to form beyond the 113 neighborhood, and then look to trade any (confirmed – a reasonably sized H4 bullish candle would suffice) retest seen at this area, targeting the H4 supply at 113.84-113.62 as an initial take-profit zone.
Data points to consider: US President Trump speaks at 2am, US Core PCE price index at 1.30pm, US ISM manufacturing PMI at 3pm, FOMC member Kaplan speaks at 6pm, FOMC member Brainard speaks at 11pm GMT.

Levels to watch/live orders:
- Buys: Watch for a H4 close above 113 and then look to trade any retest seen thereafter ([we would also advise waiting for a reasonably sized H4 bull candle to form following the retest before looking to execute a trade] stop loss: ideally beyond the trigger candle).
- Sells: Flat (stop loss: N/A).
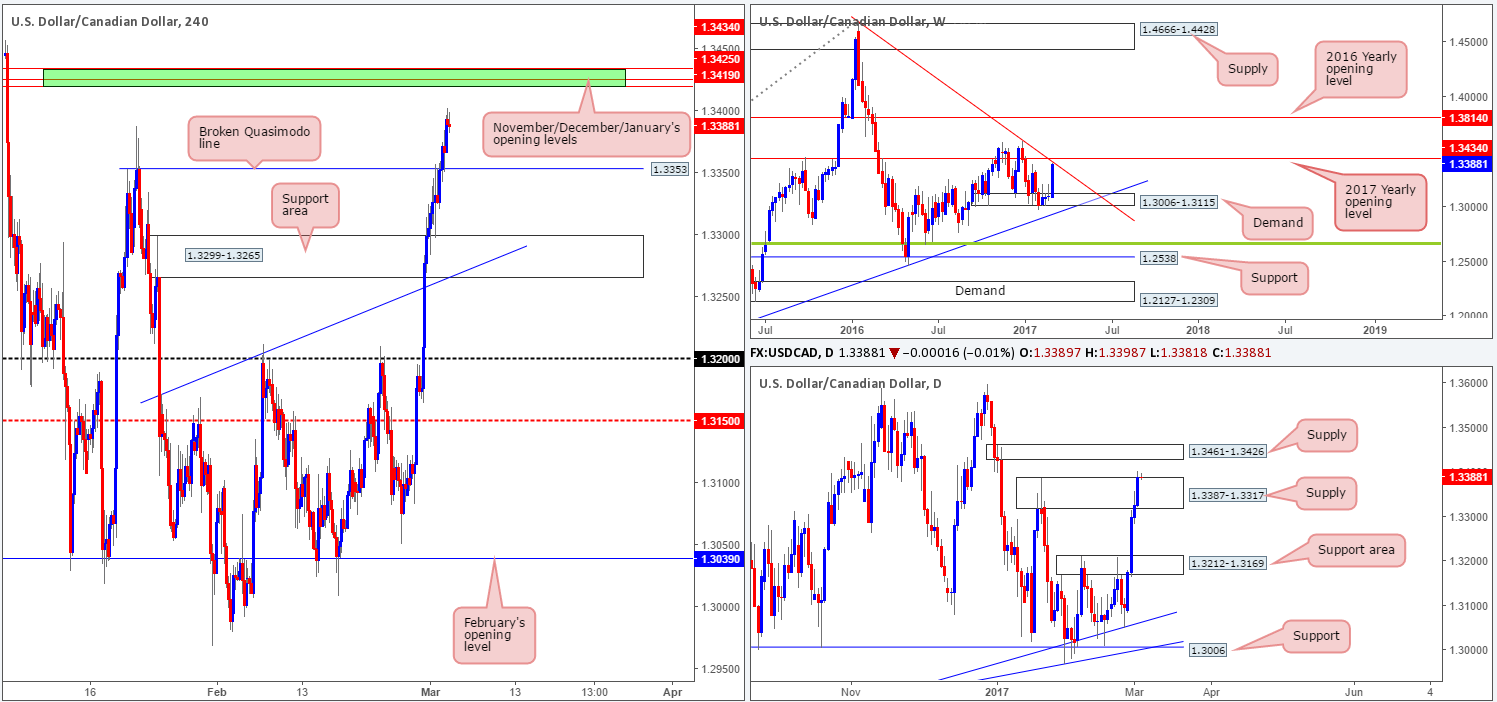
USD/CAD:
Across the board, we saw the US dollar rally against the majority of its trading peers amid yesterday’s US segment. As you can see on the USD/CAD chart, H4 price chomped its way through both the upper H4 channel resistance extended from the high 1.3171 and a H4 supply zone coming in at 1.3299-1.3265 (now an acting support area).
Despite the recent advance, our desk believes that the pair is signaling overbought conditions in this market. Over on the daily chart, the candles recently shook hands with the underside of a daily supply zone at 1.3387-1.3317. This – coupled with H4 action trading just ahead of a H4 161.8% Fib ext. level at 1.3332 (taken from the low 1.3008) and a H4 Quasimodo resistance level at 1.3353, potentially hints that a selloff may be on the horizon.
Our suggestions: On the whole, our team is very interested in the area seen between 1.3353/1.3332 (the above noted H4 Quasimodo resistance and the H4 161.8% ext. level). We will be watching to see how price reacts to this area because ideally we would like to enter short around the H4 Quasimodo level, thus allowing us to place stops above the daily supply edge at 1.3389.
Data points to consider: US President Trump speaks at 2am, US Core PCE price index at 1.30pm, US ISM manufacturing PMI at 3pm, FOMC member Kaplan speaks at 6pm, FOMC member Brainard speaks at 11pm. BoC rate statement at 3pm AND Crude oil inventories at 3.30pm GMT.
Levels to watch/live orders:
- Buys: Flat (stop loss: N/A).
- Sells: 1.3353 region ([an area one could possibly trade at market] stop loss: above the current daily supply at 1.3389).
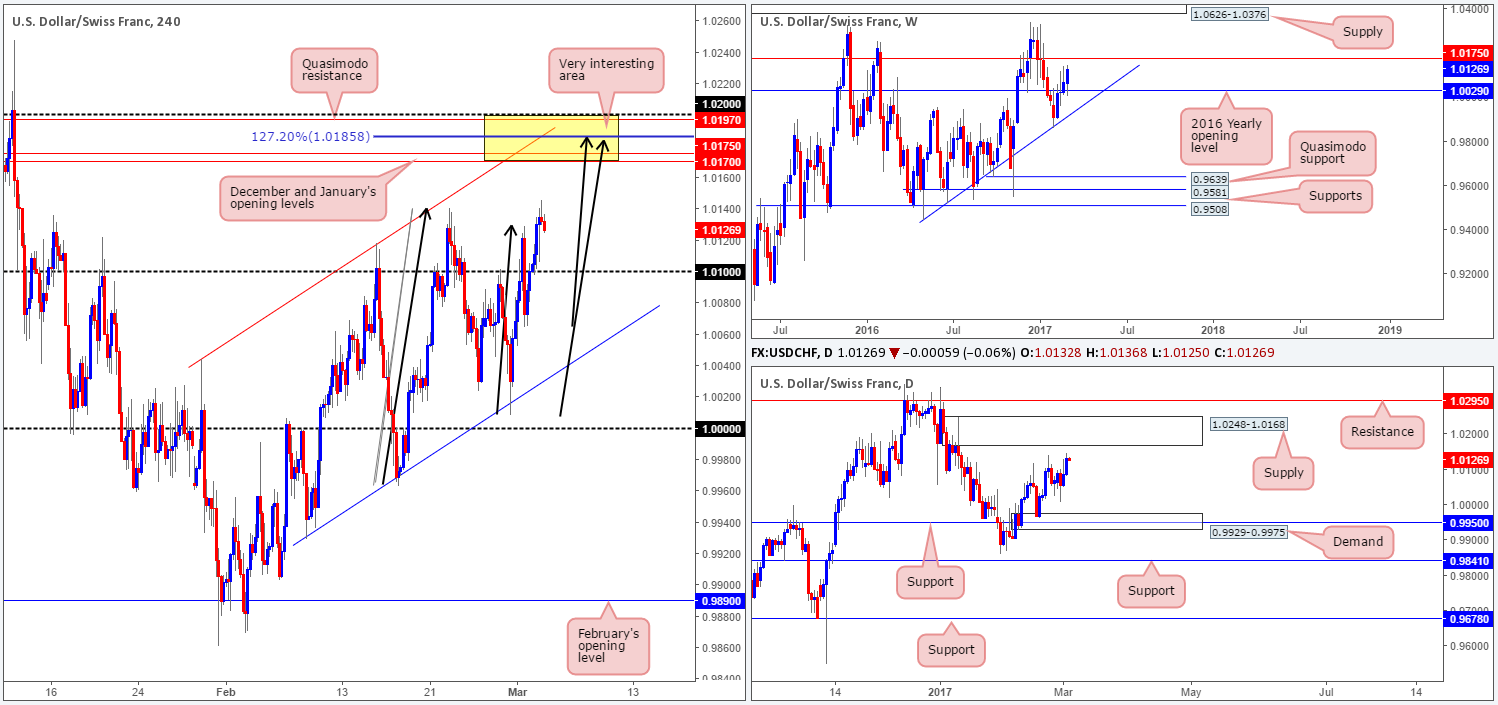
USD/CHF:
The USD/CHF pair, as you can see, recently touched gloves with the H4 channel support line extended from the low 0.9929 and aggressively rallied higher. The next area of interest can be seen at 1.0116-1.0099: a H4 supply zone that encapsulates the 1.01 handle. While this H4 supply zone could potentially hold the market lower today, we feel it is somewhat vulnerable since the more attractive area (in yellow), in our opinion, is seen above! The zone comprises of the following converging structures: both December and January’s opening levels at 1.0170/1.0175, a H4 AB=CD 127.2% Fib ext. at 1.0185, an upper H4 channel resistance line pegged from the high 1.0044, a H4 Quasimodo resistance at 1.0197, a 1.02 psychological handle and let’s not forget that all of this is seen housed within the daily supply zone coming in at 1.0248-1.0168.
Our suggestions: In light of this confluence, our team will, dependent on the time of day, look to sell from the H4 127.2% Fib ext. level with stops placed a few pips above 1.02. In addition to this, we see little reason not to look to buy any break of the current H4 supply zone up to our H4 sell area. However, we would insist on not only a clean H4 close above the supply, but also a retest of the zone as demand followed by a reasonably sized H4 bull candle before committing to a position.
Data points to consider: US President Trump speaks at 2am, US Core PCE price index at 1.30pm, US ISM manufacturing PMI at 3pm, FOMC member Kaplan speaks at 6pm, FOMC member Brainard speaks at 11pm GMT.
Levels to watch/live orders:
- Buys: Watch for a H4 close above the current H4 supply area and look to trade any retest seen thereafter ([we would also advise waiting for a reasonably sized H4 bull to form following the retest candle before looking to execute a trade] stop loss: ideally beyond the trigger candle).
- Sells: 1.0185 region ([an area one could possibly trade at market] stop loss: 1.0205).
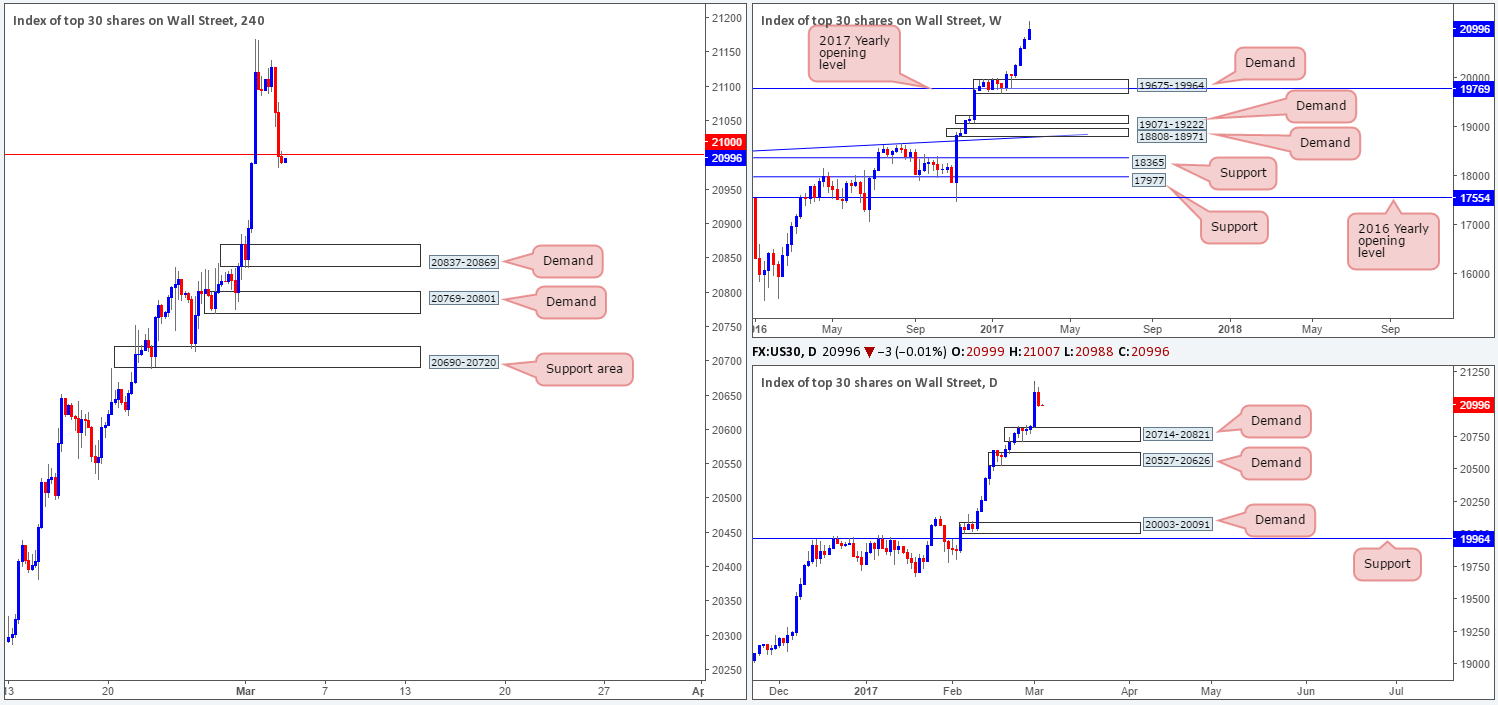
DOW 30:
US equities continued to climb northbound yesterday, and is, as a result, consequently trading at a fresh record high of 20886 as we write.
With equities now trading at record highs, where do we go from here? Well, given that there is absolutely no weekly resistance levels in sight, the best we can do for the time being is continue looking to ‘buy the dips’. The closest higher-timeframe area can be seen at 20527-20626: a daily demand zone.
Over on the H4 chart, price respected the minor H4 demand area at 20769-20801 beautifully yesterday. Although this zone boasts no higher-timeframe (structural) convergence, the buyers have already proved its value. Therefore, it remains of interest to our desk today.
Our suggestions: Just to be clear here though, placing pending orders at this zone is not advised, since there’s little stopping price from ignoring this area and heading to the H4 support zone below 20690-20720, or even the H4 demand seen at 20621-20650 which happens to be positioned around the top edge of the current daily demand base. Waiting for additional confirmation such as a lower-timeframe buy signal (see the top of this report) or a reasonably sized H4 bull candle is, at least in our opinion, the safer, more logical, path to take.
Data points to consider: US President Trump speaks at 2am, US Core PCE price index at 1.30pm, US ISM manufacturing PMI at 3pm, FOMC member Kaplan speaks at 6pm, FOMC member Brainard speaks at 11pm GMT.
Levels to watch/live orders:
- Buys: 20769-20801 ([waiting for additional confirmation is advised before looking to execute a trade] stop loss: dependent on how one chooses to confirm the zone).
- Sells: Flat (stop loss: N/A).
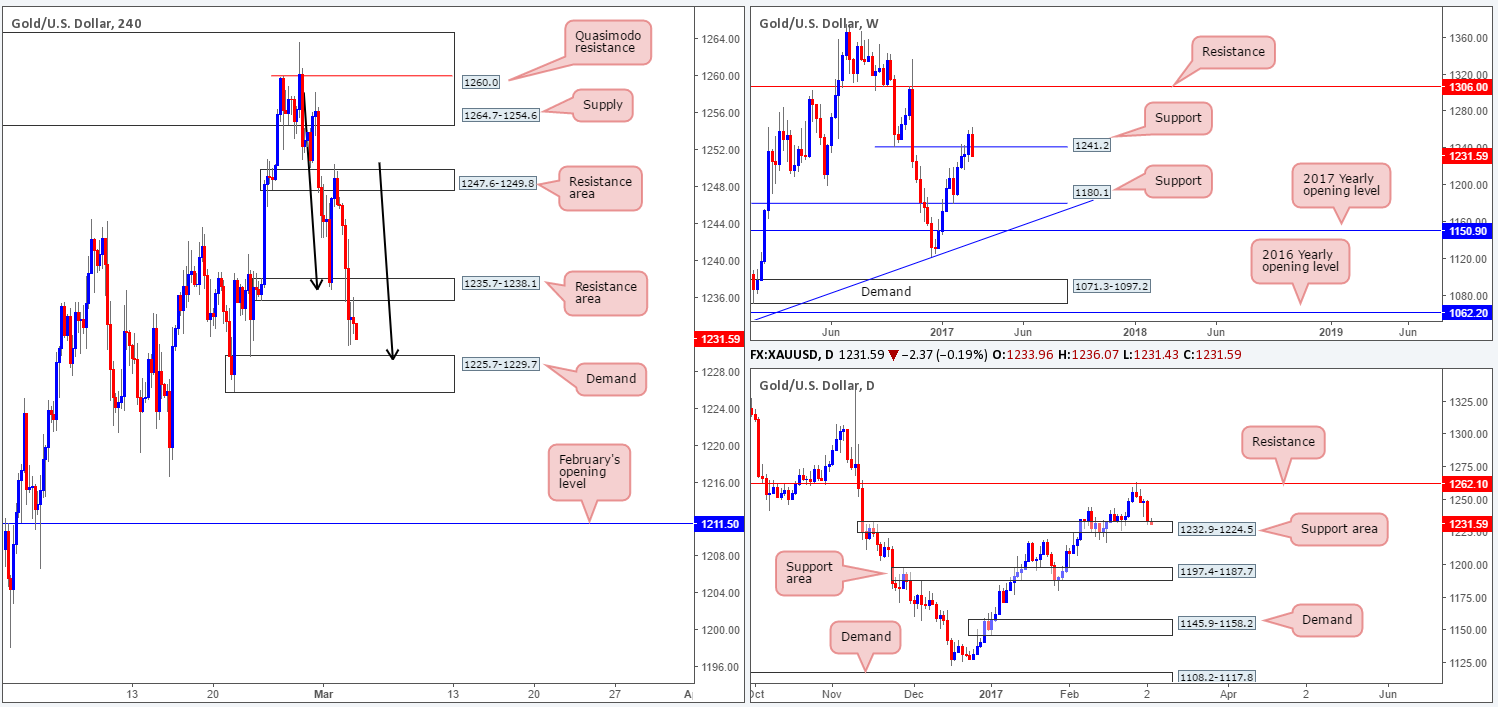
GOLD:
Yesterday’s dollar gains, as you can see, consequently pushed the gold market lower. H4 price took out the H4 demand base coming in at 1247.6-1249.8 and retested the H4 support area seen at 1244.5-1242.4, which happens to merge nicely with a H4 trendline support etched from the high 1244.5. Also noteworthy is the fact that yesterday’s descent brought the unit down to within an inch of the weekly support level at 1241.2! This begs the question, where does one turn from here?
Our suggestions: Quite frankly, there is not much room for the H4 candles to stretch their legs at present. A break below the current H4 support area will soon have to contend with the H4 trendline support taken from the low 1216.5. Likewise, a push above the 1247.6-1249.8 zone (which happens to now be a H4 resistance area) also shows little room for maneuver given the overhead H4 supply at 1264.7-1254.6.
In the absence of clearer price action our desk will humbly take a back seat today and look to reassess going into tomorrow’s session.
Levels to watch/live orders:
- Buys: Flat (stop loss: N/A).
- Sells: Flat (stop loss: N/A).


