
EUR/USD:
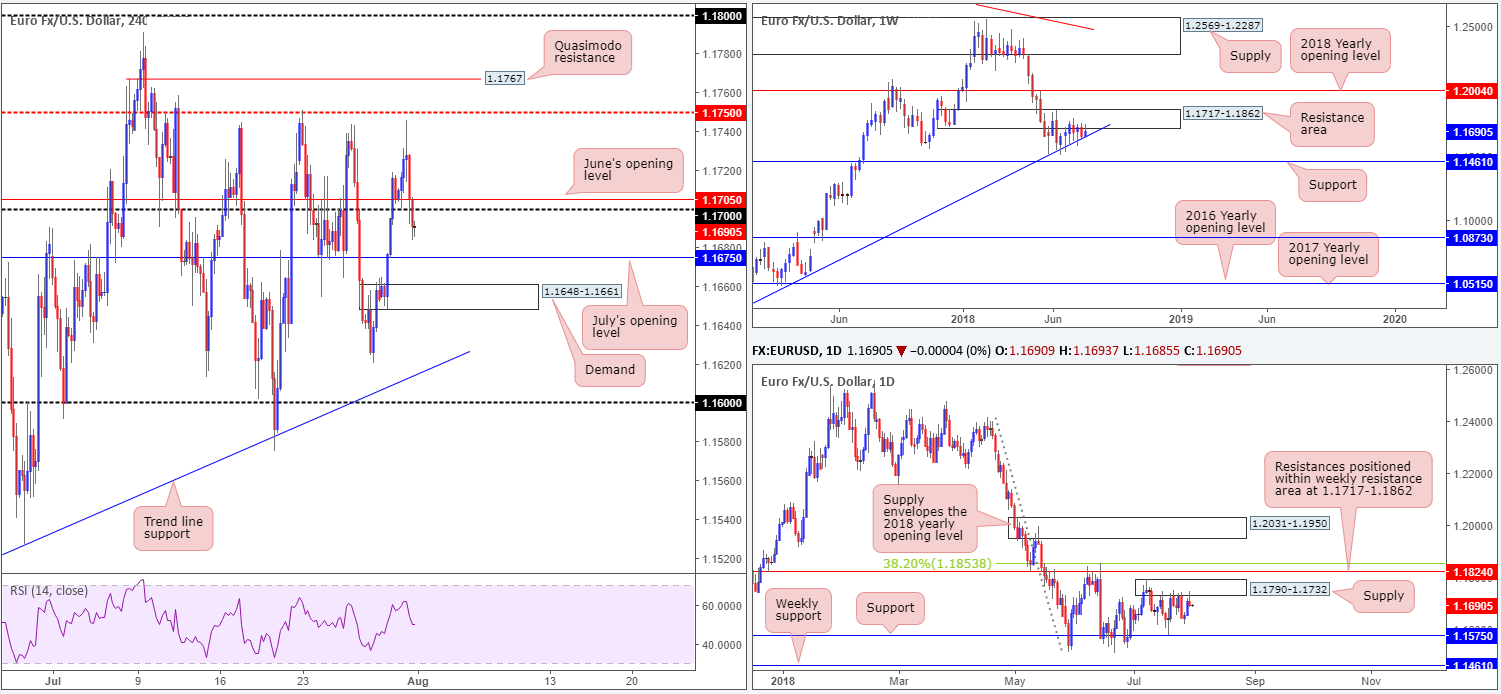
Going into the early hours of US trading on Tuesday, the single currency hit the brakes and reversed course ahead of a H4 mid-level resistance at 1.1750. The buck pared back earlier losses (DXY recently crossed above 94.50) on a generally constructive run of data and on headlines indicating the US and China are attempting to restart trade talks.
The H4 candles, as you can see, concluded the day sub 1.17, poised to challenge nearby July’s opening level at 1.1675, followed closely by demand at 1.1648-1.1661. Note, we have yet to retest the underside of 1.17 on this timeframe.
Meanwhile, as of late May, weekly movement has been confined to a tight range comprised of a resistance area plotted at 1.1717-1.1862 and a trend line support (etched from the low 1.0340). Areas outside of this border to keep eyeballs on fall in at the 2018 yearly opening level drawn from 1.2004 (resistance), and support pencilled in at 1.1461.
In terms of daily action, supply at 1.1790-1.1732, an area clearly of interest in this market at the moment, was brought into the fold yesterday. It is important to note the reaction from this base formed a nice-looking bearish pin-bar candle formation, which could potentially encourage selling back down to support etched in at 1.1575.
Areas of consideration:
With 1.17 out of the picture as support, one could attempt to sell the market, knowing daily supply is in play (see above). The only limitation being July’s opening level at 1.1675, followed by the H4 demand mentioned above at 1.1648-1.1661. We’re sure most would agree shorts on the retest of 1.17 does not offer the best risk/reward conditions as we only have 25 pips of room to play with until hitting the first target (1.1675).
Price action on the EUR/USD is, therefore, labelled as restricted for the time being.
Today’s data points: US ADP non-farm employment change; US ISM manufacturing PMI; FOMC statement and rate decision.
GBP/USD:
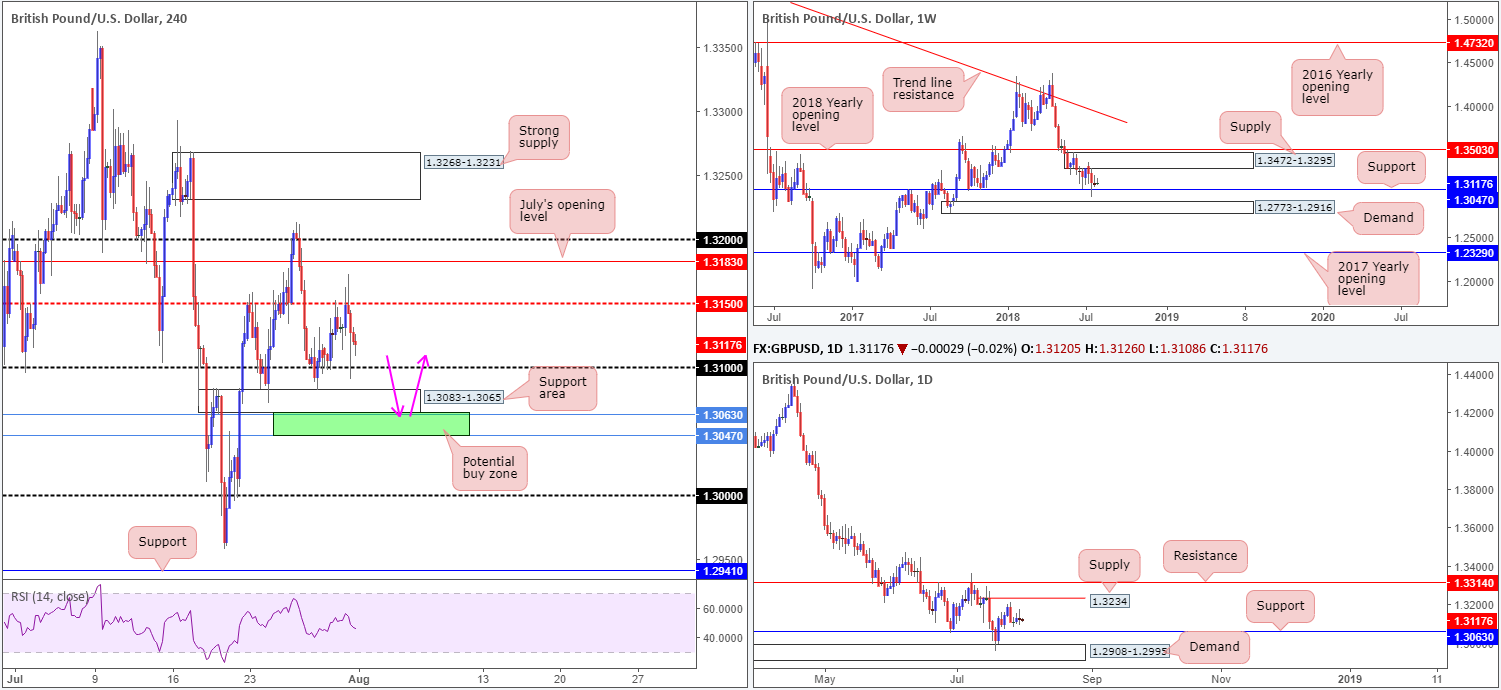
Trading exclusively on USD strength/weakness on Tuesday, the British pound failed to sustain gains beyond H4 mid-level resistance at 1.3150, eventually seen testing (marginally surpassing) nearby psychological support at 1.31. With stop-loss orders likely tripped beneath this number, traders’ crosshairs are now likely fixed on the H4 support area drawn in at 1.3083-1.3065.
Technically speaking, higher-timeframe flows show weekly price remains buoyant above support at 1.3047, a barrier displaying history as far back as mid-2015. Daily price, on the other hand, continues to drift between a supply seen at 1.3234 and support priced in at 1.3063.
Areas of consideration:
On account of the above reading, the team still believes the market has a soft spot for the small H4 area marked in green at 1.3047/1.3063 as a possible buy zone, comprised of both the aforementioned weekly and daily supports. Besides its construction being made up of higher-timeframe levels, stop-loss orders beneath 1.31 and the noted H4 support area will also likely provide liquidity to those with big pockets looking to buy from here.
The first ‘trouble’ area from 1.3047/1.3063 can be seen at 1.31. A H4 close above this barrier would be an ideal cue to begin thinking about taking some profit off the table and reducing risk to breakeven.
Aggressive traders may look to buy the top edge (1.3063) at market with stop-loss orders tucked beneath the zone at 1.3045. Conservative traders, however, might want to consider holding fire and waiting for a H4 full or near-full-bodied bull candle to form (stops beneath the candle’s rejection tail) before pulling the trigger.
Today’s data points: UK manufacturing PMI; US ADP non-farm employment change; US ISM manufacturing PMI; FOMC statement and rate decision.
AUD/USD:
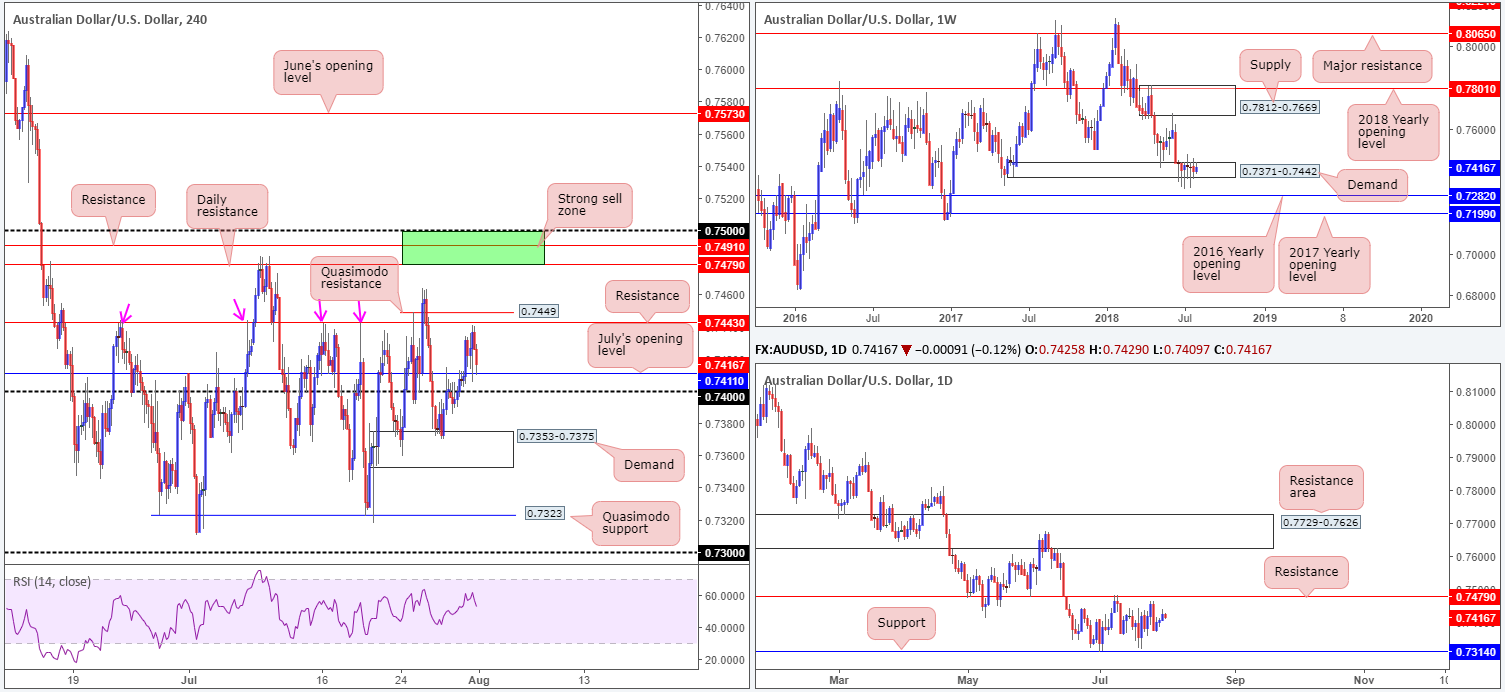
Bolstered by a better-than-expected showing for Aussie building permit figures in early trade on Tuesday, the commodity currency penciled in a positive day against its US rival. July’s opening level seen on the H4 timeframe at 0.7411 was taken out and shortly after retested as support. The H4 candles, however, failed to test nearby H4 resistance plotted at 0.7443, topping just south of the level at 0.7440.
As you can see, H4 structure remains restricted right now. Between 0.7411 and 0.7443, one has less than 30 pips to play with, whereas a push back beneath the 0.74 handle, sellers have the top edge of demand to target at 0.7375 – even less room! A break through 0.7443 and nearby H4 Quasimodo resistance at 0.7449, nonetheless, likely opens the path to 0.75/0.7479, a H4 sell zone marked in green comprised of a round number, a H4 resistance and daily resistance.
In terms of weekly price action, little has changed over the past month and a half. Demand at 0.7371-0.7442 remains in a fragile state, opening the window to a possible test of the 2016 yearly opening level at 0.7282 sometime down the road. In the event the bulls regain consciousness, however, a retest of supply at 0.7812-0.7669 may eventually be on the cards. The reason behind the lack of movement on the weekly timeframe, technically that is, likely has something to do with the fact daily flow continues to respect its current range. Since early July, the commodity currency has fluctuated between support drawn from 0.7314 and resistance chalked up at 0.7479.
Areas of consideration:
The only area of interest that jumps out at us this morning is the H4 sell zone mentioned above at 0.75/0.7479. Already holding price lower once in early July, this area has a healthy chance of holding should it be tested. As the approach has yet to complete it’s difficult to pin down any firm take-profit targets. In regards to stop-loss orders, nevertheless, traders are urged to wait for H4 price to print something of note (a full or near-full-bodied H4 bear candle) from within the zone (tuck stops above the candle’s rejection wick), since there’s a chance the market may witness a fakeout above 0.75 (common viewing around psychological boundaries).
Today’s data points: US ADP non-farm employment change; US ISM manufacturing PMI; FOMC statement and rate decision.
USD/JPY:
Soaring to its highest level in two weeks at 111.95, the USD/JPY rallied on a combination of a dovish BoJ, US-China headlines and a generally constructive run of US data. H4 mid-level resistance at 111.50 was firmly wiped out, leaving the candles hovering just south of the 112 handle into the closing bell. Though this psychological number is likely on the radar of many this morning, note directly above here we also have a strong H4 supply zone sitting at 112.50-112.20. Also worth noting on the H4 scale is the RSI indicator is seen nearing its overbought value.
Yesterday’s push higher was to be expected, according to weekly structure. The market recently bumped heads with a trend line resistance-turned support (taken from the high 123.57). Having seen this line hold firm as resistance on a number of occasions in the past, the chance of this barrier holding as support was strong. The next upside target on this scale falls in at the 2018 yearly opening level drawn from 112.65. Turning the focus to the daily timeframe, though, nearby resistance is seen at 112.11, following a solid reaction off demand at 110.28-110.78.
Areas of consideration:
Though yesterday’s move likely excited momentum traders, caution is advised! We are heading into significant resistance on all three timeframes:
- H4 supply at 112.50-112.20 and the round number 112.
- Daily resistance at 112.11.
- Weekly resistance at 112.65.
Note the daily resistance is fixed between the H4 supply area and round number. Also note the weekly resistance level is seen plotted directly above the H4 supply.
Therefore, between 112.65 and 112 (upper green zone) is an area we expect active sellers to eventually make an appearance. Trading this area for most traders, however, is not feasible due to its size. Therefore, keep eyes on the H4 supply at 112.50-112.20, with the expectation of a fakeout through this zone to nearby weekly resistance to sell (a H4 bearish pin-bar candle formation that pierces through the top edge of H4 supply and tags weekly resistance would be an ideal sell signal, in our view – stops tucked above the rejection candle’s wick).
Today’s data points: US ADP non-farm employment change; US ISM manufacturing PMI; FOMC statement and rate decision.

USD/CAD:
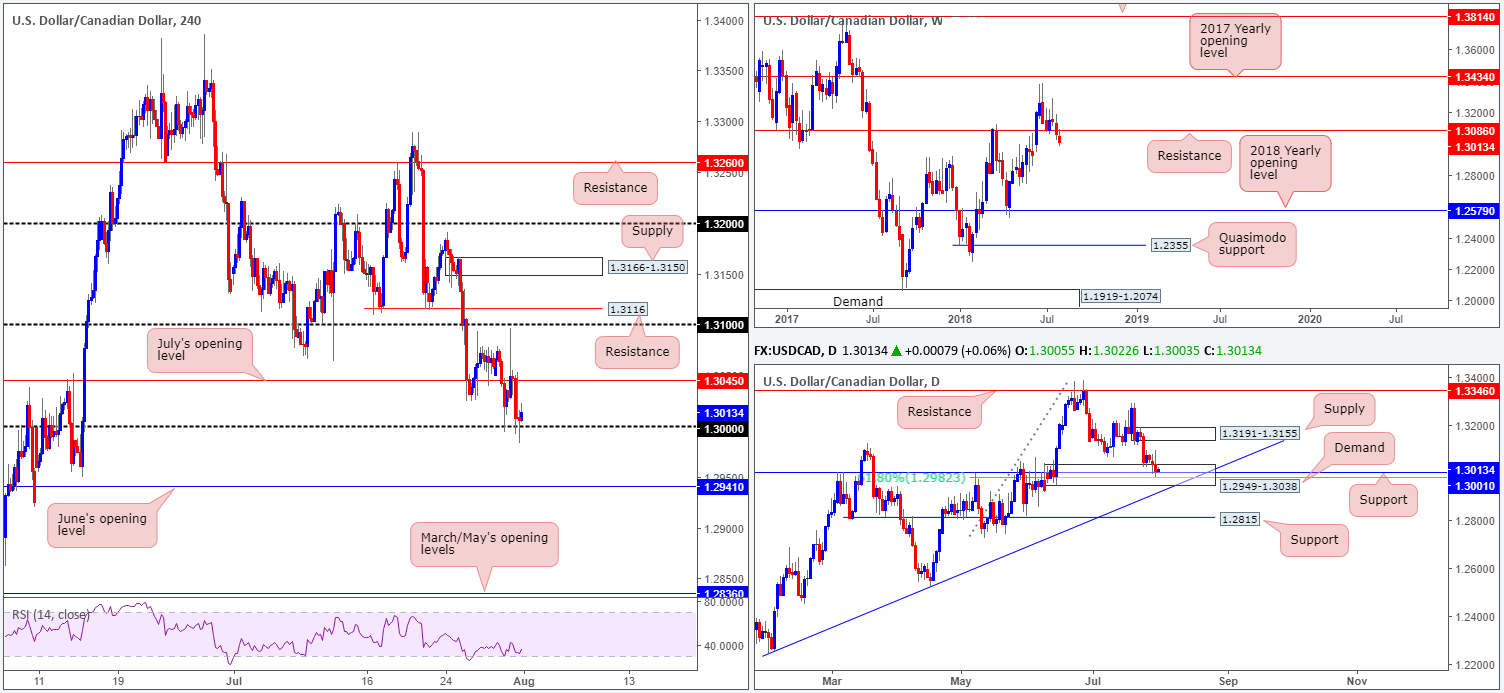
Growth data out of Canada on Tuesday showed the economy expanded by 0.5% in May, surpassing market estimates of 0.3%. The news sparked an immediate round of selling on USD/CAD (check M30), bringing the unit to the key figure 1.30 on the H4 timeframe. The move was short-lived, though, as buyers defended 1.30 in a similarly aggressive fashion. The next upside objective from 1.30 falls in at 1.3045: July’s opening level, whereas below 1.30, June’s opening level is seen at 1.2941.
On a wider perspective, the weekly candles are still seen lurking beneath support coming in at 1.3086 (now acting resistance). In terms of obvious support beneath 1.3086, we do not see a whole lot stopping this market from reaching as far south as 1.2579: the 2018 yearly opening level. In spite of last week’s close beneath weekly support, daily price remains toying with a rather attractive demand area visible at 1.2949-1.3038. Within this area we also see strong support standing at 1.3001 (history dating back to Sept 2016), followed closely by a 61.8% Fib support value at 1.2982. The next upside target from this area can be seen around supply fixed at 1.3191-1.3155. It may also interest traders to know WTI found strong resistance at daily supply drawn from 71.63-70.05 yesterday.
Areas of consideration:
Intraday longs from 1.30 has 1.3045 (H4 July’s opening level) to target as its initial port of call. This is supported by the noted daily supports, though against weekly flow in that one is attempting to buy a market that recently broke weekly support. Technically, this could be the reason behind the lackluster response off 1.30 so far.
As you can see, irrespective of the direction one selects here, opposing structure is clearly evident. As such, if you’re not willing to accommodate this risk, opting to remain on the sidelines may be the better path to take today.
Today’s data points: US ADP non-farm employment change; US ISM manufacturing PMI; FOMC statement and rate decision; Crude oil inventories.
USD/CHF:
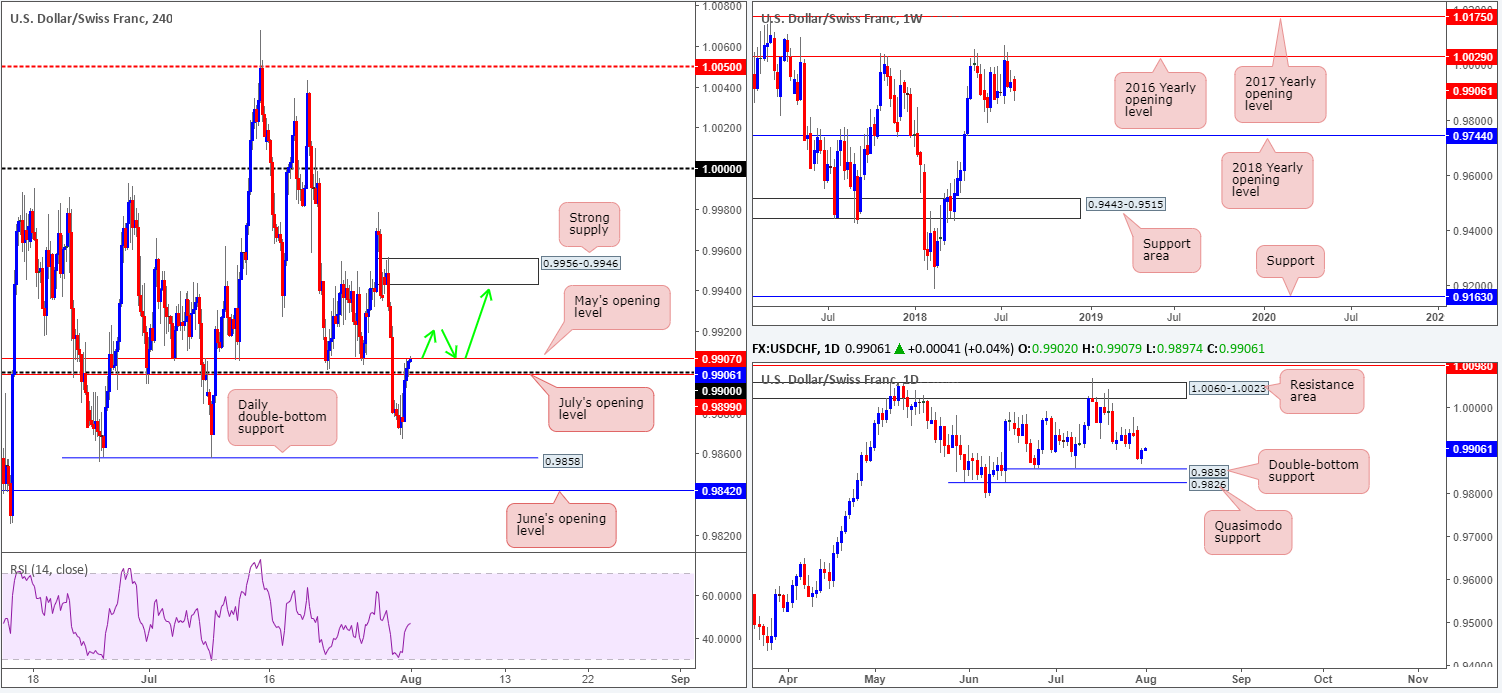
Rebounding from 3-week lows of 0.9867 on Tuesday, a wave of USD buying brought the USD/CHF marginally beyond the 0.99 handle/July’s opening level at 0.9899 on the H4 timeframe. Traders ditched the safe-haven CHF on headlines indicating the US and China are attempting to restart trade talks, along with generally constructive US economic data. As of current price, we can see the H4 candles shaking hands with resistance in the shape of May’s opening level at 0.9907.
From a weekly perspective, further downside is still expected. Weekly price remains capped by the 2016 yearly opening level at 1.0029. Holding price lower on two occasions in 2017, and twice already in 2018, this level commands attention! Further selling from current price has the June lows at 0.9788 to target, as well as the 2018 yearly opening level at 0.9744. In terms of daily action, recent selling saw price bottom just north of 0.9858: a double-bottom support, shadowed closely by Quasimodo support at 0.9826.
Areas of consideration:
Should the H4 candles close above 0.9907 today, upside appears free to challenge supply at 0.9956-0.9946. While the path is clear beyond 0.9907, bear in mind we have limited higher-timeframe convergence supporting this move. As such, consider waiting and seeing if H4 price can retest the top edge of 0.9907 in the shape of a full or near-full-bodied bull candle, before pulling the trigger (stop-loss orders can be tucked beneath the candle’s rejection tail).
Today’s data points: US ADP non-farm employment change; US ISM manufacturing PMI; FOMC statement and rate decision.
Dow Jones Industrial Average:
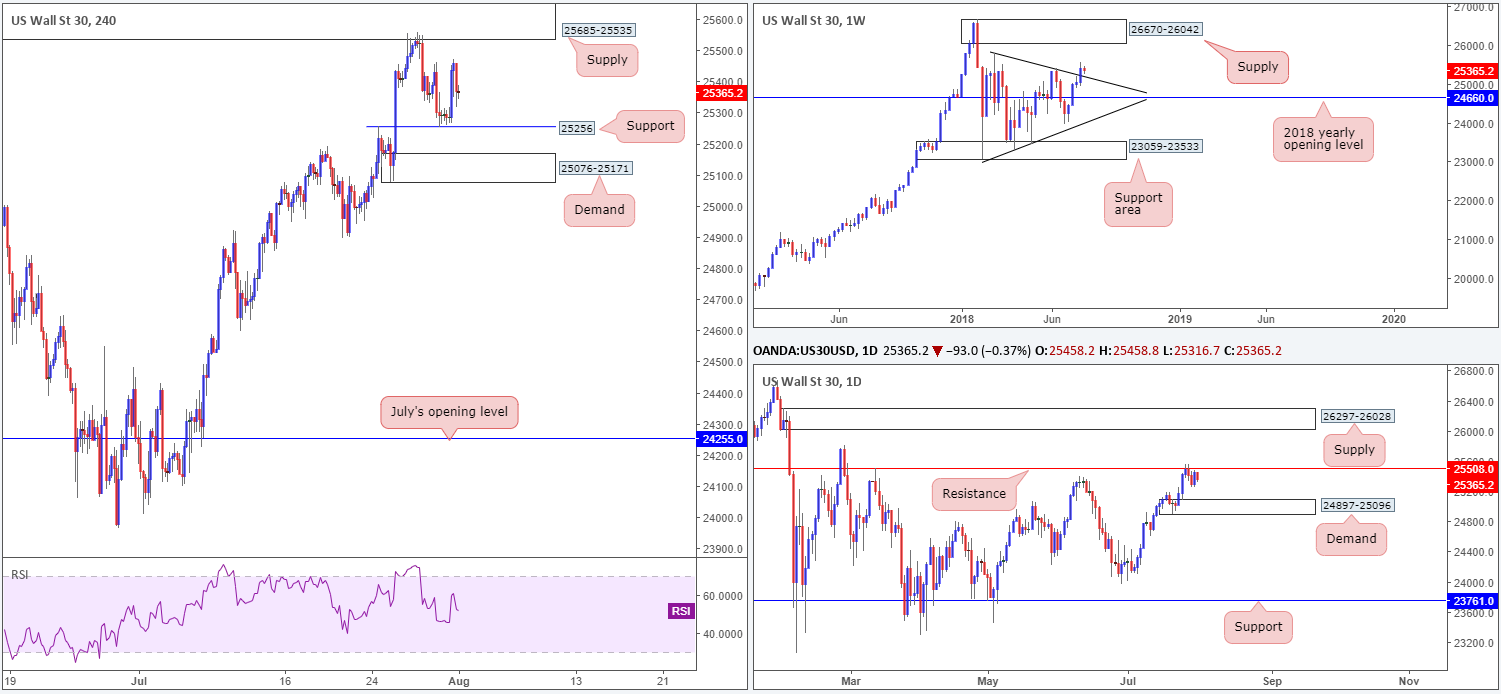
US equities received a boost on Tuesday following news indicating the US and China are attempting to restart trade talks.
H4 support (previously engulfed high) at 25256, as you can see, managed to hold ground, consequently challenging Monday’s high at 25462. Although a round of selling came about in recent trade, H4 supply seen overhead at 25685-25535 remains an area of interest. Traders may have also noticed daily resistance at 25508 is seen plotted just south of this zone. Another key area to keep eyes on is the H4 demand base located at 25076-25171, which happens to be glued to glued to the top edge of daily demand at 24897-25096.
As highlighted in yesterday’s briefing, weekly traders need to remain prepared for the possibility of a retest of the recently broken trend line resistance-turned support (etched from the high 25807). From this point, we could be looking at a run up to supply coming in at 26670-26042.
Areas of consideration:
As the current H4 support lacks higher-timeframe confluence, our outlook in terms of tradable areas remains unchanged:
Seeing as how both daily and H4 demand areas are located nearby the weekly trend line support, a buy from the current H4 demand base is an option today. Conservative traders, nevertheless, may opt to wait and see if daily price probes lower into the noted daily demand area (implies a fakeout of the H4 demand), before pulling the trigger. That way, one has a relatively safe position to site stops: the underside of daily demand at 24897.
Today’s data points: US ADP non-farm employment change; US ISM manufacturing PMI; FOMC statement and rate decision.
XAU/USD (Gold):
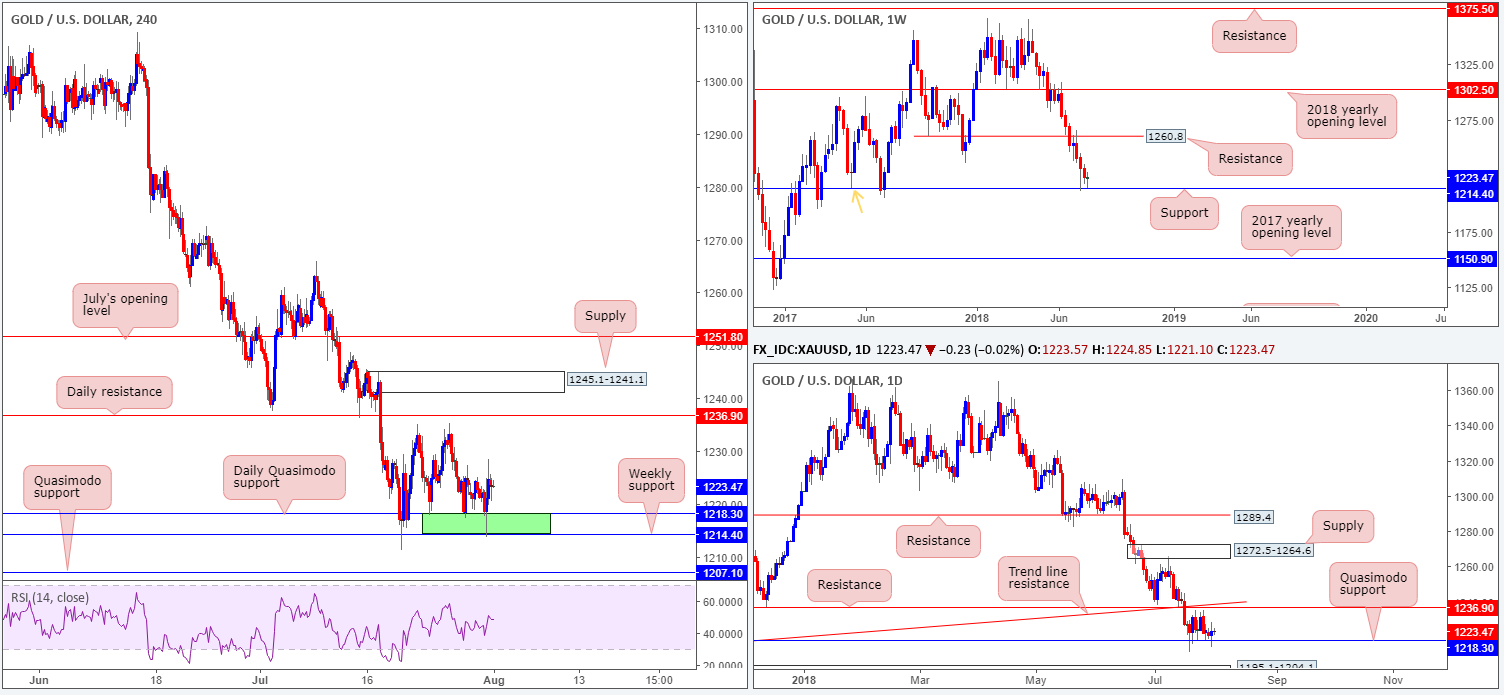
Kicking off with a look at the weekly timeframe, traders witnessed another test of weekly support at 1214.4 in recent trade. Note this level also happens to represent a Quasimodo support taken from the left shoulder marked with an orange arrow.
In terms of daily movement, the candles continue to respect a Quasimodo support located at 1218.3. The disappointing aspect from here, however, is over the past week or so price has attempted to probe higher, though failed ahead of nearby resistance at 1236.9, which, as you can see, converges with a trend line support-turned resistance (carved from the low 1195.1). The next base to be aware of, should we see the yellow metal push south that is, comes in at 1195.1-1204.1: a demand area not seen on the screen.
In spite of a bearish overtone in this market, given the current trend (see higher timeframes), readers may recall the team has been banging the drum about a H4 zone marked in green at 1214.4/1218 (weekly and daily supports – see above). As you can see, this zone remains firm for the time being, despite a number of attempts to push lower.
Areas of consideration:
Though little development is being seen off higher-timeframe supports at the moment, we believe buyers will continue bidding the price of gold higher from 1214.4-1218.3 on the H4 scale until reaching daily resistance at 1236.9. It is here we feel strong sellers reside.
How one goes about pinning down an entry to take advantage of this move is the challenge! One option could be simply waiting for a H4 bullish candlestick formation to form: a bullish engulfing formation or a bullish pin-bar setup.
The use of the site is agreement that the site is for informational and educational purposes only and does not constitute advice in any form in the furtherance of any trade or trading decisions.
The accuracy, completeness and timeliness of the information contained on this site cannot be guaranteed. IC Markets does not warranty, guarantee or make any representations, or assume any liability with regard to financial results based on the use of the information in the site.
News, views, opinions, recommendations and other information obtained from sources outside of www.icmarkets.com.au, used in this site are believed to be reliable, but we cannot guarantee their accuracy or completeness. All such information is subject to change at any time without notice. IC Markets assumes no responsibility for the content of any linked site. The fact that such links may exist does not indicate approval or endorsement of any material contained on any linked site.
IC Markets is not liable for any harm caused by the transmission, through accessing the services or information on this site, of a computer virus, or other computer code or programming device that might be used to access, delete, damage, disable, disrupt or otherwise impede in any manner, the operation of the site or of any user’s software, hardware, data or property.


