
A note on lower timeframe confirming price action…
Waiting for lower timeframe confirmation is our main tool to confirm strength within higher timeframe zones, andhas really been the key to our trading success. It takes a little time to understand the subtle nuances, however, as each trade is never the same, but once you master the rhythm so to speak, you will be saved from countless unnecessary losing trades. The following is a list of what we look for:
- A break/retest of supply or demand dependent on which way you’re trading.
- A trendline break/retest.
- Buying/selling tails – essentially we look for a cluster of very obvious spikes off of lower timeframe support and resistance levels within the higher timeframe zone.
- Candlestick patterns. We tend to only stick with pin bars and engulfing bars as these have proven to be the most effective.
EUR/USD:
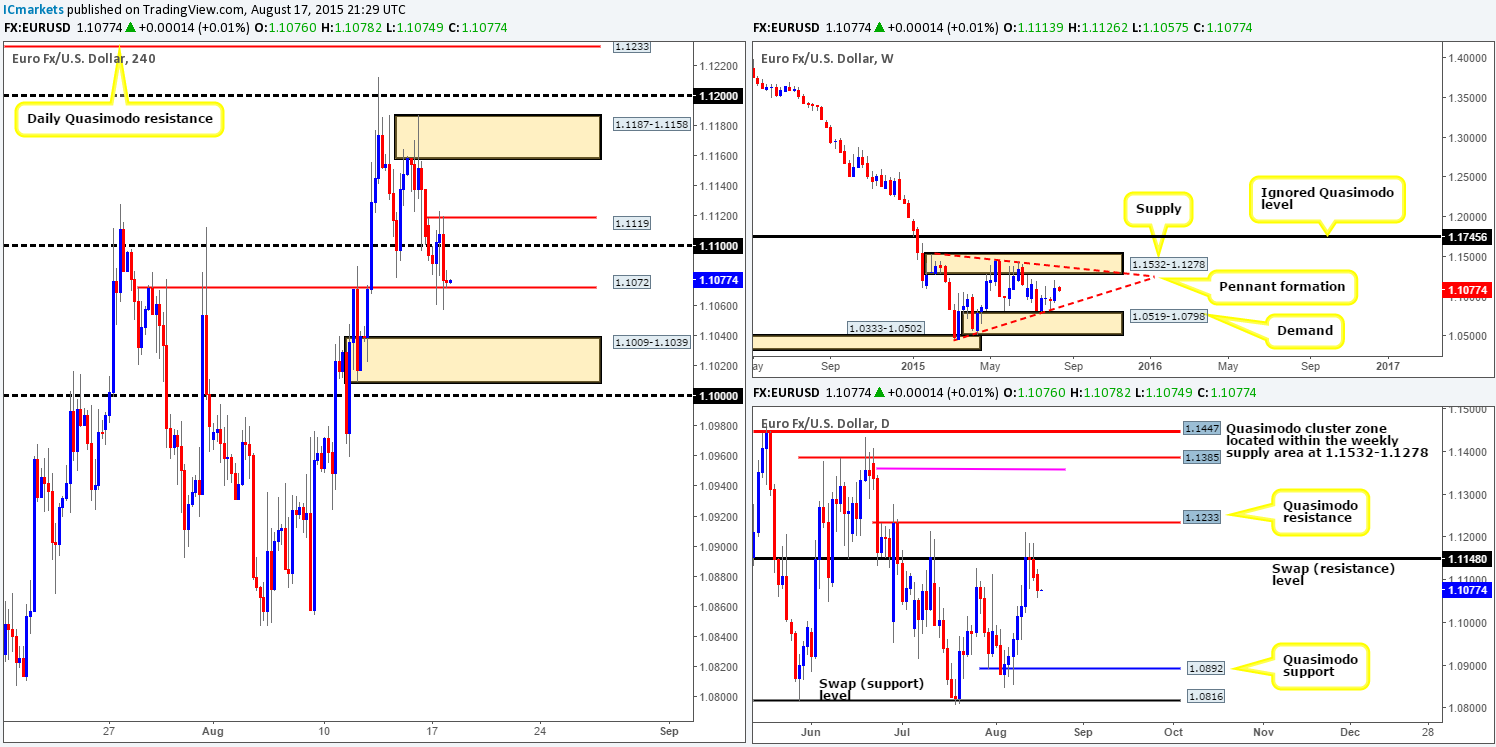
The EUR/USD couple declined for a third consecutive day amid yesterday’s trade, resulting in price taking out 1.1072 and slam dunking itself into 4hr demand at 1.1009-1.1039. This is no doubt a very tempting place for traders to buy. Nevertheless, our team has decided to pass on this this zone, since room to continue south is being seen on both the weekly and daily charts at the moment. Near-term support on the weekly scale comes in around the ascending weekly trendline taken from the low 1.0461, while on the daily scale; downside support is not expected until around the 1.0892 mark. In addition to this, with the large psychological 4hr support 1.1000 lurking just below the current 4hr demand zone, there is a high possibility that price will fake lower to connect with bids in and around this region.
Given the points made above, our attention will mostly be driven toward shorts today. ‘Sell the dips’ is a phrase that comes to mind here! And that is exactly what we plan on doing.
Sell zones to keep an eye on are as follows:
- The mid-level hurdle 1.1050.
- 4hr supply at 1.1092-1.1074 – be prepared for a fake higher here to 1.1100 though.
- 4hr supply at 1.1123-1.1107.
We would certainly not advise trading the above areas using pending orders. The safest, and in our opinion, the most logical approach, would be to wait for some sort of lower timeframe selling confirmation before deciding to risk capital. With regards to targets, we intend on playing it speed bump-by speed bump. What we mean by that is, at each supportive structure price hits on the 4hr timeframe following your entry, watch to see how the lower timeframes react. If bullish, consider closing some of your position. In the event that our analysis is correct, one could potentially do this all the way down to the daily Quasimodo support level we highlighted above at 1.0892.
Levels to watch/live orders:
- Buys:Flat (Stop loss: N/A).
- Sells: 1.1050 [Tentative – confirmation required] (Stop loss: dependent on where one confirms this level) 1.1092-1.1074 [Tentative – confirmation required] (Stop loss: dependent on where one confirms this area) 1.1123-1.1107 [Tentative – confirmation required] (Stop loss: dependent on where one confirms this area).
GBP/USD:
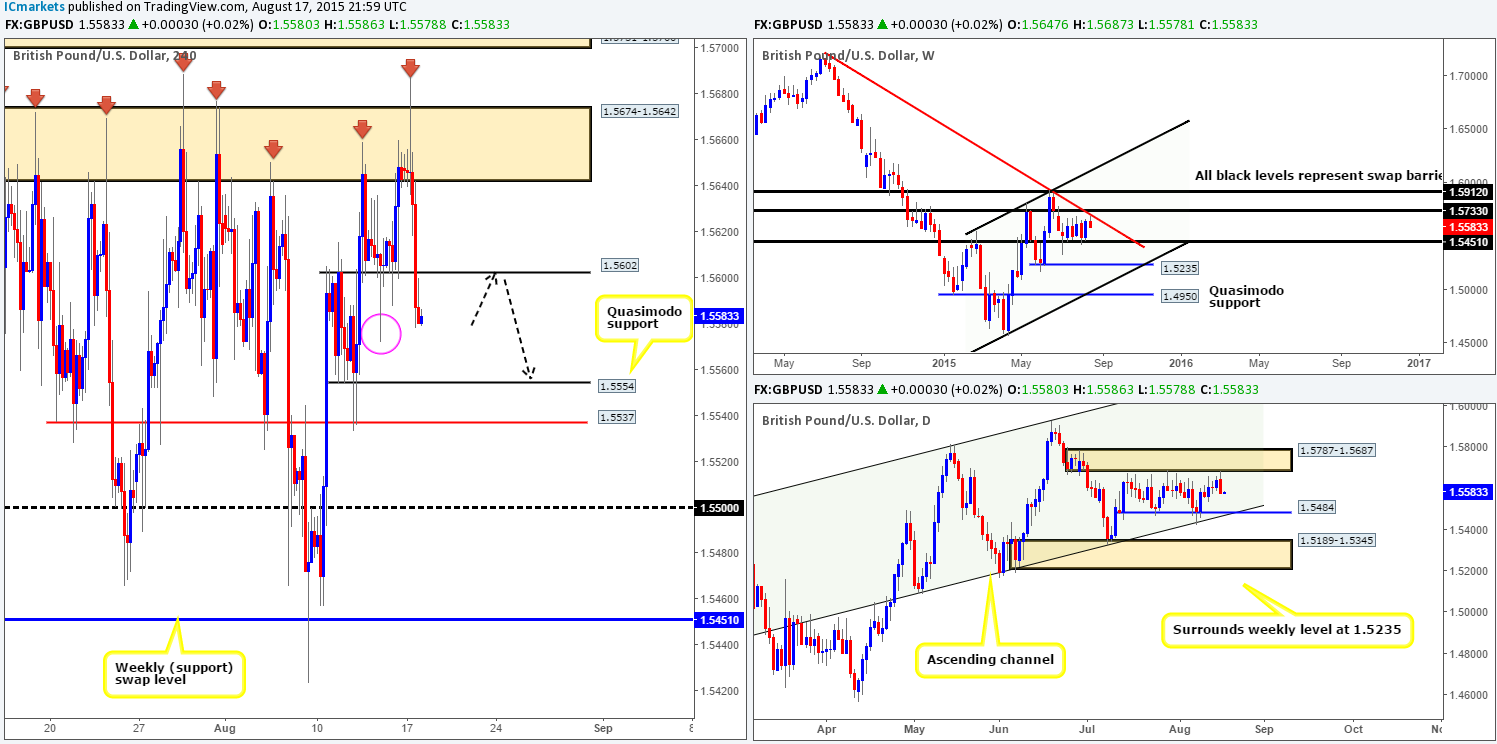
This morning’s analysis will kick-off with a look at the weekly timeframe, which, as you can see, shows price now kissing the underside of the weekly trendline resistance (1.7166). Turning our attention to the daily timeframe, we can see that price is currently respecting a daily resistance area coming in at 1.5787-1.5687.
Slipping down to the 4hr timeframe reveals that once London opened for business yesterday, the GBP exploded north, rallying a very cool 157 pips all in all. Consequent to this move, the 4hr resistance base at 1.5674-1.5642 was engulfed, and price stabbed into offers sitting within 4hr supply at 1.5731-1.5700 sending price lower into the close 1.5654.
With price now loitering within the recently broken4hr resistance base, which could potentially act as a supportive structure now, where do we go from here? Well, considering the location of price on the higher timeframe structures (see above) at present, we have no interest in buying this pair right now. Selling on the other hand could be a possibility today should price drive below and retest 1.5674-1.5642 as per the black arrows. If this does occur and we manage to spot lower timeframe selling confirmation following the retest, we’d short this market, targeting 1.5571 – a 4hr Quasimodo support level.
Levels to watch/ live orders:
- Buys: Flat (Stop loss: N/A).
- Sells: Watch for bids at 1.5674-1.5642 to be consumed and then look to enter on a retest at this area (confirmation required).
AUD/USD:
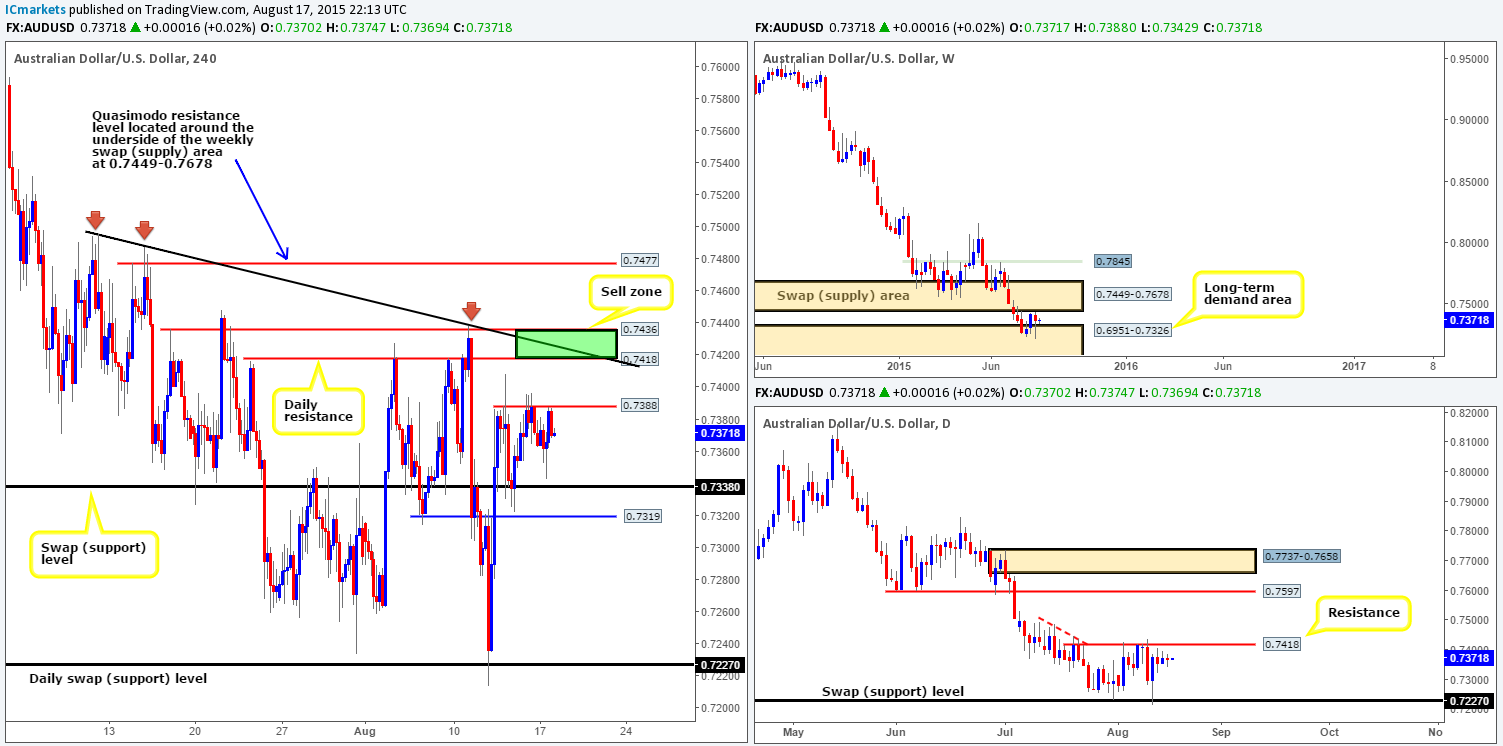
In consequence to yesterday’s decline and rebound from 0.7322 (Thursday’s low), this pair appears to be in the process of chiseling out a consolidation zone between 0.7388 and 0.7322. Looking only at the 4hr timeframe, one could look to trade the limits of this potential 4hr range today. We would not advise simply placing a pending order at the extremes and hoping for the best though, as this could end with your stops being taken out on a fakeout. As such; waiting for the lower timeframes to prove there is some strength residing at your chosen level would likelybe the best path to take.
A breakout either above or below this 4hr range, however, would be very interesting. Above shows room for price to rally towards 0.7418/0.7436 – a sell zone of ours chalked up a few days ago. A break below this range, nonetheless, potentially opens up the path towards the 4hr Quasimodo support level at 0.7282. Since there is more space below this range than above, one could look to trade the retest following a break lower and target 0.7282 as a first take-profit level…
In spite of the above, when we include the higher timeframes into the mix the picture looks a little different. The downtrend on the weekly timeframe is strong to say the least. Furthermore, price is trading relatively near to both a daily resistance level at 0.7418, and a weekly swap (supply) area at 0.7449-0.7678. For this reason, our team is still in favor of shorts.
Levels to keep an eye on are as follows (lower timeframe confirmation required):
- 0.7388 – the top-side of the 4hr range discussed above.
- 0.7418/0.7436 – a daily resistance level which converges nicely with a 4hr downtrend line taken from the high 0.7494.
- And finally, one could watch for a break below the 4hr range low 0.7322, and look to enter on a retest of this number.
Levels to watch/ live orders:
- Buys: Flat (Stop loss: N/A).
- Sells: 0.7388 [Tentative – confirmation required] (Stop loss: dependent on where one confirms this level) 0.7418/0.7436 [Tentative – confirmation required] (Stop loss: dependent on where one finds confirmation within this area) Watch for bids at 0.7322 to be consumed and then look to enter on a retest of this number (confirmation required).
USD/JPY:
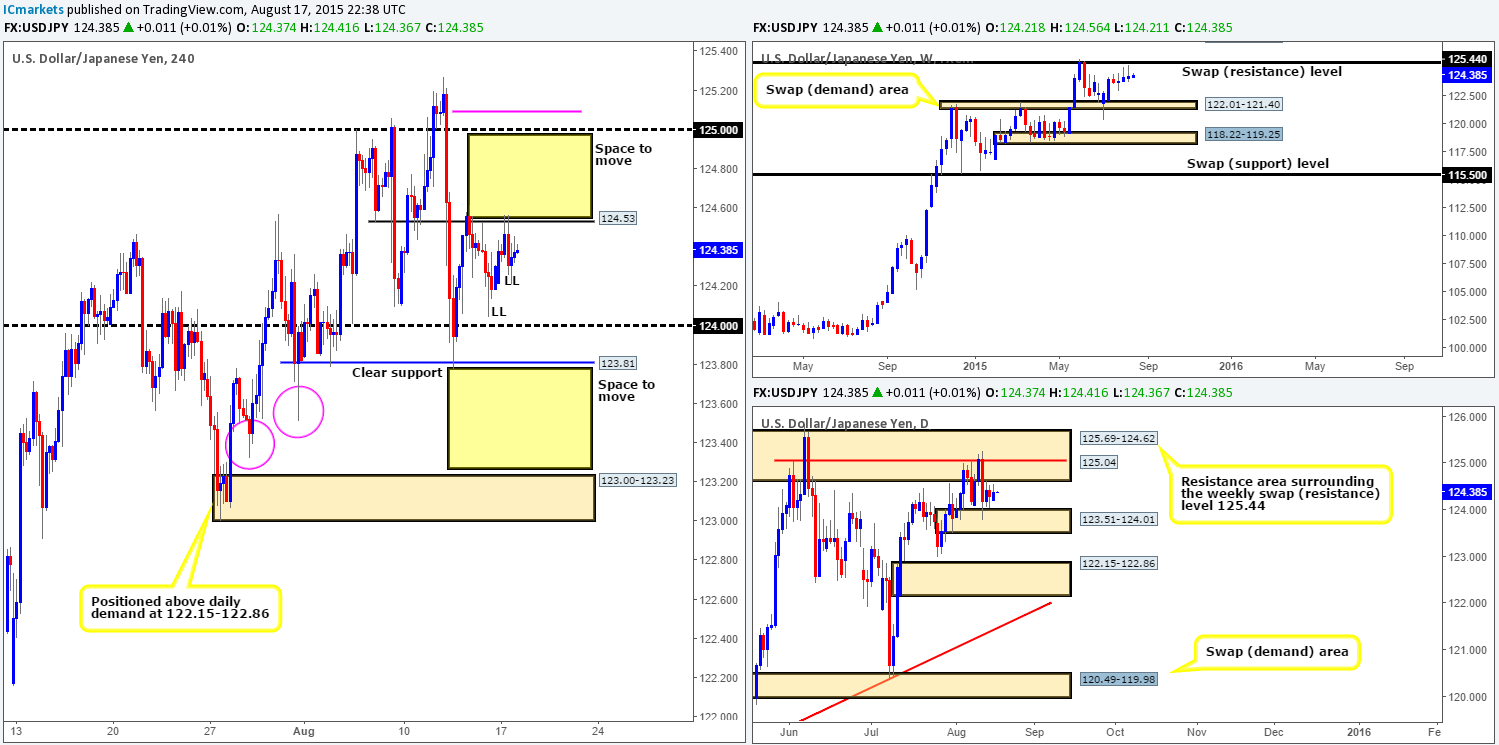
Yesterday’s sessions on the USD/JPY were relatively quiet. Price lightly sold off and attacked Monday’s lows 124.21, which, as you can see, was enough to support a mild counter-attack back up to highs of 124.45 on the day. As a result, it appears that the buyers and sellers are currently sandwiching themselves between two compressing 4hr trendlines (124.04/124.61) at the moment.
With the above in mind, what are we looking at in the bigger picture? Well, we see that another weekly bearish pin-bar candle formed twenty or so pips below the weekly swap (resistance) level at 125.44 last week. Meanwhile, daily action shows price is currently jammed between a daily resistance area at 125.69-124.62, and a daily demand zone at 123.51-124.01.
Therefore,(similar to yesterday’s report)if price cuts through 124.53 today, we should look to buy the retest, right? According to the 4hr timeframe structure, this would be a valid trade since there is space seen for price to move higher between 124.53 and 125.00. However, when taking into account where price is trading on the higher timeframes (see above), we still remain hesitant.
On that note, should price sell off today and connect with 124.00 or the 4hr support below at 123.81, we would not be looking to buy here. The reason for why again stems from where price is positioned higher up. To that end, we’d much prefer to sell the break/retest of these levels. Here’s why…
- Space for price to move lower between 123.81 and the 4hr demand zone at 123.00-123.23.
- As just mentioned, selling tails printed just below the weekly swap (resistance) level at 125.44. In addition to this, there is also space for price to move lower down to the weekly swap (demand) area at 122.01-121.40.
- The 4hr demand consumption tails painted (pink circles) at 123.51/123.32 suggests that below 124.00, the path south is clear of major bids until the aforementioned 4hr demand area.
Levels to watch/ live orders:
- Buys: Flat (Stop loss: N/A).
- Sells: Watch for 124.00/123.81 to be consumed and then look to enter on a retest at this area (confirmation required).
USD/CAD:
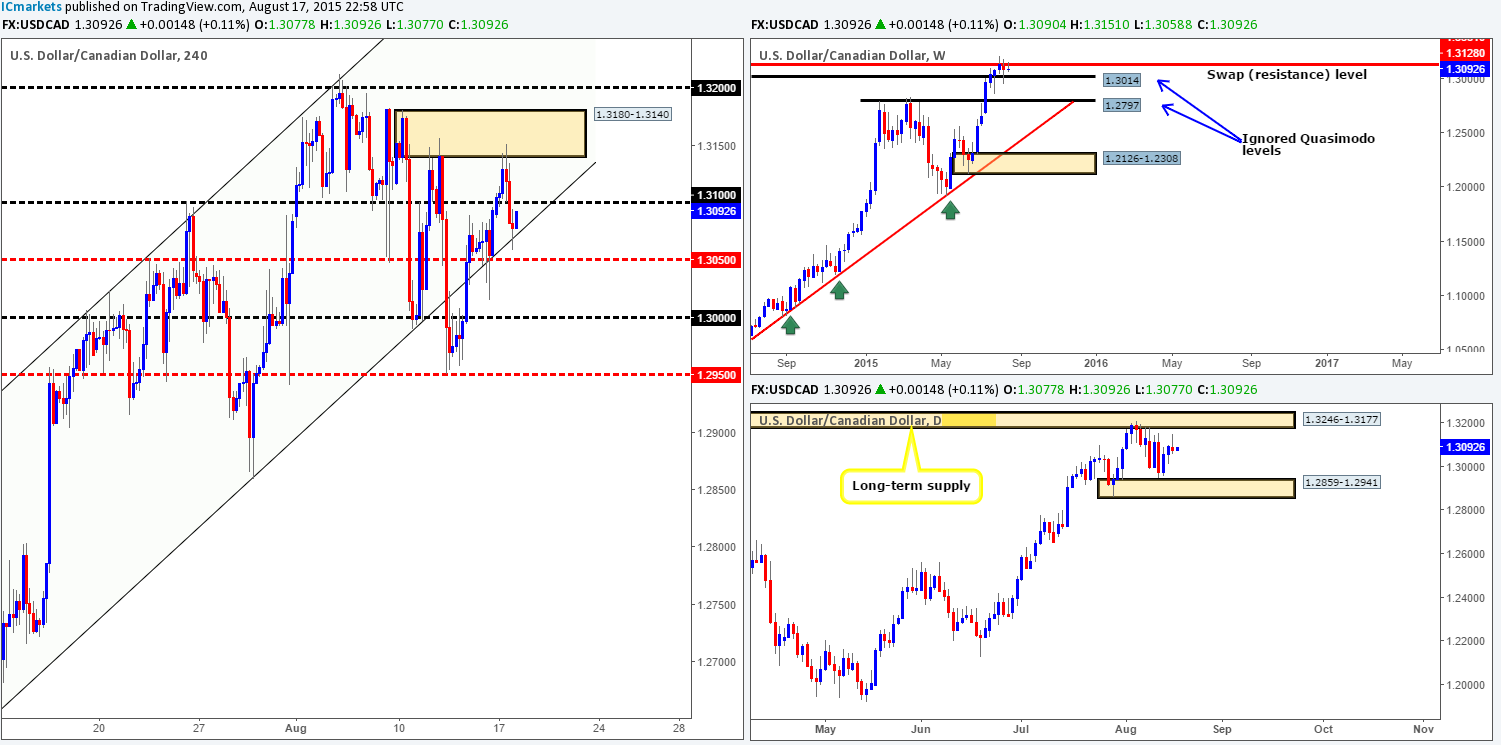
Using a top-down approach this morning, we can see that the weekly swap (resistance) level at 1.3128 continues to hold firm. The selling pressure from this hurdle appears to be pushing price down in the direction of the ignored weekly Quasimodo support level at 1.3014. Lower down, yet another selling tail was printed during yesterday’s trade on the daily timeframe, which may encourage new sellers into the market today.
On the 4hr timeframe, however, it is clear that bids dried up relatively quickly going into yesterday’s sessions. Price sold off, taking out 1.3100 and connecting up with the mid-level number 1.3050. Additionally, this recent sell-off nearly completed the D-leg required for a 4hr Harmonic bullish AB=CD pattern, which completes between 1.3032/1.3035.Given all of the above, here is our two cents’ worth on where price will likely head today…
Early on in the session, we could see the market drop a little lower to fill bids sitting around the 4hr AB=CD base, and this will likely send the market higher. The next upside target from here is around the 1.3100, thus if price is seen holding at our AB=CD area, a long trade will most certainly be considered. If a bounce higher takes placeprice will likely head down towards the large psychological support 1.3000. This is a particularly important number not only because of its psychological importance, but also because it merges nicely with the aforementioned ignored weekly Quasimodo support level. Therefore, buy trades could be possible from this barrier if price does indeed reach this low.
Levels to watch/ live orders:
- Buys: 1.3032/1.3035 [Tentative – confirmation required] (Stop loss: dependent on where one confirms this area).
- Sells:Flat (Stop loss: N/A).
USD/CHF:
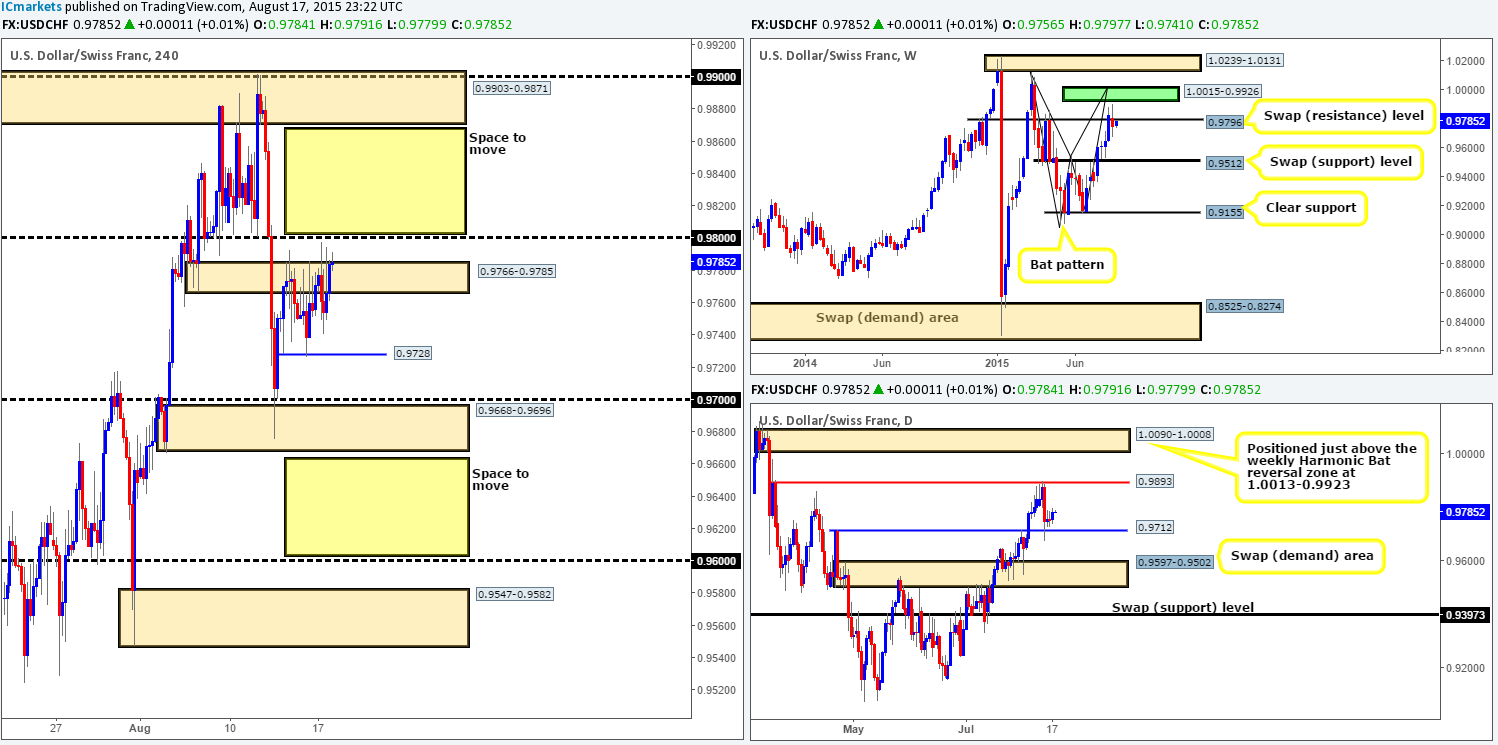
When we opened up the USD/CHF 4hr chart this morning, three words sprung to mind – ‘what a mess!’ Following the aggressive sell off from the 0.9900 level on the 11/08/15, price has been in a somewhat corrective phase (a bearish wedge pattern – 0.9675/0.9773) ever since, and it is not pretty!
Consequent to yesterday’s lackluster performance, much of the following analysis will remain similar to the previous. Given that price continues to hold below 0.9800 suggests to us that there is strong supply within this region. This – coupled with the fact that price is lurking just beneath a weekly swap (resistance) level at 0.9796 at the moment makes this an attractive price level to look for confirmed shorts. However, please do remain conscious to the fact that price has just bounced off of a daily swap (support) level at 0.9712, hence the need for confirmation here.
Supposing that the buyers decide to put up a fight from this daily swap (support) level and go up against potential weekly sellers, 0.9800 could very well be taken out today. This may open the gates for prices to challenge 4hr supply at 0.9903-0.9871. To trade this potential 70-100 pip move, we’d require a retest of 0.9800 as support along with corresponding lower timeframe confirmation. This in turn would also push prices back up to just below the weekly Harmonic Bat completion zone at 1.0015-0.9926, which if hit, would in itself be a superb location to short from.
Levels to watch/ live orders:
- Buys: Watch for offers at 0.9800 to be consumed and then look to enter on a retest of this number (confirmation required).
- Sells: 0.9800 [Tentative – confirmation required] (Stop loss: dependent on where one confirms this level).
DOW 30:
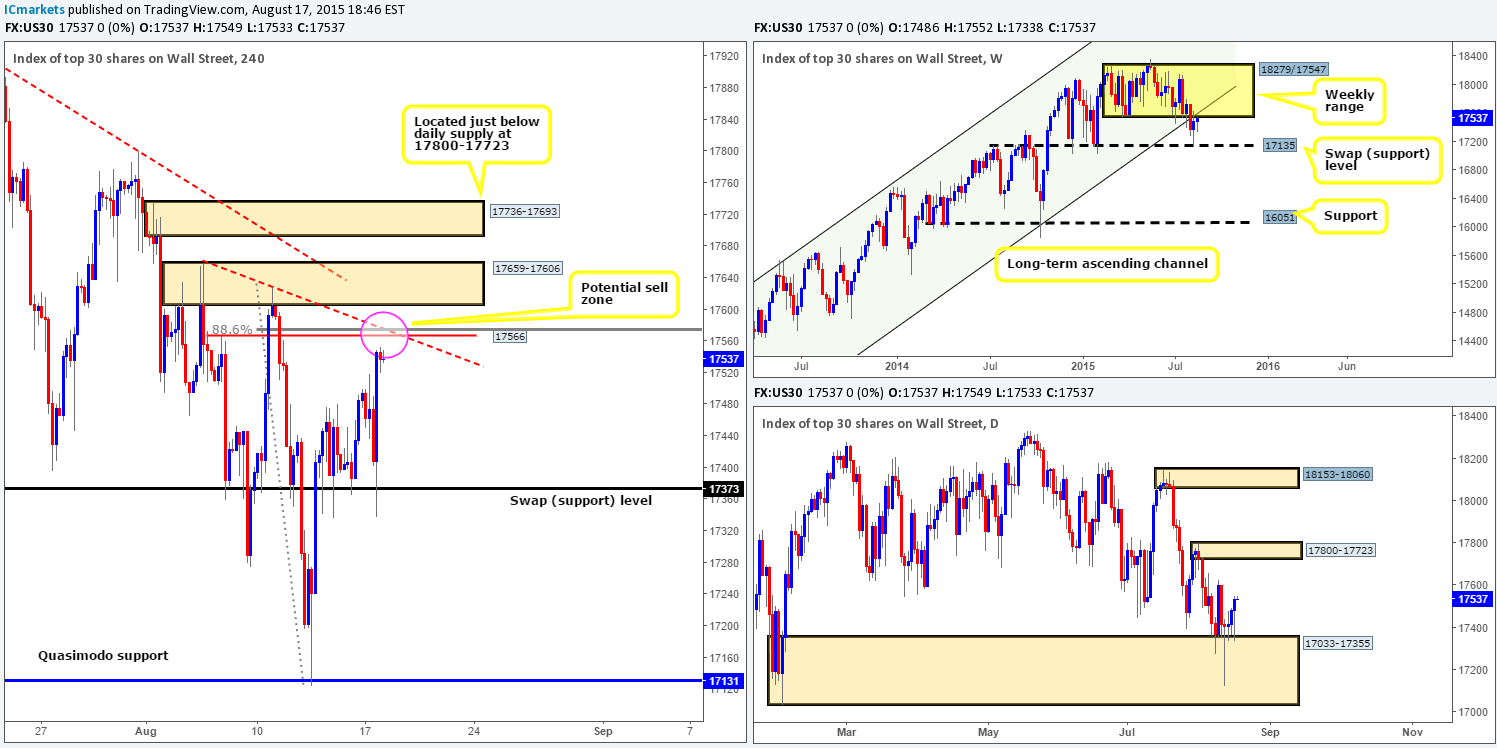
For those who read our previous report on the DOW 30 http://www.icmarkets.com/blog/tuesday-18th-august-daily-technical-outlook-and-review/ you may recall us mentioning to keep an eye on the 4hr Quasimodo resistance level at 17566 for shorting opportunities. As you can see, price rebounded from this level practically to-the-pip, and is now testing a minor 4hr swap (support) barrier at 17495. Well done to any of our readers who managed to get in on this move!If we managed to find lower timeframe confirmation at 17566 yesterday, we would have likely taken 50% of our position out of the market now and moved our stop to breakeven.
Since weekly action shows price is trading at the underside of the weekly range low 17547 and its converging weekly ascending channel (resistance –10402), we feel this market has further to fall yet. Therefore, our objective for today’s upcoming sessions is simple. Wait for price to push below 17495, and look to trade the retest (preferably with confirmation) at this number down to the 4hr swap (support) level at 17373 as per the black arrows.
Levels to watch/ live orders:
- Buys: Flat (Stop loss: N/A).
- Sells:Watch for bids at 17495 to be consumed and then look to enter on a retest of this number (confirmation required).
XAU/USD: (Gold)
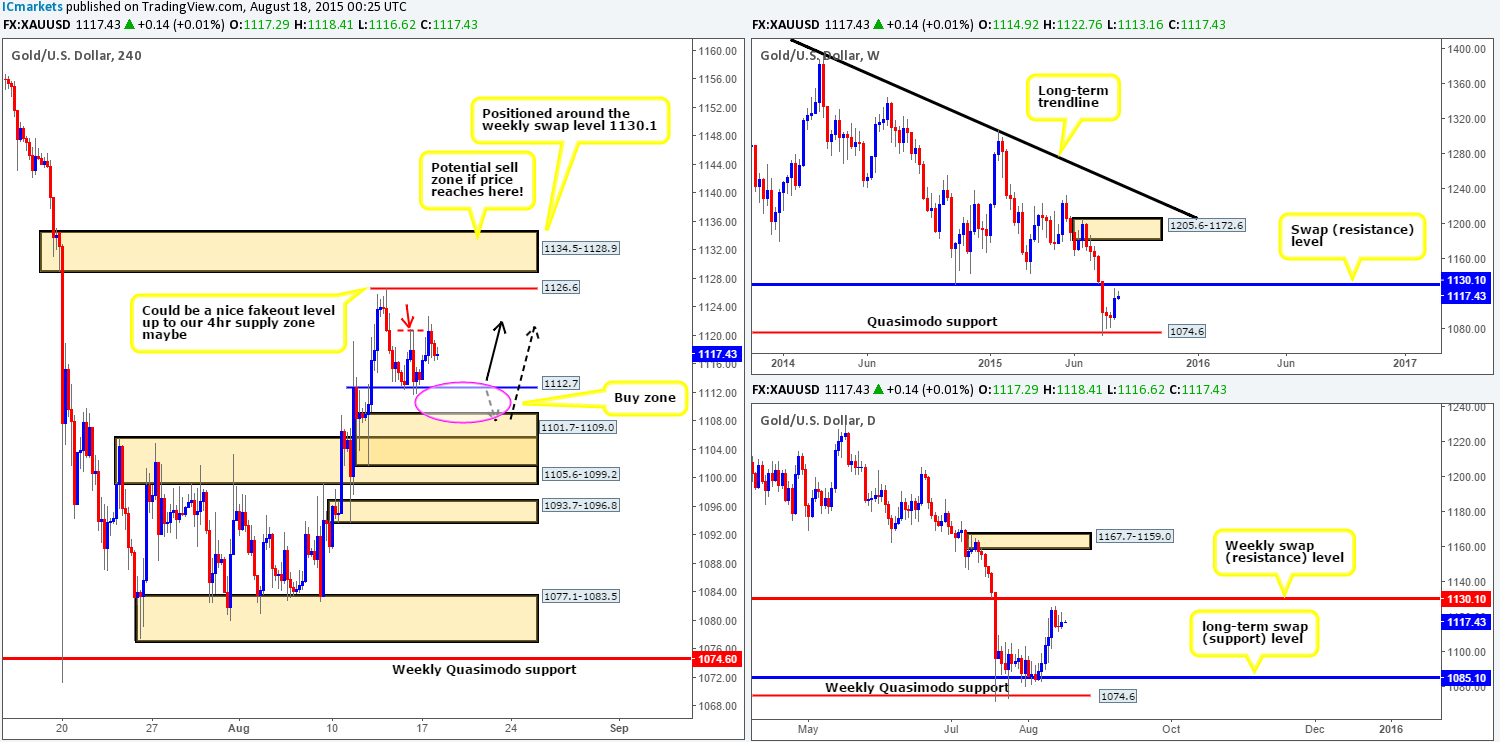
For those who read our previous report on our favorite yellow metal http://www.icmarkets.com/blog/tuesday-18th-august-daily-technical-outlook-and-review/ you may recall that we mentioned to watch either 1112.7, or the 4hr demand at 1101.7-1109.0 for buys yesterday. As you can see, price beautifully spiked between the above said 4hr barriers and rallied higher. This push lower happened relatively fast and gave very little tradable price action, so unfortunately we’re not in on this move! Well done to any of our readers who did manage to lock in a position here.
With there being little overhead supply left on the 4hr timeframe, we feel price will likely continue to appreciate in value today up to at least 1126.6. For those who entered long at the 1112.7 region could look to take profits here, as the most we see Gold climbing to is the 4hr supply zone just above at 1134.5-1128.9. The reason for why comes from this 4hr supply zone surrounding a distinct weekly swap (resistance) barrier at 1113.10, thus also making it an awesome place to look for confirmed shorts into this market .
Levels to watch/ live orders:
- Buys: Flat (Stop loss: N/A).
- Sells: 1134.5-1128.9 [Tentative – confirmation required] (Stop loss: dependent on where one finds confirmation in this area).


