
A note on lower timeframe confirming price action…
Waiting for lower timeframe confirmation is our main tool to confirm strength within higher timeframe zones, and has really been the key to our trading success. It takes a little time to understand the subtle nuances, however, as each trade is never the same, but once you master the rhythm so to speak, you will be saved from countless unnecessary losing trades. The following is a list of what we look for:
- A break/retest of supply or demand dependent on which way you’re trading.
- A trendline break/retest.
- Buying/selling tails – essentially we look for a cluster of very obvious spikes off of lower timeframe support and resistance levels within the higher timeframe zone.
- Candlestick patterns. We tend to only stick with pin bars and engulfing bars as these have proven to be the most effective.
EUR/USD:
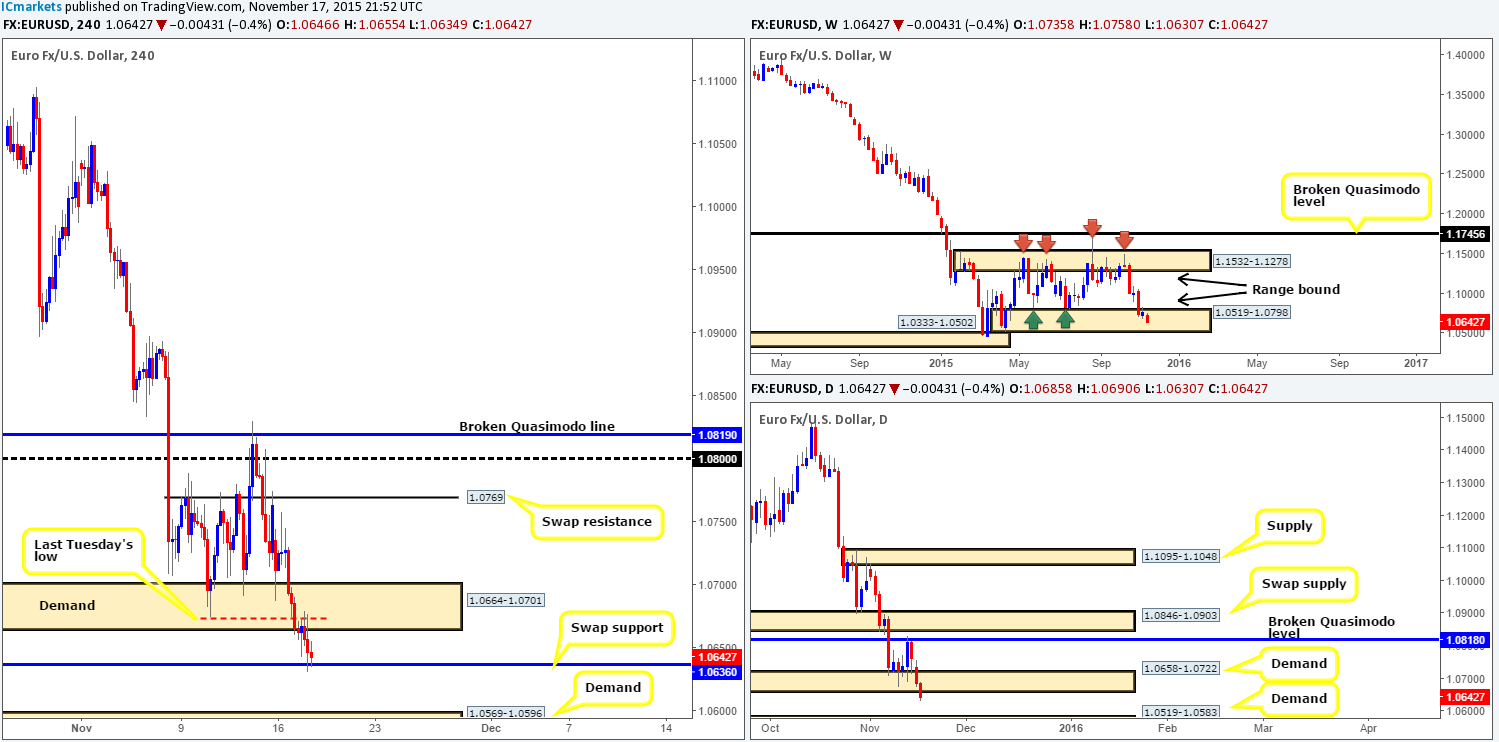
Kicking off this morning’s analysis with a look at the weekly chart shows price is now trading relatively deep within a weekly (range) demand at 1.0519-1.0798. Meanwhile, down on the daily chart, recent trade has closed below demand fixed between 1.0658-1.0722, thus potentially clearing the runway south down towards demand coming in at 1.0519-1.0583 (located within the extreme of the above said weekly [range] demand).
Turning our attention to the H4 chart, we can see that yesterday’s market action closed below last Tuesday’s low 1.0673 and retested it as resistance mid-way through London trading. This, as seen on the chart, brought about a further decline in value, consequently placing the single currency in the hands of a swap support drawn from 1.0636, which is currently holding firm.
The most we see price bouncing from this current level, however, is back up to the underside of Tuesday’s low, due to weakness being seen on the daily chart (break of demand – see above). Therefore, what we now have our beady little eye on for a possible trade is the demand lurking just below at 1.0569-1.0596. Not only is this beast supported by both weekly and daily demand (1.0519-1.0798/1.0519-1.0583), it also boasts psychological support from 1.0600. Considering this area’s higher timeframe confluence, we would, dependent on what news was being released at the time, look to enter long here at market.
Levels to watch/live orders:
- Buys: 1.0569-1.0596 (Stop loss: 1.0566).
- Sells: Flat (Stop loss: N/A).
GBP/USD:
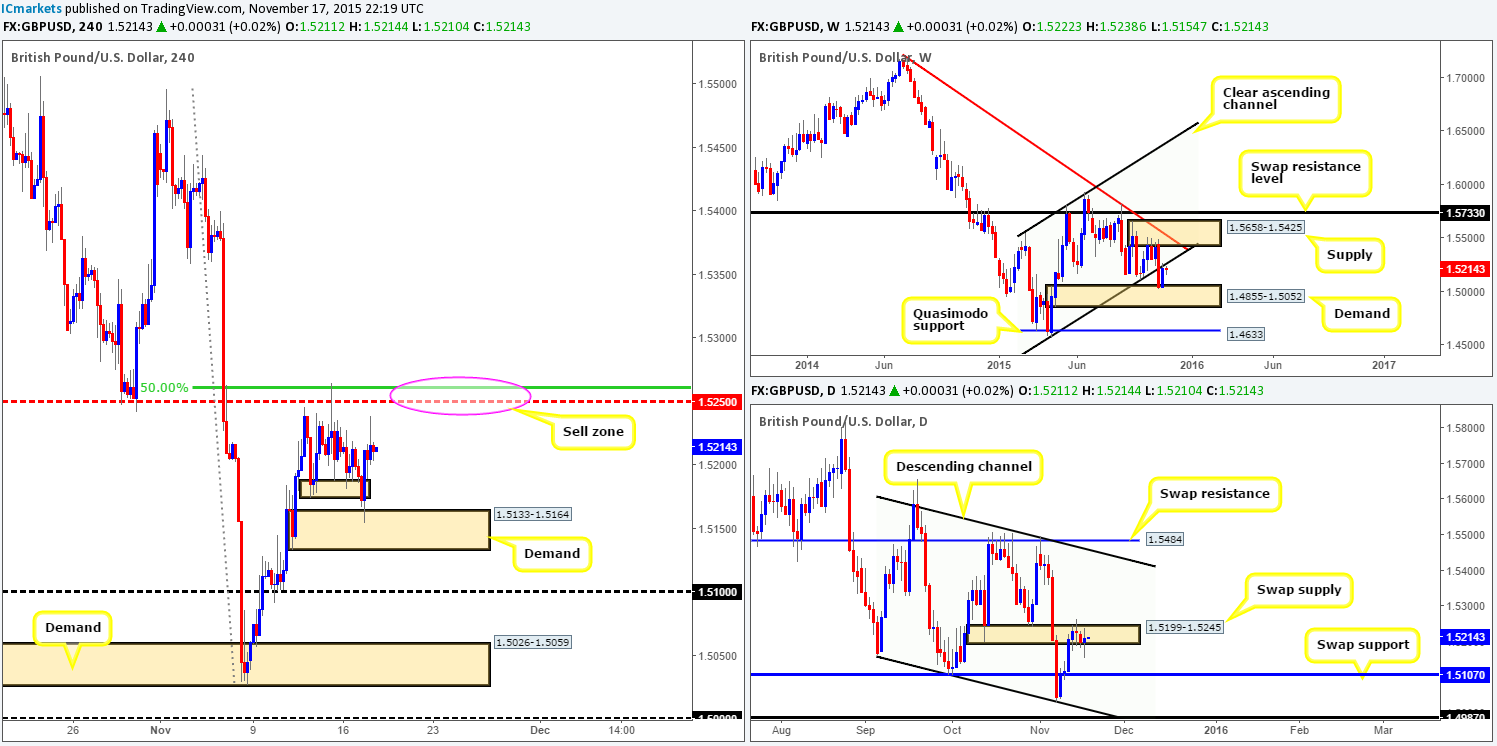
At this point in time, not much change has been seen on the higher timeframe charts. Weekly action remains chewing on the underside of the recently broken weekly channel support-turned resistance line (1.4564), whilst on the daily chart, the buyers and sellers are still battling for position within a swap supply zone drawn from 1.5199-1.5245.
Down on the H4 chart, nevertheless, early on in London trade we saw candle action fake below demand at 1.5174-1.5188 into another demand coming in at 1.5133-1.5164, and reach highs of 1.5238. As price is now back trading around yesterday’s prices, we still have our eye on the mid-level barrier 1.5250 for a confirmed short today. This level not only boasts additional resistance from the higher timeframes (weekly channel support-turned resistance line/daily swap supply – see above), but also has a 50.0% Fibonacci resistance line just above it at 1.5260. The reason for requiring confirmation here is simply because fixed levels such as 1.5250 are prone to fakeouts.
Although price recently responded well to demand at 1.5133-1.5164, this is not an area we feel is worthy of a second bounce. In fact, we were surprised by the recent one! This comes from having absolutely no connection with the higher timeframes, thus making it low probability in our opinion. It would only be around the around the psychological support level 1.5100 that our team would begin looking to buy this market again, owing to it converging nicely with a daily swap (support) barrier at 1.5107 (the next downside target from the aforementioned daily swap [supply] area).
Levels to watch/ live orders:
- Buys: 1.5100 [Tentative – confirmation required] (Stop loss: dependent on where one confirms this level).
- Sells: 1.5250 [Tentative – confirmation required] (Stop loss: dependent on where one confirms this level).
AUD/USD:
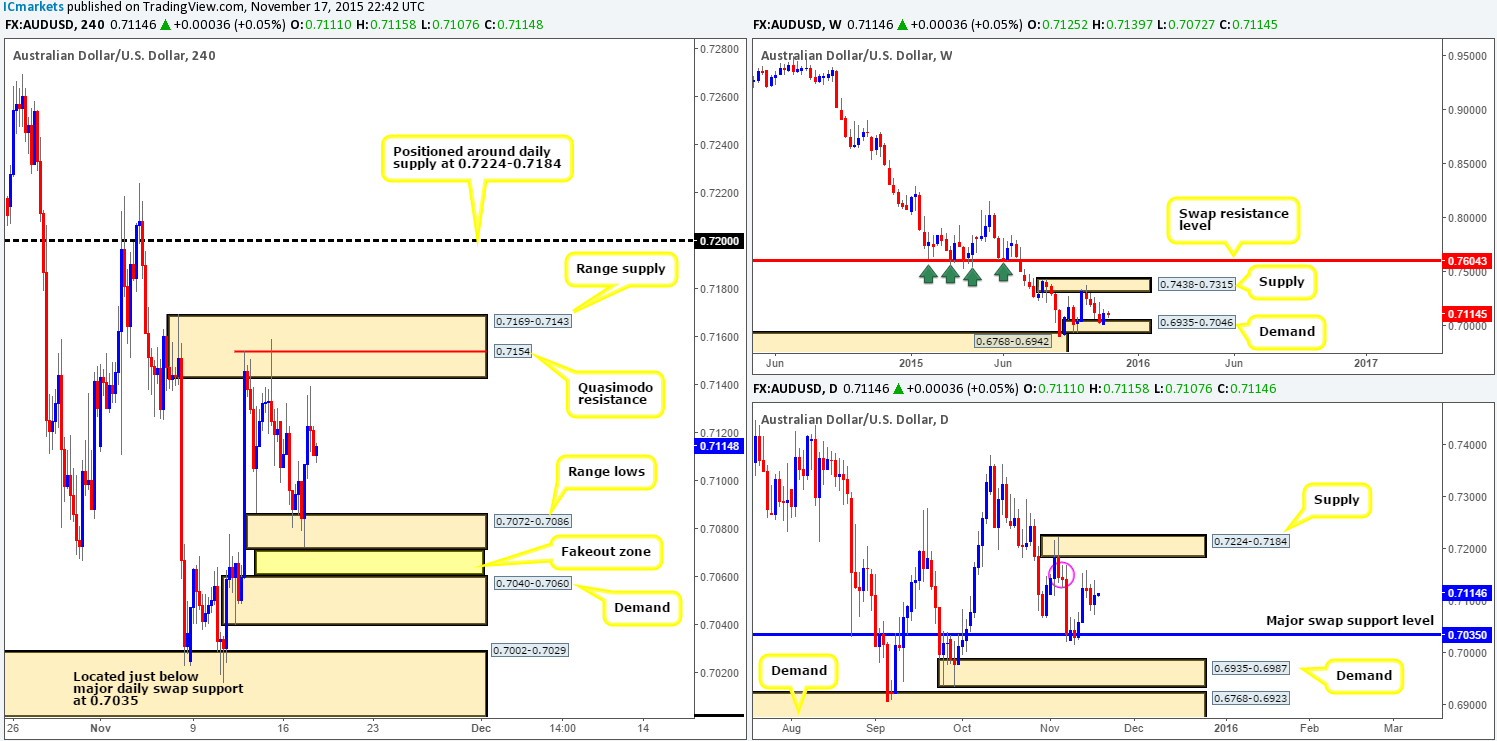
Recent events saw the commodity currency correct sharply from around the 0.7072 mark going into the early hours of the London session, consequently pushing this pair up to session highs of 0.7139, and enclosing the Aussie into a phase of consolidation (range supply: 0.7169-0.7143 – range lows: 0.7072-0.7086).
Now, given that price is currently being held lower from a minor daily supply area circled in pink at 0.7168-0.7141, and weekly trade appears to be bid from demand at 0.6935-0.7046, where do we go from here? Well, considering the situation on the daily chart, we would, given the right lower timeframe setup, take a short from the Quasimodo resistance level seen within the current range supply at 0.7154.
Buying from the current range lows, however, is not something we’d label high probability. Reason being is simply because there is a clean demand lurking just below it at 0.7040-0.7060, that sits five pips above a major daily swap (support) level at 0.7035. With this, we believe the range lows will eventually be faked, so do make a note of the demand below in your watch lists as a potential reversal zone.
Levels to watch/ live orders:
- Buys: Keep an eye for a fake below range lows 0.7072-0.7086 into demand at 0.7040-0.7060.
- Sells: 0.7154 region [Tentative – confirmation required] (Stop loss: dependent on where one confirms this level).
USD/JPY:
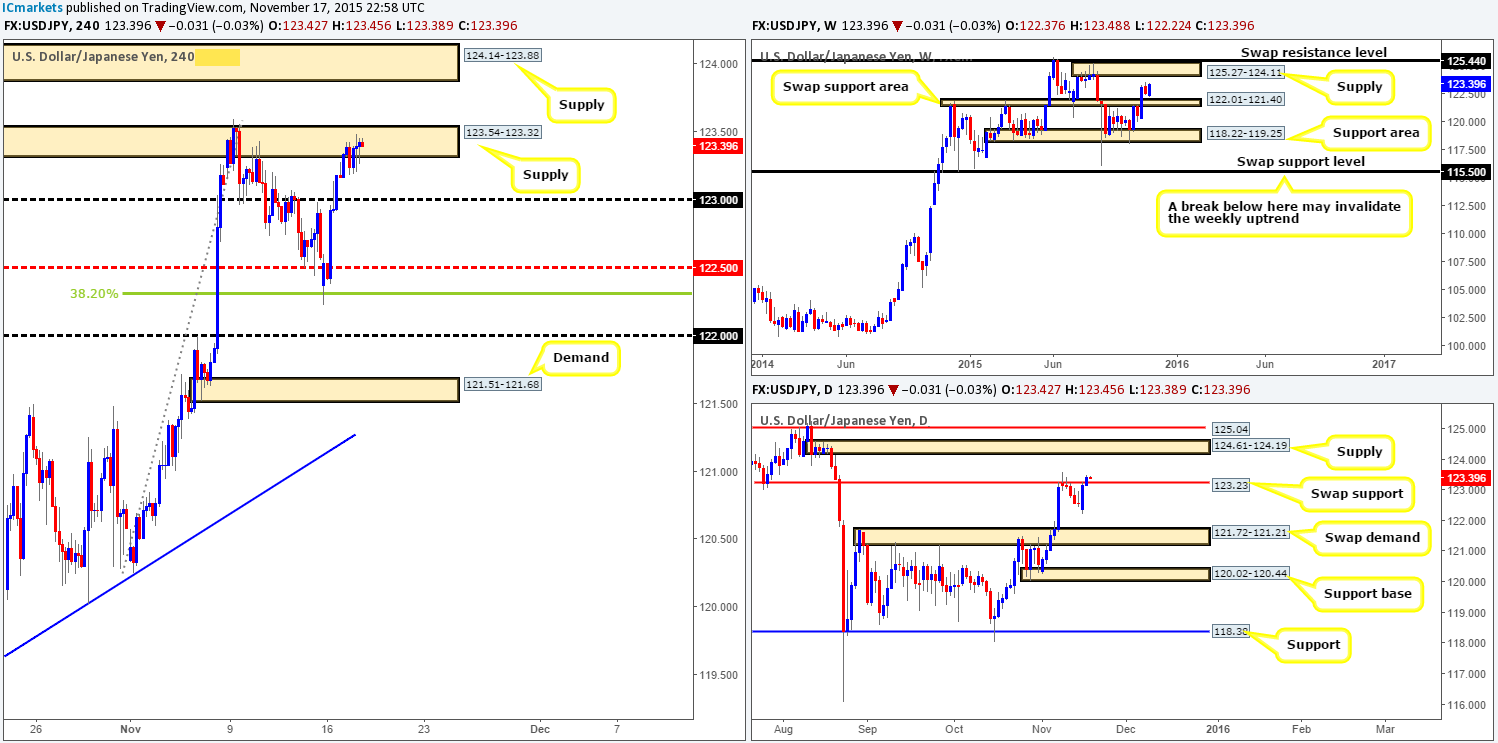
Beginning with the weekly timeframe this morning, the USD/JPY shows price continues to loiter between supply at 125.27-124.11 and a swap support area coming in at 122.01-121.40. On the other side of the field, daily action closed above the swap resistance (now support) level given at 123.23. In the event that the buyers remain steady above this barrier, this could suggest a further advance north is in order up to supply drawn from 124.61-124.19.
Moving down into the pits of the H4 timeframe, however, it is clear to see that prices stagnated somewhat yesterday after entering into the jaws of supply at 123.54-123.32. Given the recent close above the aforementioned daily swap level, we no longer have interest in shorting this H4 supply zone. Instead, we’re now watching the supply area above it at 124.14-123.88. Depending on what news is due to be released at that time, this area could provide us with a very stable zone to sell at market from. The reason for why is that not only is it located nicely below the daily supply mentioned above at 124.61-124.19, but is also glued to the underside of the above said weekly supply at 125.27-124.11 as well. Therefore, do keep this noted in your watch lists traders!
Levels to watch/ live orders:
- Buys: Flat (Stop loss: N/A).
- Sells: 124.14-123.88 (this area looks to be good enough for a market short – no confirmation required).
USD/CAD:
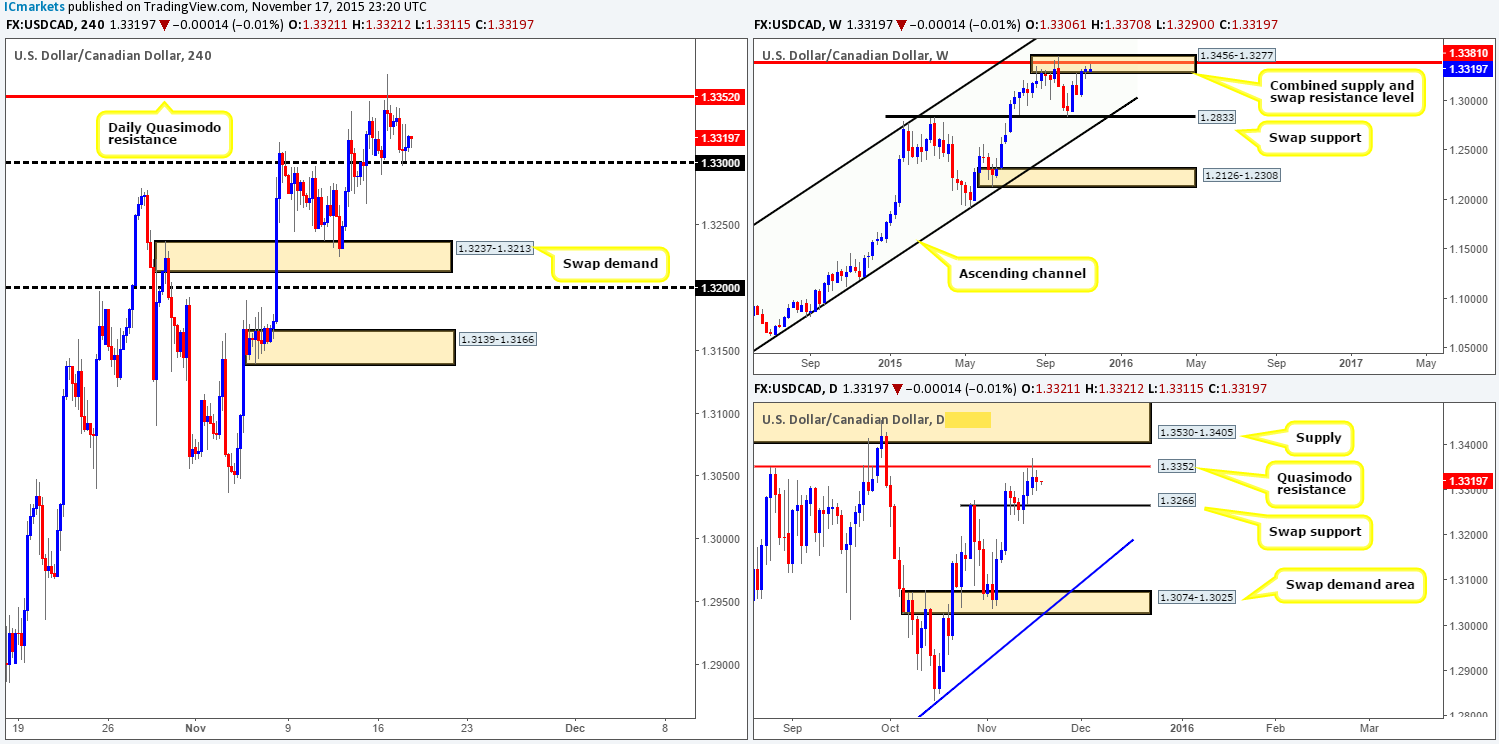
As can be seen from the H4 chart, it appears the Loonie has entered into a phase of consolidation between the daily Quasimodo resistance level at 1.3352 and psychological support 1.3300. Looming over this range like a big rain cloud, however, is a weekly combined supply/ swap resistance area seen at 1.3456-1.3277/1.3381, and directly beneath it sits is a daily swap (support) barrier at 1.3266.
Given the above, looking for trades around the daily Quasimodo resistance level seems to be the way to go due to it being positioned within the above said weekly supply/swap resistance area. Entering long at 1.3300 would just not be a confortable trade for us considering all of this higher timeframe resistance currently in play!
Although the daily Quasimodo does indeed boast additional resistance from the weekly timeframe, we would still recommended waiting for the lower timeframes (preferably the 30/60 minute) to confirm this level, since fixed barriers such as these are prone to some nasty fakeouts
Levels to watch/ live orders:
- Buys: Flat (stop loss: N/A).
- Sells: 1.3352 [Tentative – confirmation required] (Stop loss: dependent on where one confirms this level).
USD/CHF:
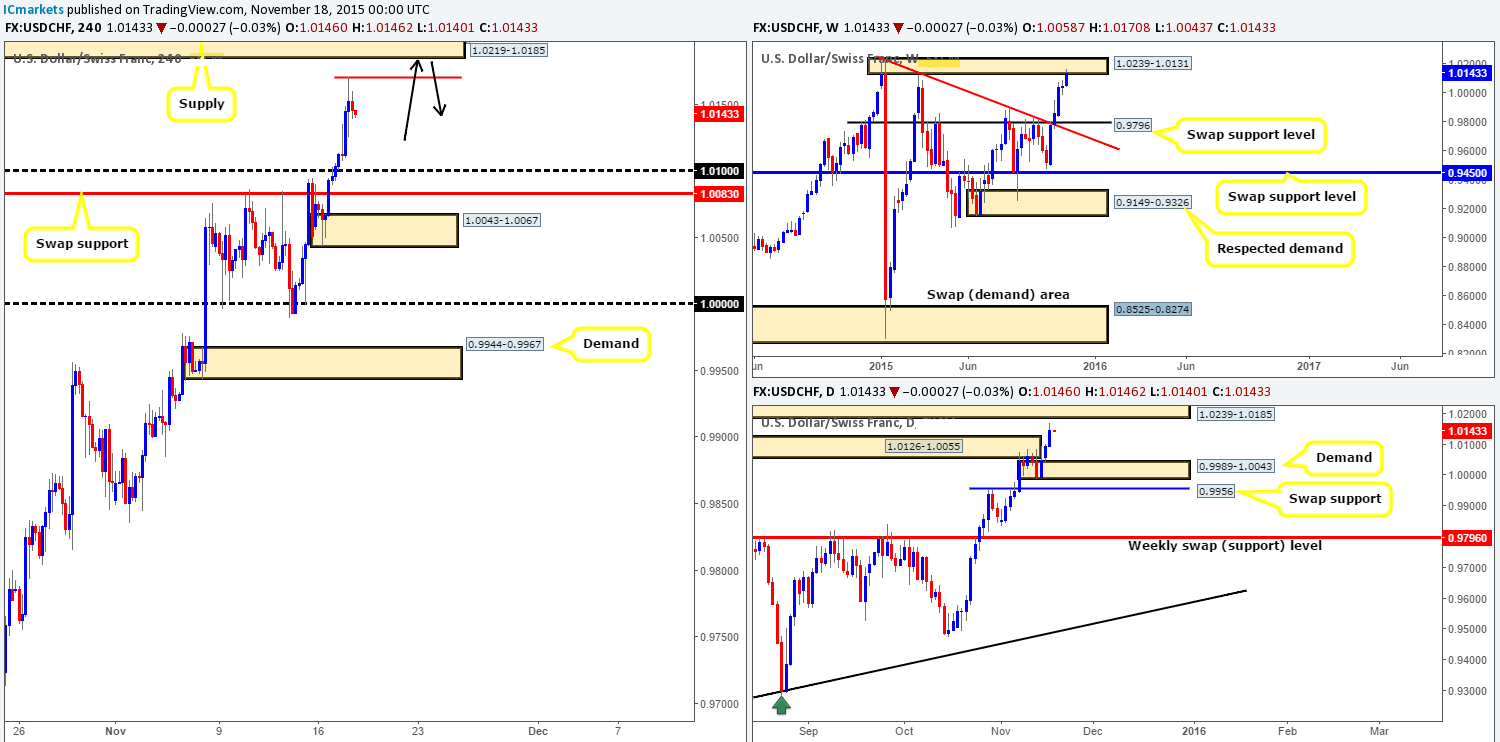
Using a top-down approach this morning reveals that weekly action continues to march north, and as a result has now connected with supply drawn from 1.0239-1.0131. Moving down into the pits of the daily timeframe, we can see that price recently took out offers sitting around supply at 1.0126-1.0055, thus likely clearing the path above up to supply taken from 1.0239-1.0185.
Turning our attention to the H4 timeframe, its clear to see that yesterday’s rally took out psychological resistance 1.0100 and retested it beautifully as support, managing to reach highs of 1.0170 on the day. Given this, where do we go from here? Well, ultimately, our team is focused on shorting the supply area seen above at 1.0219-1.0185 (located within both weekly and daily supply – see above in bold). However, before this happens, we’d ideally like to see prices sell-off a little lower, thus making yesterday’s high more prominent. Why more prominent? The reason is simply this… a LARGE amount of traders look to fade prior highs and lows, and place their stops just beyond these barriers. We know this, and pro money knows this. Therefore, when we have a clear supply lurking just above a prior high as we do now, it would make sense for pro money to take the stops from above this high (buy stops), and SELL INTO THEM from the supply (as per the black arrows). Depending on if price reaches this supply today and what news is being released at the time, we may consider shorting here at market around the 1.0182 mark.
Levels to watch/ live orders:
- Buys: Flat (Stop loss: N/A).
- Sells: 1.0182 (Stop loss: 1.0222).
DOW 30:
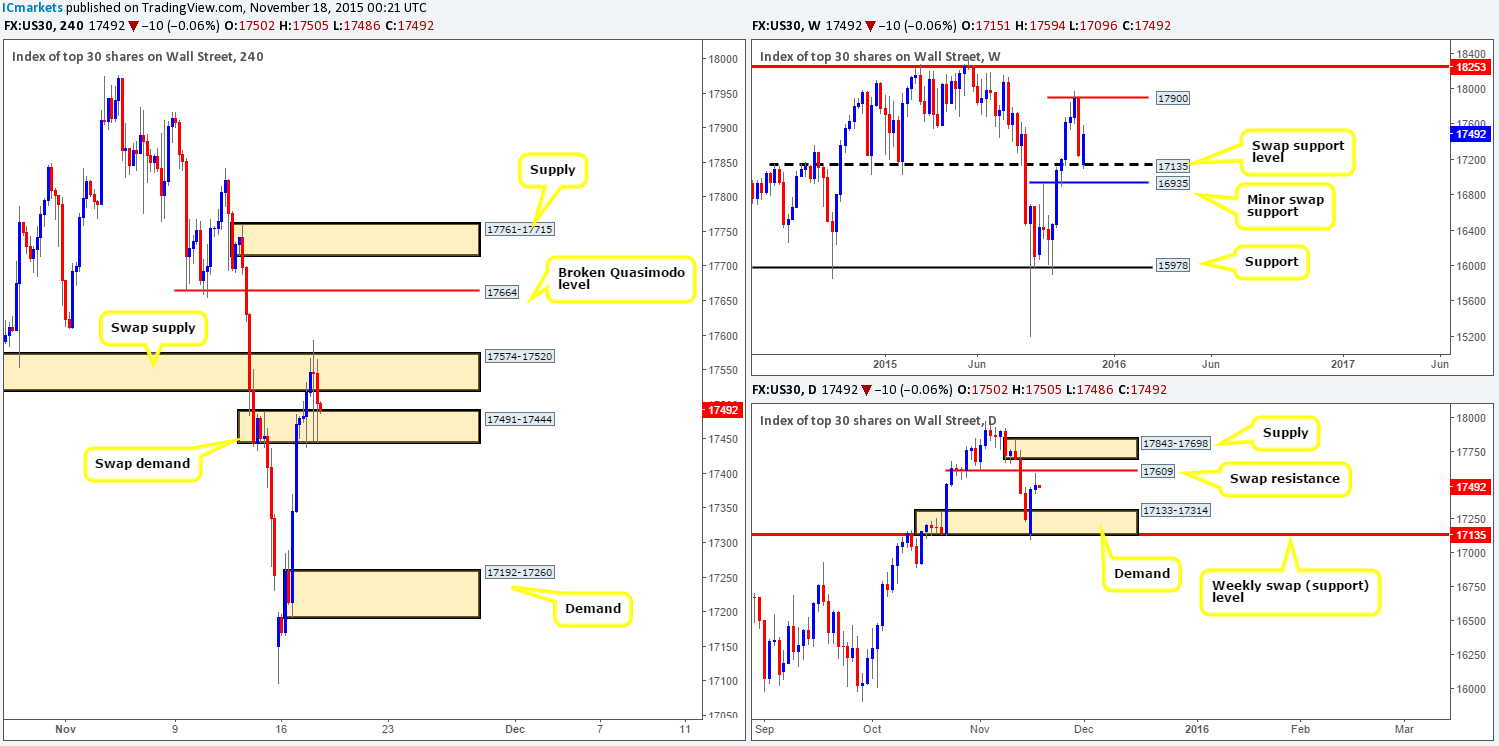
This is certainly beginning to be a tricky market to read at the moment. Up on the weekly chart, price has responded beautifully to the swap support barrier coming in at 17135, with room to move higher. Recent daily action on the other hand printed a bearish selling wick a few pips from below the jaws of a swap resistance level drawn from 17609. Should the market sell-off from here, this could force price back down into demand at 17133-17314. A break above the swap resistance, nonetheless, has immediate supply to contend with given at 17843-17698.
Down on the H4 chart price is currently capped by a swap supply zone at 17574-17520, and a swap demand taken from 17491-17444. A break above could force price to connect with the broken Quasimodo level at 17664, which is located just below the daily supply mentioned above at 17843-17698. Now, trading short at this level, or even the supply seen above it at 17761-17715 (located within the daily supply zone) is certainly an option. However, in doing so, you would potentially be going up against weekly flow (see above), so waiting for lower timeframe confirmation at both areas is recommended.
A break to the downside, nevertheless, shows very little stopping price from tanking all the way down to demand at 17192-17260. Therefore, a short on the break/retest of the current swap demand could also be a viable trade to look out for today. Once again though, waiting for lower timeframe confirmation here is highly recommended before selling, since you’d be potentially shorting into weekly flow.
Levels to watch/ live orders:
- Buys: Flat (Stop loss: N/A).
- Sells: 17664 [Tentative – confirmation required] (Stop loss: dependent on where one confirms this level) 17761-17715 [Tentative – confirmation required] (Stop loss: dependent on where one confirms this area) Watch for bids to be consumed around 17491-17444 and then look to trade any retest seen at this area (confirmation required).
XAU/USD: (Gold)
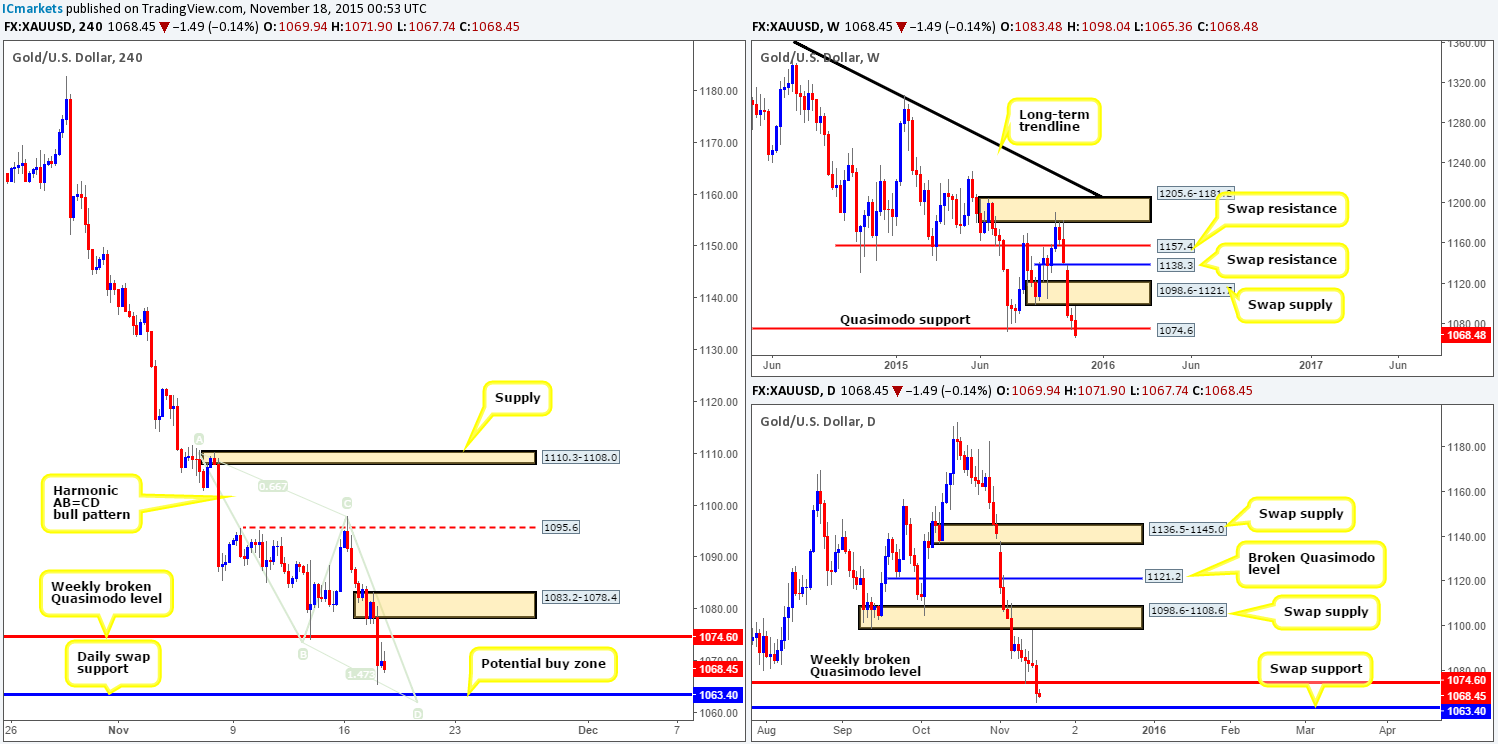
Following Gold’s reaction to the H4 resistance level at 1095.6 on Monday, price has been bearish ever since. At this point in time, however, the buyers and sellers are seen battling for position between a broken weekly Quasimodo level at 1074.6 and a daily swap (support) level at 1063.4.
Should the current weekly candle close beyond the this weekly Quasimodo level, then we see very little on the weekly timeframe stopping prices from depreciating further down to the swap support level at 1027.6. However, right now, there looks to be a nice opportunity to buy Gold at the above said daily swap support, since it merges nicely with a Harmonic AB=CD bull pattern that completes just below it at 1061.7.
Nevertheless, given how strong the recent selling has been over the past month and the clear dollar strength right now, we would only be looking for a small bounce off of this daily level back up to the underside of 1074.6 – the weekly broken Quasimodo level. In addition to this, we would also require lower timeframe confirming price action (preferably on the 30/60 minute) to present itself before risking capital on this idea.
Levels to watch/live orders:
- Buys: 1063.4 [Tentative – confirmation required] (Stop loss: dependent on where one confirms this level).
- Sells: Flat (Stop loss: N/A).


