
A note on lower timeframe confirming price action…
Waiting for lower timeframe confirmation is our main tool to confirm strength within higher timeframe zones, and has really been the key to our trading success. It takes a little time to understand the subtle nuances, however, as each trade is never the same, but once you master the rhythm so to speak, you will be saved from countless unnecessary losing trades. The following is a list of what we look for:
- A break/retest of supply or demand dependent on which way you’re trading.
- A trendline break/retest.
- Buying/selling tails/wicks – essentially we look for a cluster of very obvious spikes off of lower timeframe support and resistance levels within the higher timeframe zone.
- Candlestick patterns. We tend to only stick with pin bars and engulfing bars as these have proven to be the most effective.
We search for lower timeframe confirmation between the M15 the H1 timeframes, since most of our higher-timeframe areas begin with the H4. Stops are usually placed 5-10 pips beyond confirming structures.
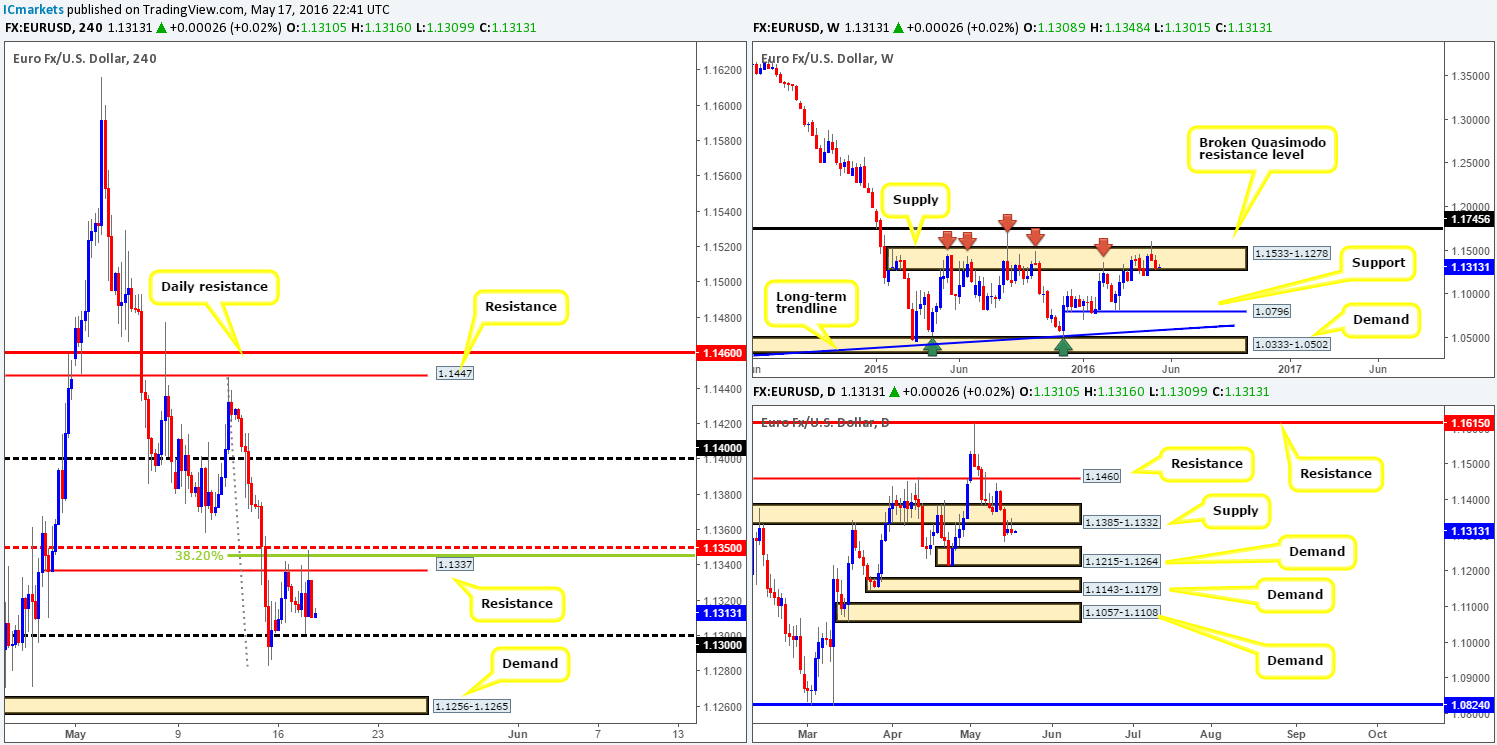
EUR/USD:
Throughout the course of yesterday’s sessions, the single currency kept itself to between H4 resistance at 1.1337 (reinforced by the 38.2% H4 Fibonacci resistance at 1.1345/H4 mid-way resistance at 1.1350) and the 1.13 handle support. Any sustained move above the H4 mid-way resistance 1.1350 would likely place 1.14 in the limelight, whereas a break below 1.13 could potentially put the H4 demand at 1.1256-1.1265 (sits on top of daily demand at 1.1215-1.1264) in the firing range.
With the H4 picture in mind, how do things stand on the higher timeframes? Over on the weekly chart, supply at 1.1533-1.1278 continues to exhibit bearish intentions. Due to this zone managing to cap upside since May 2015 (see red arrows) we still feel lower prices are on the cards, as the next logical target from here falls in around support at 1.0796. Turning our attention to the daily chart we can see that price retested the underside of supply at 1.1385-1.1332 again yesterday, forming back-to-back bearish selling wicks. This – coupled with weekly action lurking within supply (see above) will likely force this unit south to test daily demand coming in at 1.1215-1.1264.
Our suggestions: Despite 1.13 holding firm yesterday we would not consider this a stable enough boundary to enter long from. A sell on the break/retest of 1.13 could be something to consider. However, the distance to the next hurdle is around 35 pips. In regards to buying, one may want to contemplate the possibility of looking for intraday long positions around the aforementioned H4 demand should price reach this low owing to its convergence with daily demand (we only expect a bounce here due to where price is positioned on the weekly chart [see above]).
We are of the opinion that any trade taken at either of the above said zones WILL require lower timeframe confirmation. This could be either a break of a demand/supply and subsequent retest, a trendline break/retest or simply a collection of well-defined selling/buying wicks/tails around a lower-timeframe resistance/support. Stops are usually placed 5-10 pips beyond confirming structures.
Levels to watch/live orders:
- Buys: 1.1256-1.1265 [Tentative – confirmation required] (Stop loss: dependent on where one confirms this area).
- Sells: Watch for price to close below 1.13 and look to trade any retest seen thereafter (lower timeframe confirmation required).
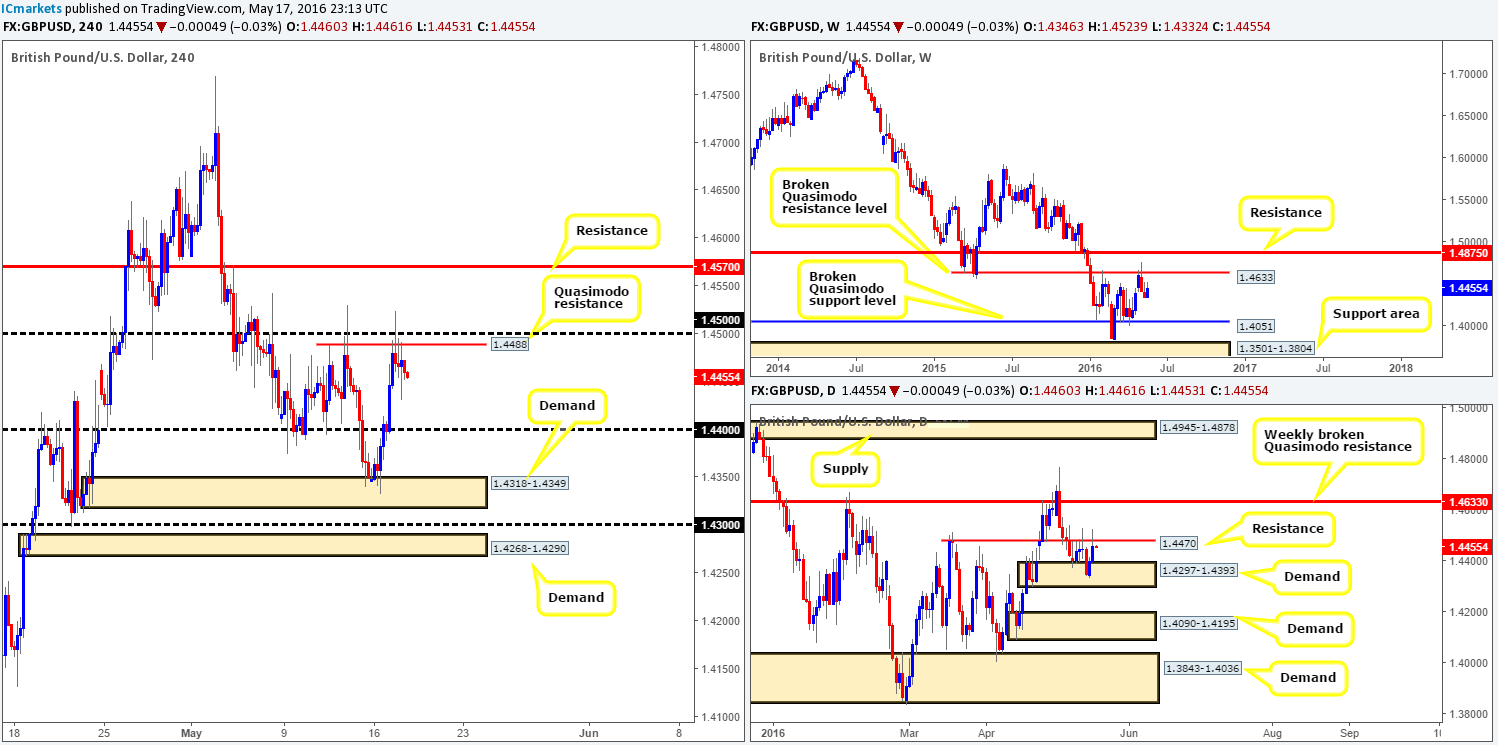
GBP/USD:
Early on in yesterday’s trading, Cable shook hands with a H4 Quasimodo resistance line at 1.4488 (bolstered by the 1.45 handle lurking just above it). A string of lower-than-expected GBP data managed to cap prices here, pushing the market to lows of 1.4430 on the day. As far as we see things at the moment, there’s room for the Pound to continue retreating down to the 1.44 region today. Conversely, a close above 1.45 may open up the possibility for a continuation rally towards H4 resistance at 1.4570 (ties in nicely with highs formed back in early February).
Given the recent rebound from the weekly broken Quasimodo resistance line at 1.4633, and daily price now kissing daily resistance at 1.4470, our team feels further downside could be on the horizon.
Our suggestions: Watch for price to retest the aforementioned H4 Quasimodo resistance line today. Should this come to fruition an adequate shorting opportunity might be at hand, targeting 1.44. For us personally, we would prefer to enter with lower timeframe confirmation (please see the top of this report for confirmation techniques), but for those who like the idea of entering at market we would suggest placing stops above the 12th May high 1.4530.
Levels to watch/live orders:
- Buys: Flat (Stop loss: N/A).
- Sells: 1.4488 region [Tentative – confirmation preferred] (Stop loss: dependent on where one confirms this area).
AUD/USD:
The AUD/USD, as can be seen from the H4 chart, is currently trading from a H4 supply drawn from 0.7367-0.7336. Now to keep this analysis straightforward, let’s dive straight in! Over on the weekly chart, the commodity currency is seen retesting the underside or a recently broken weekly demand at 0.7438-0.7315 as supply. Sliding down to the daily chart, we can also see this market teasing daily supply at 0.7402-0.7335 (encapsulates a resistance drawn from 0.7380 and sits within the above said weekly supply).
Now, couple all of this together with the AUD/SGD H4 chart chalking up supply at 1.0089-1.0051 and the NZD/USD H4 chart also positioned within H4 supply at 0.6856-0.6832 (both markets boast a high correlation with the Aussie), we’re sure you’ll agree, at least technically, the Aussie could possibly decline from here.
Our suggestions: Watch for shorting opportunities around the current H4 supply! First target, for us, would be the 0.73 handle, followed by the H4 mid-way support at 0.7250 (bolstered by H4 support at 0.7241 and daily demand at 0.7259-0.7226).

Levels to watch/live orders:
- Buys: Flat (Stop loss: N/A).
- Sells: Watch for shorting opportunities around H4 supply at 0.7367-0.7336 (waiting for lower timeframe confirmation is preferred).
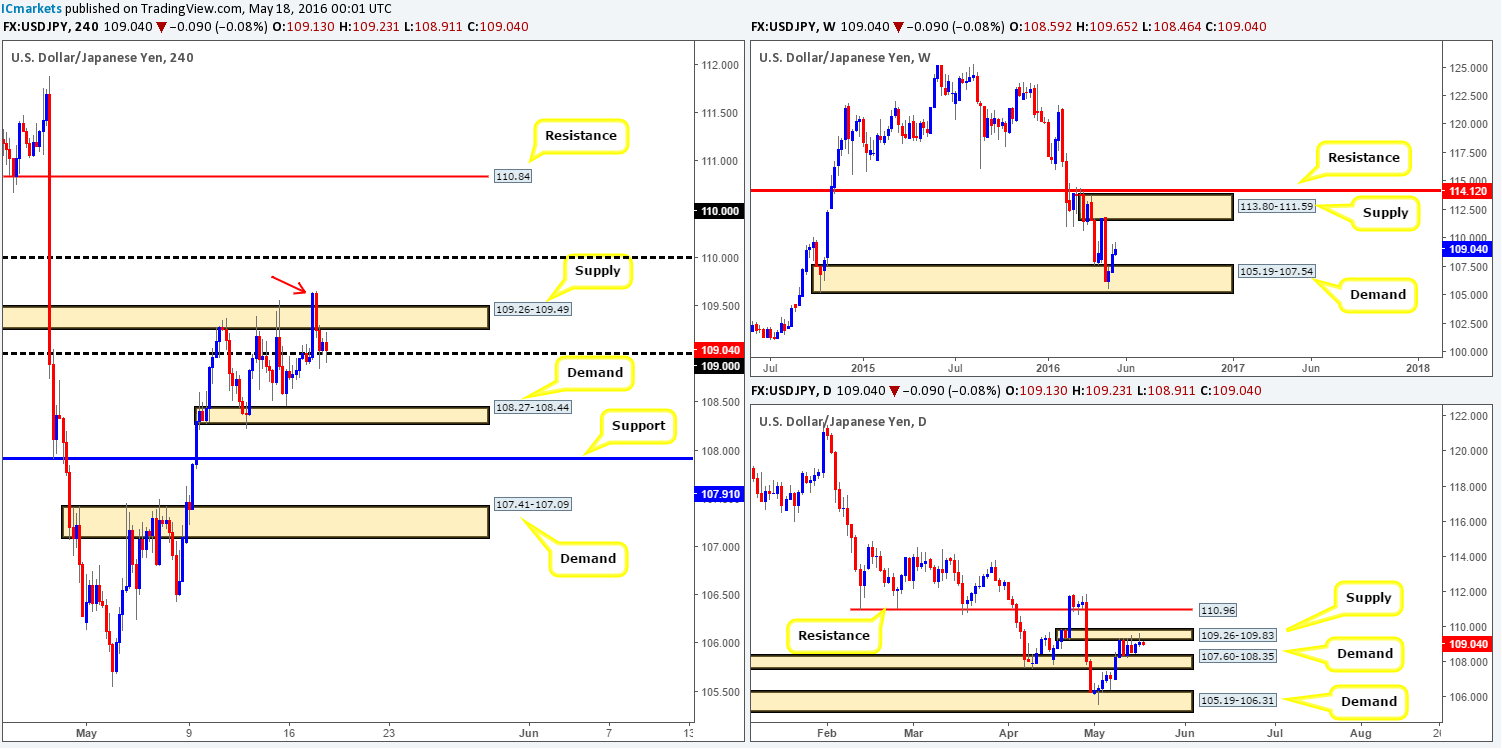
USD/JPY:
Starting from the top this morning, bids continue to support this market following the rebound from weekly demand at 105.19-107.54. On the condition that the bulls remain dominant it is likely that this unit will connect with supply penciled in at 113.80-111.59 sometime soon. Climbing down into the pits of the daily chart, however, the USD/JPY remains sandwiched between supply at 109.26-109.83 and demand at 107.60-108.35. Yesterday’s session saw the pair print a bearish selling wick from the underside of the above said supply which could encourage offers into this market today. A clear break above this range would likely see price challenge daily resistance given at 110.96, whereas a push lower has the daily demand zone at 105.19-106.31 (sits within the extremes of the aforementioned weekly demand) to target.
From the H4 chart, it’s clear to see that dollar bulls went on the offensive early on amid yesterday’s trading, consequently closing above H4 supply at 109.26-109.49 (red arrow). Nevertheless, this rally was a short-lived one as the pair retreated to test the 109 support going into the close.
Our suggestions: longs from 109 could be a possibility today given that the majority of sellers have likely been cleared from the aforementioned H4 supply. Assuming we manage to buy from here we would look to target 110.00 for partial profits, and then focus our energy on 110.84 – a H4 resistance which sits just below daily resistance at 110.96.
Now, due to the daily action still residing within supply (see above) one has to tread carefully here! We would strongly advise only trading from 109 if and only if there is some sort of lower timeframe buy setup present (please see the top of this report for confirming techniques).
Levels to watch/live orders:
- Buys: 109 region [Tentative – confirmation required] (Stop loss: dependent on where one confirms this area).
- Sells: Flat (Stop loss: N/A).
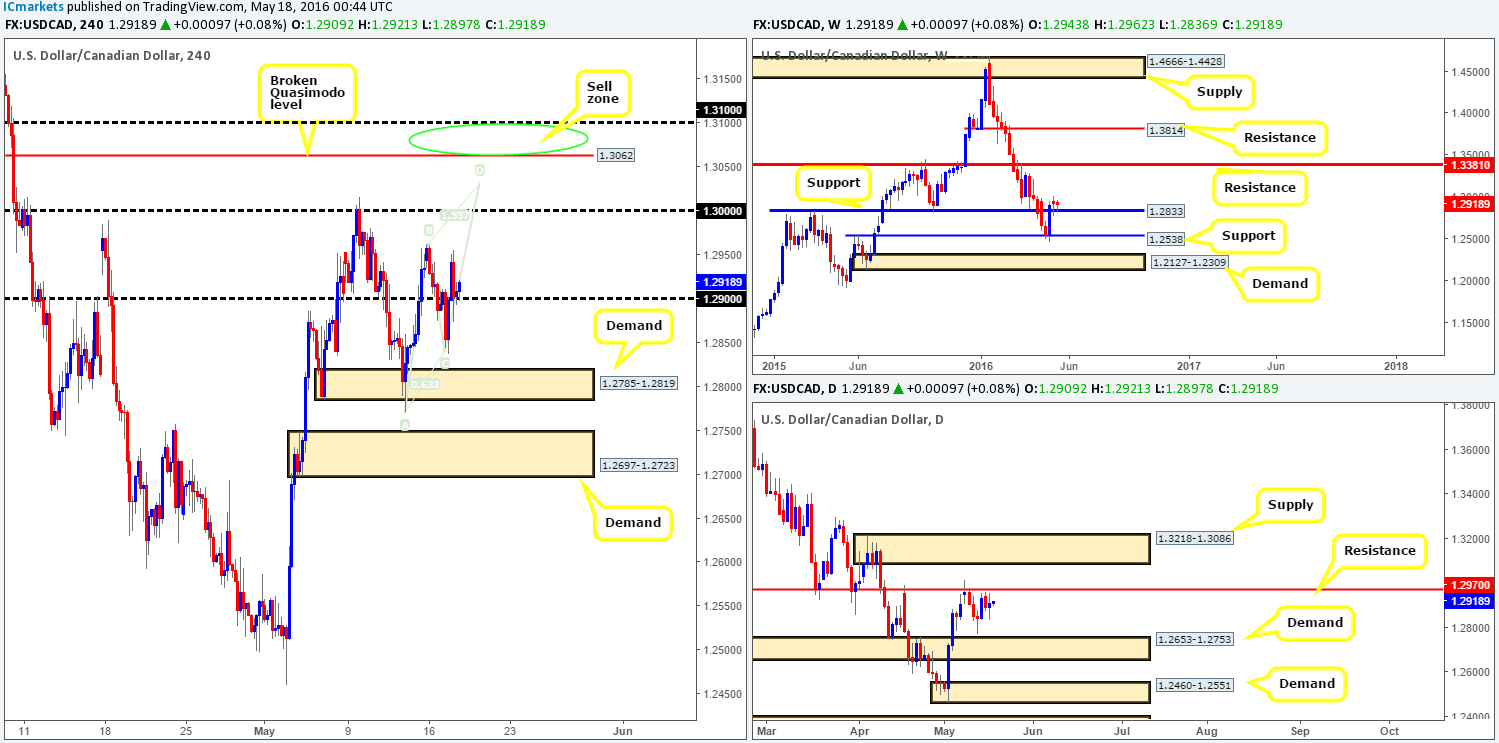
USD/CAD:
After price found support around the 1.29 handle early on in yesterday’s American session, the pair managed to hold ground here going into the close. Based on this we feel price has the potential to rally higher today, possibly even completing the D-leg of the H4 AB=CD bearish pattern which tops out around the 1.3031 mark. This – coupled with the following points makes this region a really interesting area:
- A lot of traders will be looking to short 1.30 owing to it being a large psychological barrier. A drive through this line to complete the AB=CD pattern will rip apart the stops above here and hand over liquidity (buy stops) for the bigger guys to short from the 1.31/1.3062 (H4 Quasimodo resistance) region represented by the green circle.
- Correlation confluence on the USD/NOK pair shows the H4 chart is currently also in the process of forming an AB=CD pattern which terminates just below a H4 Quasimodo resistance at 8.2968.
- The daily supply seen at 1.3218-1.3086 encapsulates the 1.31/1.3062 H4 sell zone adding extra weight to a reversal being seen from here.
The only grumble we have is the fact that weekly action is bouncing from support at 1.2833 right now!
Our suggestions: We would not be comfortable placing a pending sell order at the 1.31/1.3062 region due to weekly price. Waiting for the lower timeframes to prove selling interest resides here is, at least in our opinion, the safer route to take. For ways of confirming a zone, please see the top of this report.
Levels to watch/live orders:
- Buys: Flat (Stop loss: N/A).
- Sells: 1.3100/1.3062 [Tentative – confirmation required] (Stop loss: dependent on where one confirms this area).
USD/CHF:
Reporting from the weekly chart this morning, one can see that the Swissy continues to edge above weekly resistance coming in at 0.9760. In the event that the bulls continue to press higher this would likely place weekly supply at 1.0092-0.9928 back in view. Zooming in and looking at the daily chart, supply at 0.9787-0.9755 (now acting supply) was taken out during yesterday’s session, potentially exposing daily resistance penciled in at 0.9822.
Stepping across the pond into the H4 chart, demand drawn from 0.9740-0.9759 provided a decent floor for the bulls to advance this market going into yesterday’s American session. At the time of writing, this unit is now seen tickling the outskirts of a H4 broken Quasimodo level at 0.9809, whilst using the 0.98 handle as support.
Owing to the EUR/USD higher-timeframe picture suggesting a sell-off may take place (see the EUR/USD section above) this could potentially push the USD/CHF higher! Therefore, we have to be prepared for a push above the H4 broken Quasimodo line at 0.9809 today. The next area of interest beyond this zone can be seen around a H4 supply carved from 0.9913-0.9885 (lurks just below weekly supply at 1.0092-0.9928 and within daily supply at 0.9913-0.9869).
Our suggestions: Watch for price to close above 0.9809 and look to trade any retest seen thereafter (lower timeframe confirmation required). In the event that a lower timeframe buy setup is seen, a long from here is high probability, ultimately targeting the H4 supply we discussed above at 0.9913-0.9885. Bear in mind, however, some resistance could be seen around the daily level at 0.9822, so do make sure to keep a close eye on any positions taken from 0.9809.
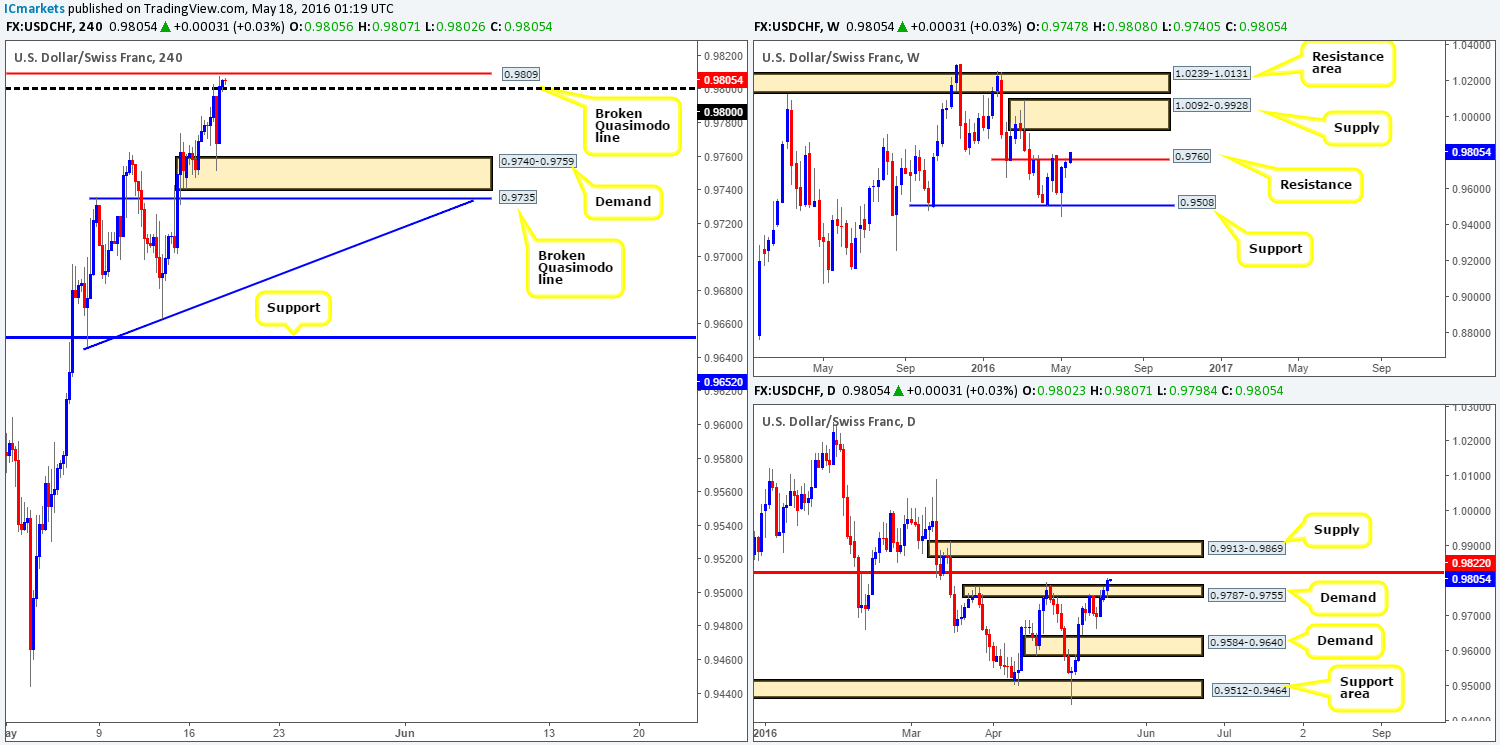
Levels to watch/live orders:
- Buys: Watch for price to close above 0.9809 and look to trade any retest seen thereafter (lower timeframe confirmation required).
- Sells: Flat (Stop loss: N/A).
DOW 30:
U.S. stocks cascaded lower during the course of yesterday’s sessions, engulfing H4 demand at 17521-17556 and testing H4 demand drawn from 17430-17479. Considering that this H4 demand ties in nicely with a H4 channel support line taken from the low 17776, price could potentially springboard itself north from here. However, let’s be mindful of the fact that the recently consumed H4 demand is now effectively a supply zone so the bulls may struggle here. To our way of seeing things, however, higher-timeframe structure supports an advance. Over on the weekly chart price remains trading from a weekly support area at 17446-17606, whilst down on the daily chart, demand at 17396-17554continues to hold firm.
Our suggestions: Wait for the H4 bulls to prove their worth! What we mean by this is to simply wait and see if H4 price can close above overhead H4 supply. In the event that this comes into view, we can then look to enter long on any dip seen, targeting H4 supply at 17759-17707 as per the green arrows.
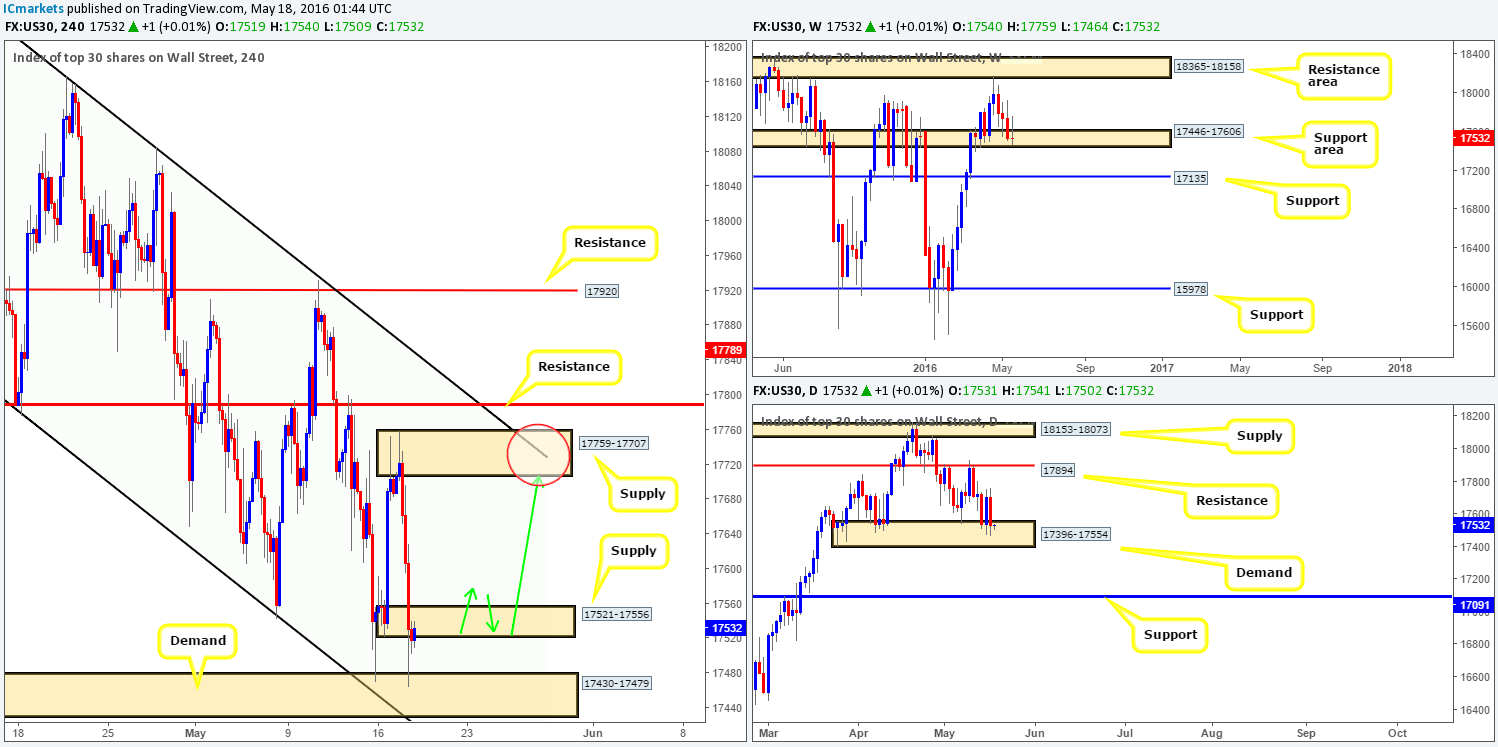
Levels to watch/live orders:
- Buys: Watch for price to close above 17521-17556 and look to trade any retest seen thereafter (lower timeframe confirmation required).
- Sells: Flat (Stop loss: N/A).
Gold:
Beginning with a look at the weekly chart this morning, the buyers and sellers continue to battle for position around weekly supply coming in at 1307.4-1280.0. With the oil market moving very similar to gold, we can also see that oil is currently trading within weekly supply at 50.91-47.22.
Looking down to the daily chart, nevertheless, the yellow metal has found active bids around daily demand carved from 1270.8-1257.5. In view of yesterday’s bullish response from the top-side of this demand, and the prior day’s candle wick seen marked with a green arrow at 1288.5 likely clearing overhead supply, this market could potentially rally higher today.
Stepping across to the H4 chart, thanks to yesterday’s bounce from H4 support at 1269.6 we may have a nice-looking three-drive advancing pattern to play with. In addition to this, notice that this pattern also completes beautifully around H4 supply at 1295.4-1291.9, which is bolstered by H4 resistance at 1296.3 and lodged within the above said weekly supply.
Our suggestions: With the daily timeframe looking like it wants to advance, the H4 three-drive pattern may very well complete today. And, since we know that price is currently trading from weekly supply, a short from the H4 supply zone is something we’re very interested in. However, we are not willing to place a pending order at this zone as there’s a strong possibility of a fakeout taking place before sellers step in. Waiting for lower timeframe selling confirmation is, at least in our opinion, the safer path to take. For those who have no confirmation methods, you may want to consider the following:
- A break/retest of demand.
- A trendline break/retest.
- Selling wicks – essentially we look for a cluster of very obvious spikes off of lower-timeframe resistance levels within the higher-timeframe zone.

Levels to watch/live orders:
- Buys: Flat (Stop loss: N/A).
- Sells: 1295.4-1291.9 [Tentative – confirmation required] (Stop loss: dependent on where one confirms this area – usually stops are placed 5-10 pips beyond confirming structures).


