
A note on lower timeframe confirming price action…
Waiting for lower timeframe confirmation is our main tool to confirm strength within higher timeframe zones, and has really been the key to our trading success. It takes a little time to understand the subtle nuances, however, as each trade is never the same, but once you master the rhythm so to speak, you will be saved from countless unnecessary losing trades. The following is a list of what we look for:
- A break/retest of supply or demand dependent on which way you’re trading.
- A trendline break/retest.
- Buying/selling tails/wicks – essentially we look for a cluster of very obvious spikes off of lower timeframe support and resistance levels within the higher timeframe zone.
- Candlestick patterns. We tend to stick with pin bars and engulfing bars as these have proven to be the most effective.
We search for lower timeframe confirmation between the M15 and H1 timeframes, since most of our higher-timeframe areas begin with the H4. Stops are usually placed 3-5 pips beyond confirming structures.
EUR/USD:
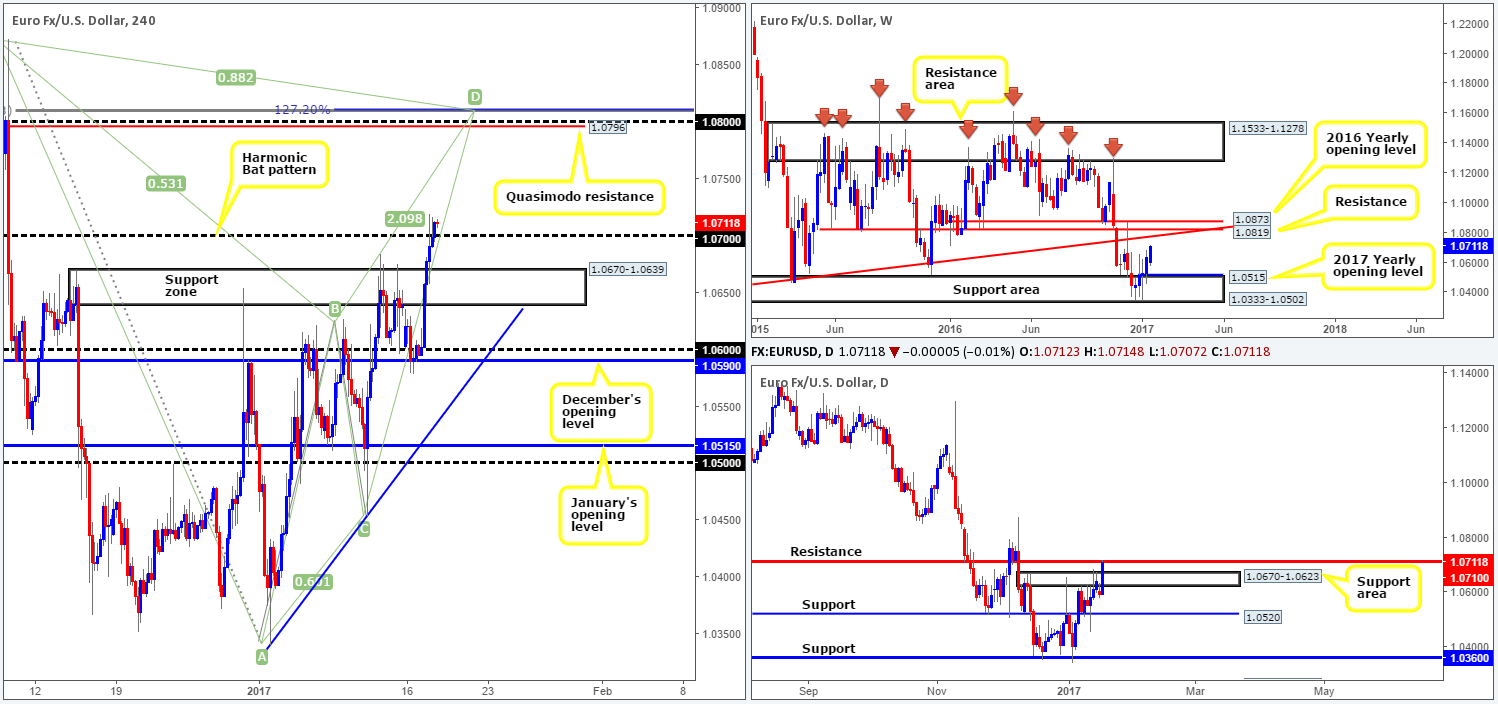
The EUR, as you can see, made considerable ground against its US counterpart yesterday, conquering both the H4 supply area at 1.0670-1.0639 (now acting support zone) and the psychological band 1.07. Providing that the bulls remain in the driving seat above this number today, we could very well see price challenge 1.0796 – a H4 Quasimodo resistance line that’s positioned nearby the tip of a H4 Harmonic (Bat) potential reversal zone at 1.0809 and the 1.08 handle.
According to weekly structure, there’s room seen for the major to continue trading northbound until we reach the long-term weekly trendline resistance extended from the low 0.8231, thus adding weight to a long from the 1.07 neighborhood. Despite both the weekly and H4 structure depicting a bullish stance, however, daily action is currently seen teasing the underside of a daily resistance line at 1.0710, hence our need for a confirming retest and H4 bull candle off 1.07 before pulling the trigger!
Our suggestions: In the event that price does retest 1.07 and chalk up a bullish H4 confirming candle, we’ll look to trade long, targeting the above noted H4 Quasimodo resistance at 1.0796. As already stated, this level also converges with the tip of a H4 Harmonic (Bat) potential reversal zone at 1.0809 and the 1.08 level, but what you might not see if you focus on only one chart for your trading, is that it’s also located nearby the long-term weekly trendline resistance highlighted above! Therefore, not only is this level a fantastic take-profit zone, it is also a strong location to watch for shorts!
Data points to consider: EUR CPI reading at 10am. US CPI report at 1.30pm, FOMC member Kashkari speaks at 4pm, Fed Chair Yellen speaks at 8pm GMT.
Levels to watch/live orders:
- Buys: 1.07 region ([a H4 bull candle is required here before a trade can be executed] stop loss: ideally beyond the trigger candle).
- Sells: 1.08 region ([this is an area where we would consider trading without confirmation] stop loss: 1.0815 [aggressive stop] 1.0875 [conservative stop]).
GBP/USD:
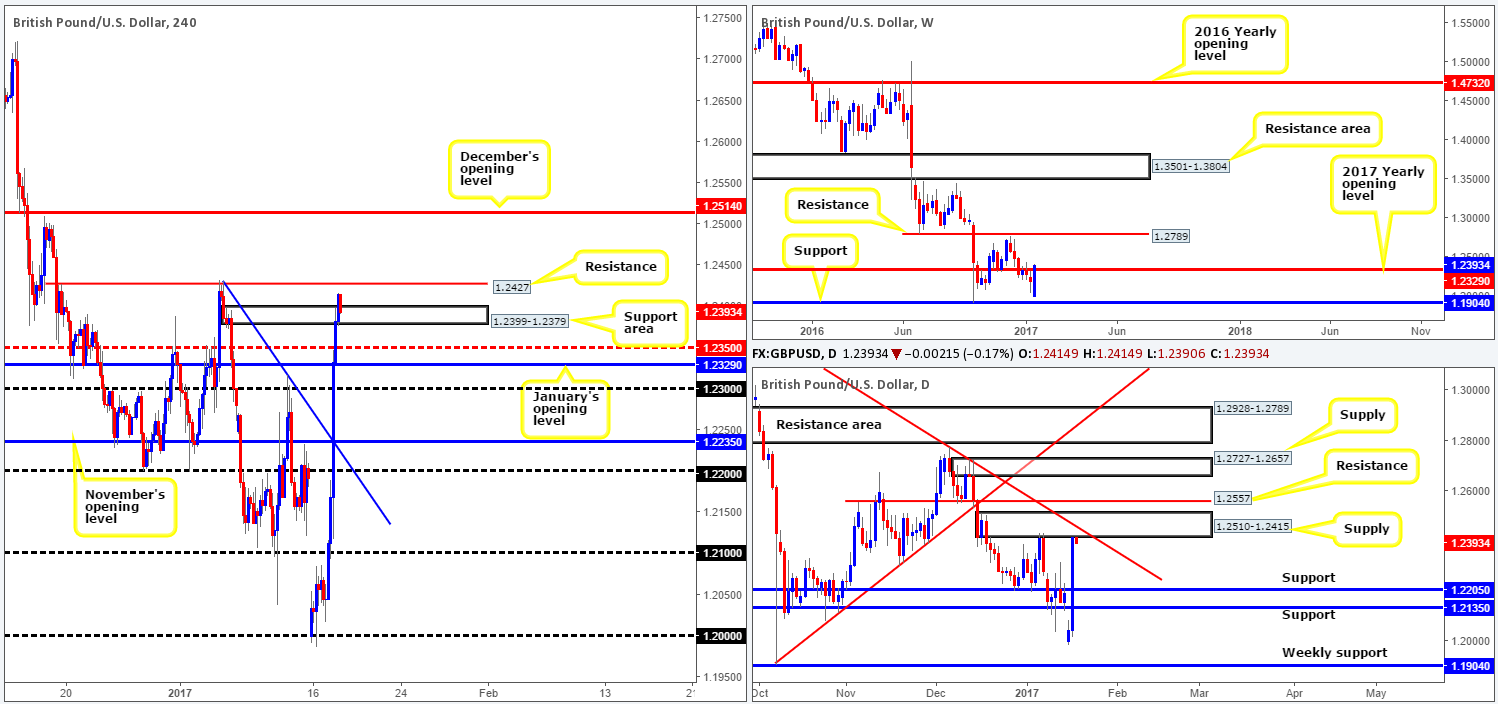
The GBP/USD catapulted itself over 350 pips northbound yesterday after British Prime Minister Theresa May took to the stage. The PM reported that UK lawmakers will get a vote on the final Brexit deal. This saw several H4 tech resistance levels destroyed, with price seen ending the day shaking hands with daily supply at 1.2510-1.2415 (fuses with a daily trendline resistance taken from the high 1.3445), and topping just ahead of a H4 resistance level coming in at 1.2427. What this move also accomplished, as can be seen from the weekly chart, was a break above the 2017 yearly opening level at 1.2329.
Our suggestions: With H4 action now currently testing a H4 support area at 1.2399-1.2379, where does one go from here? Well, a long from this base is not be something our desk would feel comfortable taking, given the daily supply in play right now. What about a short from the H4 resistance level at 1.2427? This certainly has more appeal. Seeing as how weekly price has yet to CLOSE beyond the 2017 yearly opening level and, of course, taking into account the current daily supply, we would be interested in selling this market from here. However, this would only be feasible on the condition that a lower-timeframe confirming setup takes shape beforehand (see the top of this report for ideas on how to utilize the lower-timeframe candles for entry).
Data points to consider: UK employment reports at 9.30am. US CPI report at 1.30pm, FOMC member Kashkari speaks at 4pm, Fed Chair Yellen speaks at 8pm GMT.
Levels to watch/live orders:
- Buys: Flat (stop loss: N/A).
- Sells: 1.2427 region ([lower-timeframe confirmation is required here before a trade can be executed] stop loss: depends on where one confirms the zone).
AUD/USD:
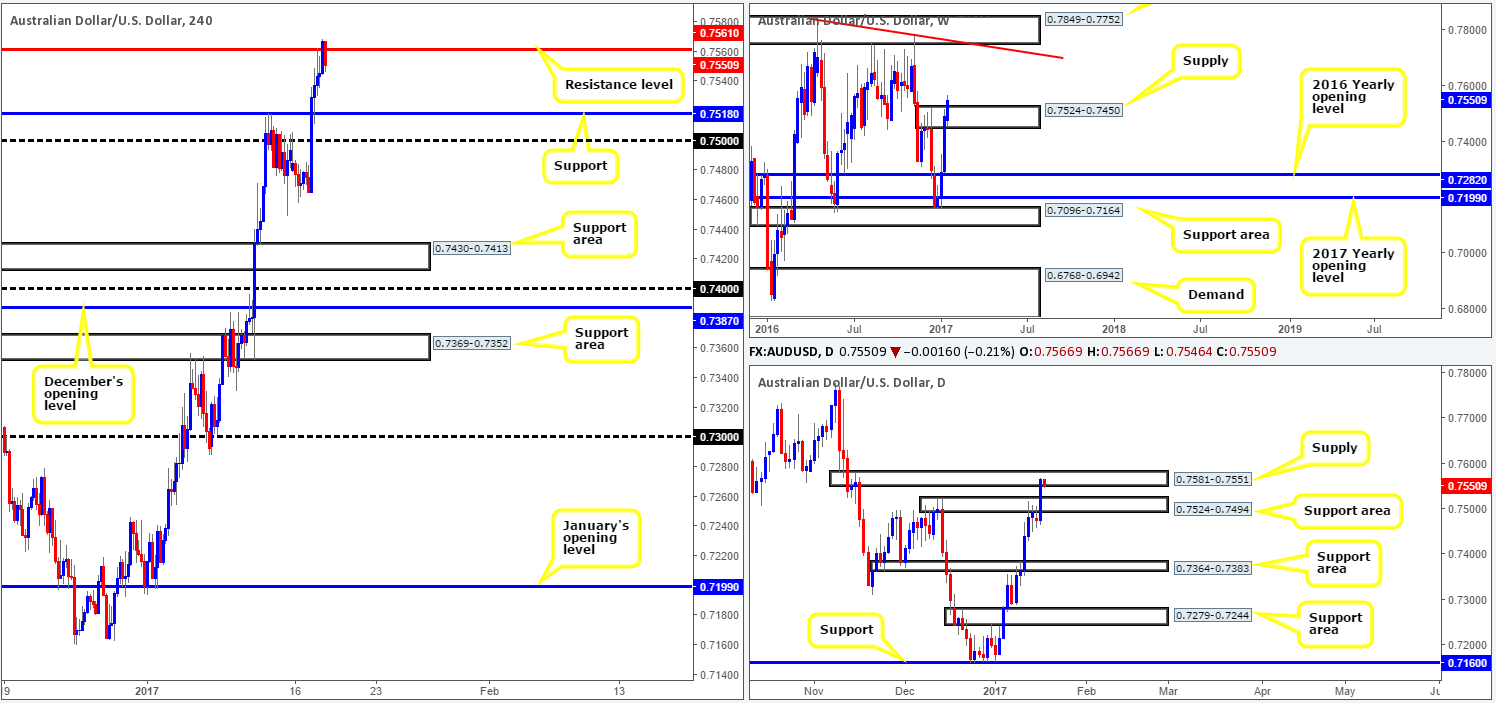
Dollar losses, coupled with a rally over in the gold market, helped nudge the Aussie dollar to highs of 0.7568 yesterday and consequently touch base with a H4 resistance level found at 0.7561. On top of this, we can see that yesterday’s daily candle crossed swords with daily supply chalked up at 0.7581-0.7551 after breaking through a lower daily supply at 0.7524-0.7494 (now acting support area). While both timeframes display bearish intent as far as structure is concerned, traders may want to note that weekly price is, thanks to yesterday’s advance, now trading above weekly supply at 0.7524-0.7450. According to this timeframe, this could suggest further upside may be on the cards to a weekly supply at 0.7849-0.7752, which happens to be joined together with a weekly trendline resistance stretched from the high 0.7835. Yet, we would only consider this plausible if, and only if, a weekly close is formed above the current weekly supply area!
Our suggestions: Although H4 and daily price currently reflect a bearish stance, the next downside targets on both timeframes are relatively close (H4: support at 0.7518/daily: the top edge of the support area at 0.7524). Risk/reward considerations, therefore, would argue against trading from the H4 base, unless of course you’re comfortable taking trades with very small stop losses, which we’re not. As such, opting to stand on the sidelines today may very well be the best path to take.
Data points to consider: US CPI report at 1.30pm, FOMC member Kashkari speaks at 4pm, Fed Chair Yellen speaks at 8pm GMT.
Levels to watch/live orders:
- Buys: Flat (stop loss: N/A).
- Sells: Flat (stop loss: N/A).
USD/JPY:
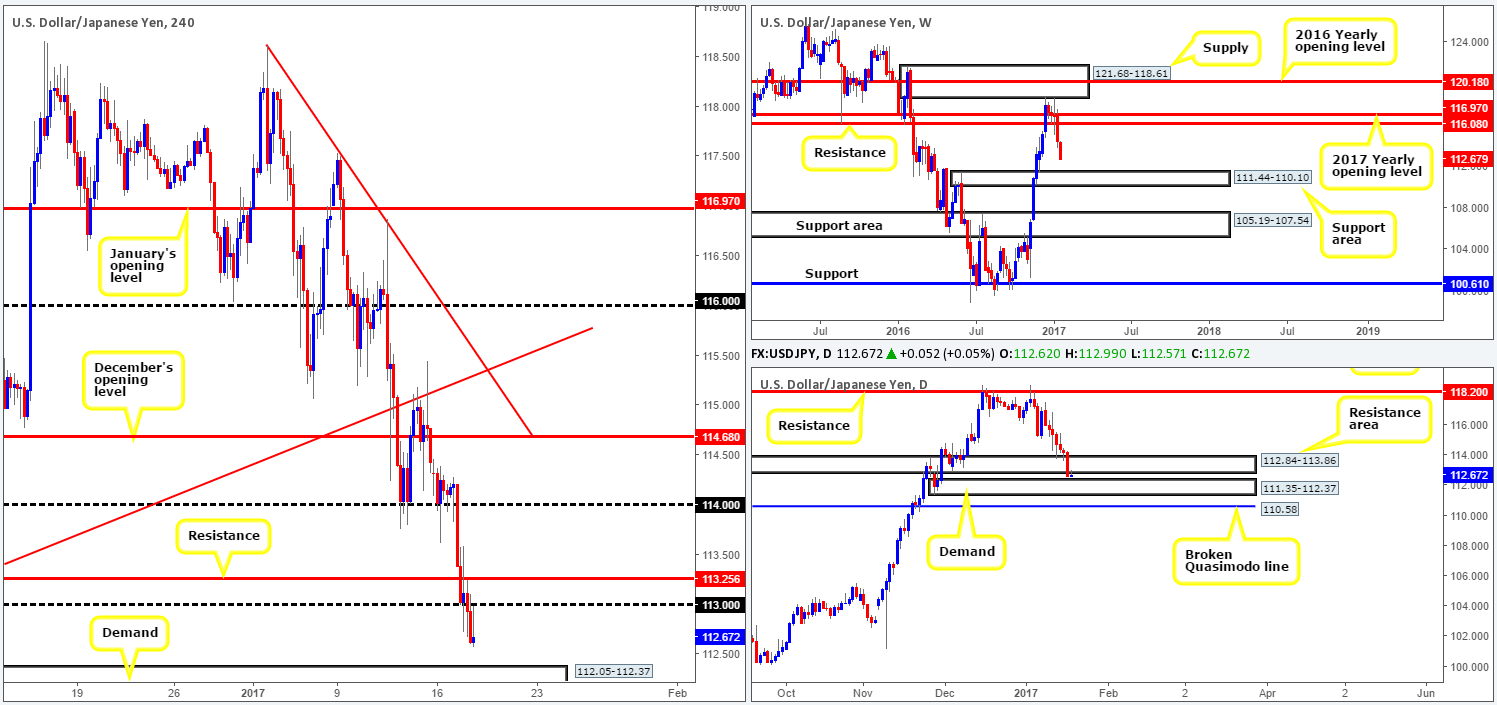
Bolstered by comments made by President-Elect Donald Trump that the dollar is ‘too strong’; the US dollar tumbled against the majority of its trading peers yesterday. The H4 supports at 113.25, as well as the nearby psychological number at 113 were both taken out as a result of yesterday’s selloff. The next support target on tap comes in at 112.05-112.37: a H4 demand area that is positioned around the top edge of a daily demand seen at 111.35-112.37.
In view of weekly price still trading in bearish territory (following last week’s break through weekly support at 116.08 [now acting resistance]), the pair could, as far as we can see, continue to weaken down to as far as the weekly support area coming in at 111.44-110.10. With this in mind, we feel the current H4 demand area will be brought into the picture very soon!
Our suggestions: Keeping it simple, we’re going to be looking for longs off of the current H4 demand area. Why, when the weekly timeframe signals lower prices may be on the horizon? Well, the H4 demand area, as we mentioned above, is structured around the top edge of the current daily demand. And, by extension, the daily demand zone sits at the top edge of the weekly support area mentioned above at 111.44-110.10. Therefore, each zone is connected and thus supports each other. Despite this, our desk recommends waiting for at least a H4 bull candle to form off the H4 zone before taking action, since it’s impossible to know how deep price will want to fake into the connecting higher-timeframe zones.
Data points to consider: US CPI report at 1.30pm, FOMC member Kashkari speaks at 4pm, Fed Chair Yellen speaks at 8pm GMT.
Levels to watch/live orders:
- Buys: 112.05-112.37 ([a H4 bull candle is required here before a trade can be executed] stop loss: ideally beyond the trigger candle).
- Sells: Flat (stop loss: N/A).
USD/CAD:
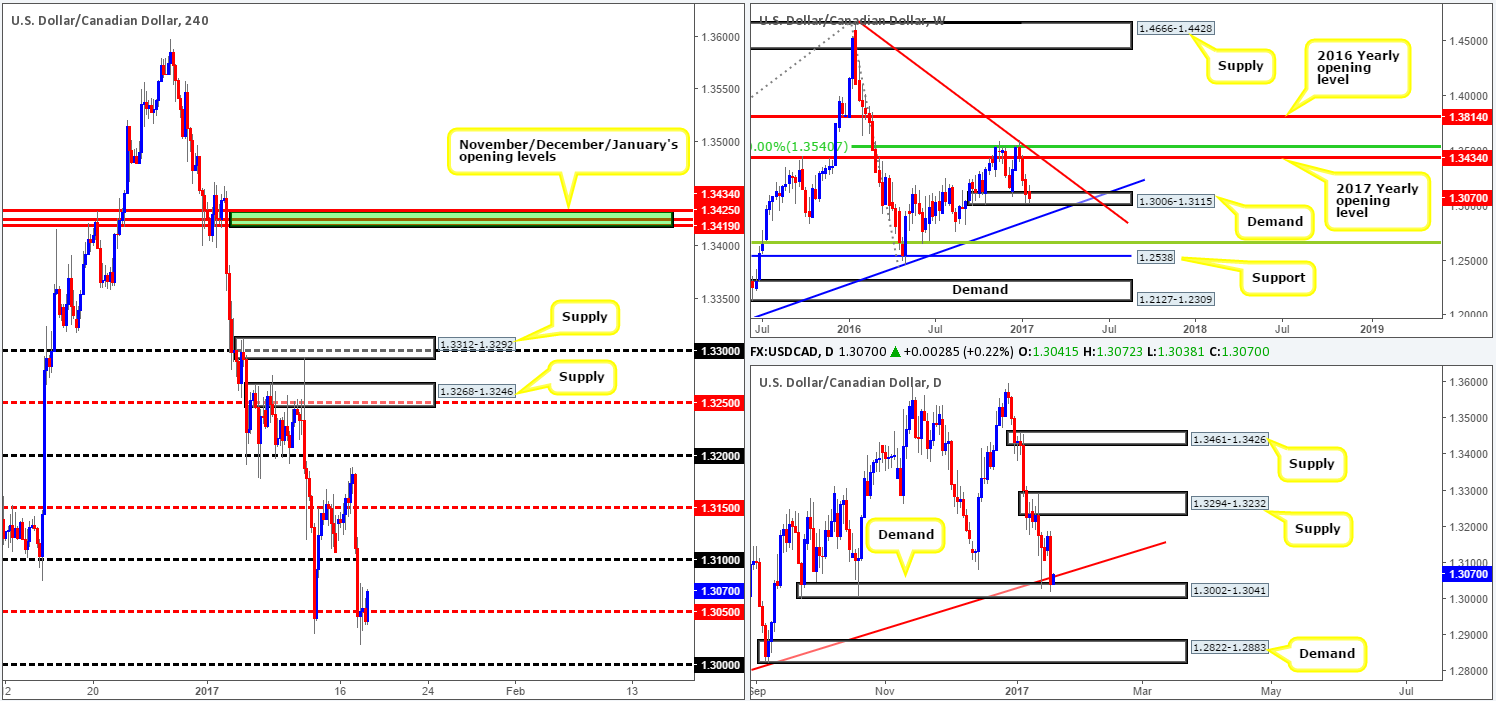
Looking at the weekly chart this morning, we can see that despite the recent selloff, the buyers and sellers remain battling for position within a weekly demand area coming in at 1.3006-1.3115. If the lower edge of this area is taken out, then we’d expect the unit to extend down to a weekly trendline support stretched from the high 1.1278. Moving down a level, daily price recently closed below the daily trendline support taken from the low 1.2654 and tested daily demand given at 1.3002-1.3041. This zone is in a rather tricky spot right now as there’s likely going to be sellers attempting to sell on the retest of the broken trendline as resistance, and buyers trying to go long from demand!
Stepping across to the H4 candles, the pair found support 18 pips ahead of the major psychological hurdle 1.30 yesterday, following a heavy round of selling from highs of 1.3188. As we write, price is seen trading back above the H4 mid-way level 1.3050 and looks to be on course to test the 1.31 handle.
Our suggestions: A short from 1.31 is risky because not only would one be selling into daily buyers from here; they’d also be tackling weekly buyers as well! Personally, the only area that really jumps out to us this morning is the 1.30 level, since it’s positioned deep within both the above noted weekly and daily demands.
Data points to consider: BoC interest-rate statement at 3pm along with a press conference at 4.15pm. US CPI report at 1.30pm, FOMC member Kashkari speaks at 4pm, Fed Chair Yellen speaks at 8pm GMT.
Levels to watch/live orders:
- Buys: 1.30 region ([lower-timeframe confirmation is required here before a trade can be executed] stop loss: depends on where one confirms the zone).
- Sells: Flat (stop loss: N/A).
USD/CHF:
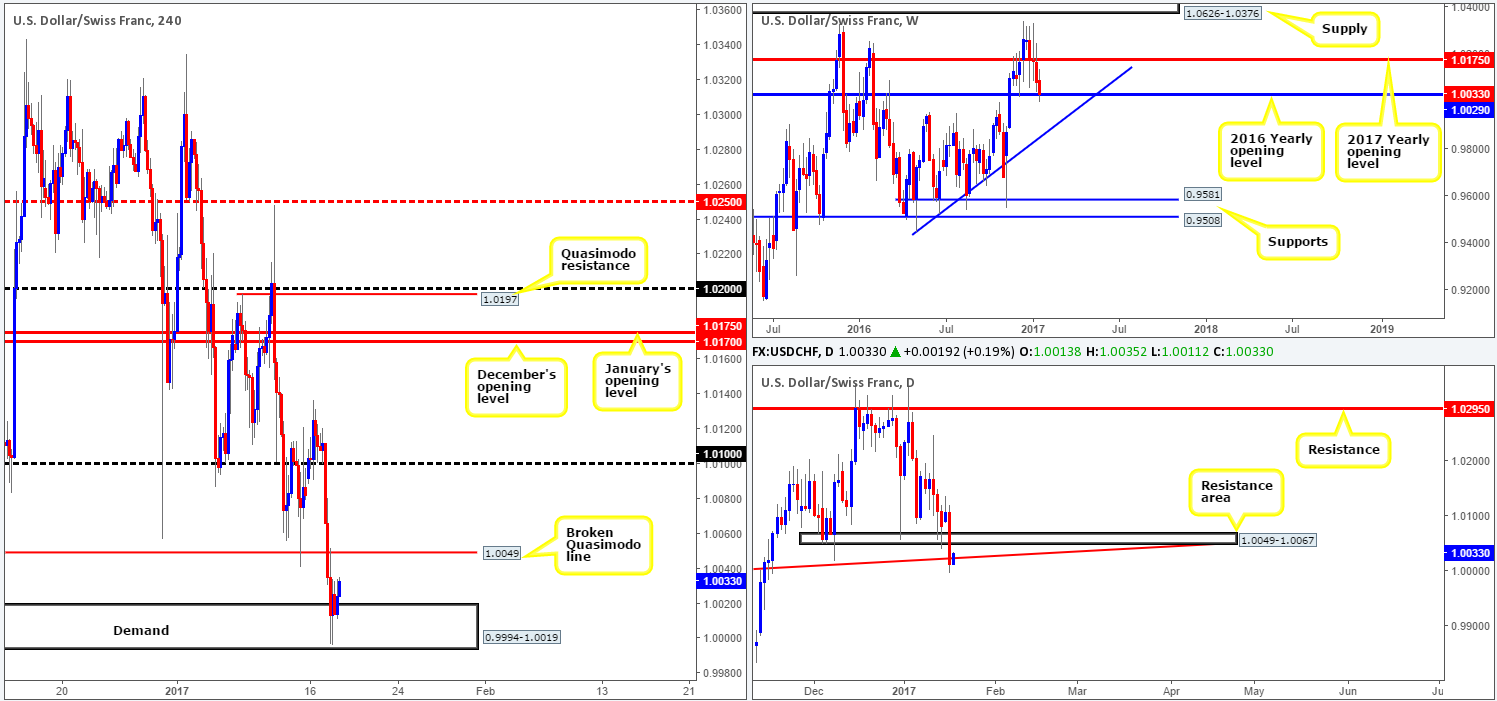
The Swissy came under fresh pressure yesterday, following comments made by President-Elect Donald Trump that the dollar is ‘too strong’. The H4 psychological band 1.01 along with the H4 Quasimodo support at 1.0049 were both taken out during yesterday’s selloff, allowing price to test parity (H4 demand seen at 0.9994-1.0019).
Alongside this, daily action recently closed below the trendline support taken from the high 0.9956, which, as you can see, is being retested as resistance as we write. Furthermore, the 2016 yearly opening level at 1.0029 was also recently brought into play (see the weekly chart).
Our suggestions: The H4 broken Quasimodo line at 1.0049, which can also be said to represent the underside of a daily resistance zone, is likely going to react should price retest this level today. Trading it for anything more than bounce, however, would be risky. Let’s not forget that by shorting from here, you’d effectively be going up against weekly buyers from the 2016 yearly opening level!
Data points to consider: US CPI report at 1.30pm, FOMC member Kashkari speaks at 4pm, Fed Chair Yellen speaks at 8pm GMT.
Levels to watch/live orders:
- Buys: Flat (stop loss: N/A).
- Sells: 1.0049 ([lower-timeframe confirmation is required here before a trade can be executed] stop loss: depends on where one confirms the zone).
DOW 30:
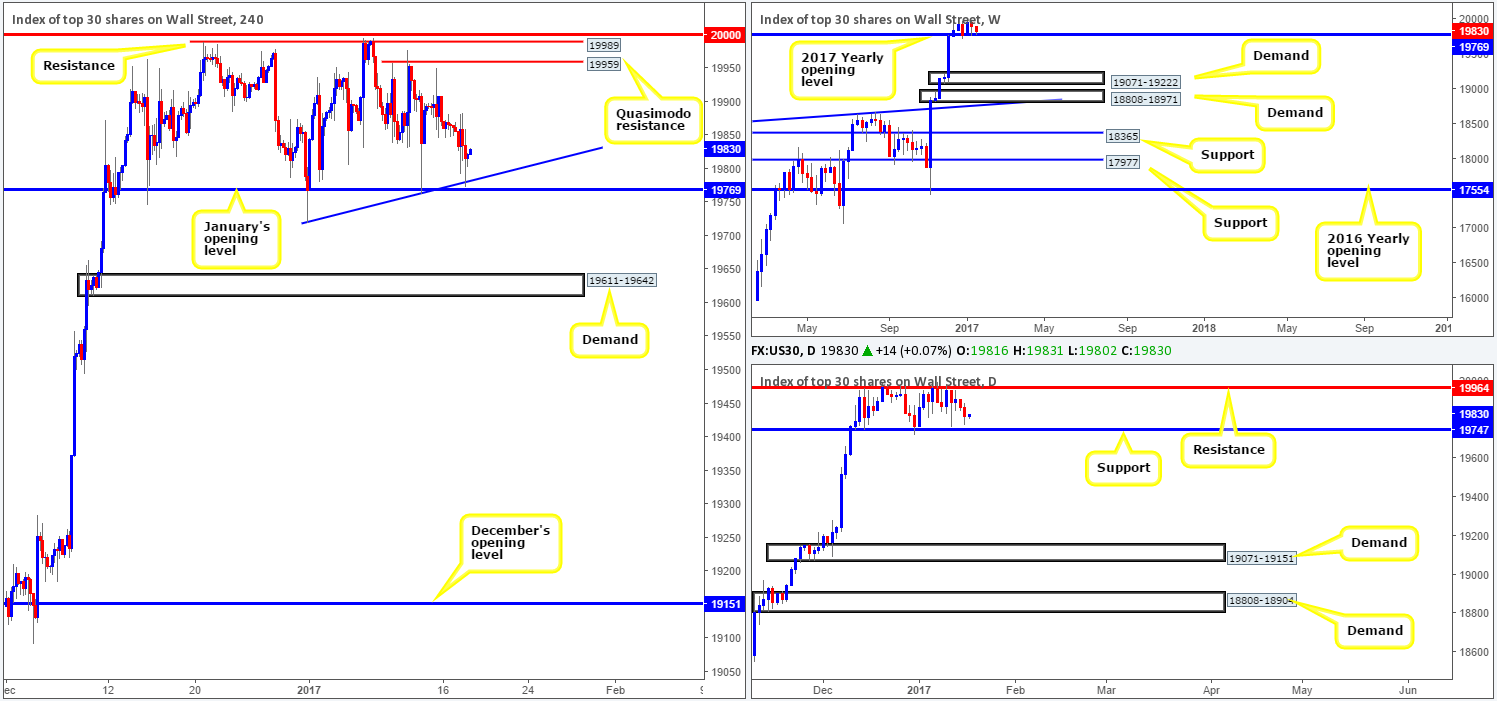
During the course of yesterday’s sessions, we saw the H4 candles drop and come within touching distance of January’s opening level at 19769. In hindsight, this would have been a beautiful spot to enter long from considering that the level converged with a nearby H4 trendline support taken from the low 19720, and also a neighboring daily support level coming in at 19747.
With the weekly candles still trading above the 2017 yearly opening level at 19769, the overall tone remains biased to the upside, in our opinion. Unless the H4 candles decide to reverse and break below yesterday’s low 19774 and attack the above noted daily support level, we do not really see much to hang our hat on at this time.
Our suggestions: Buying between the current daily support and January opening level is certainly something to consider today. However, given the size of the zone, we would strongly recommend waiting for at least a H4 bull candle to form to confirm buyer intent, before clicking the buy button.
Data points to consider: US CPI report at 1.30pm, FOMC member Kashkari speaks at 4pm, Fed Chair Yellen speaks at 8pm GMT.
Levels to watch/live orders:
- Buys: 19747/19769 ([a H4 bull candle is required here before a trade can be executed] stop loss: ideally beyond the trigger candle).
- Sells: Flat (stop loss: N/A).
GOLD:
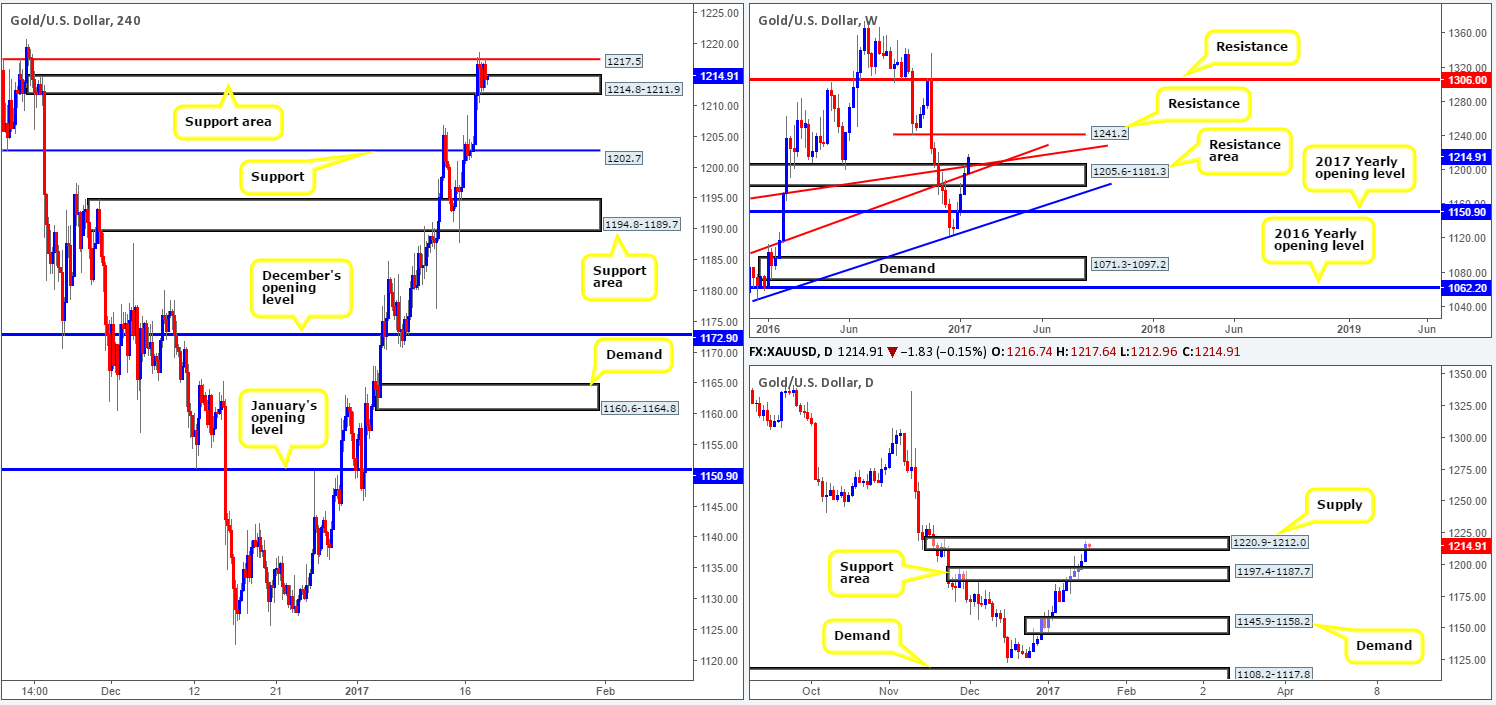
(Trade update: Stopped out at 1215.0 – please see the previous report for information regarding this trade).
With the US dollar taking a sizable hit yesterday, it was no surprise to see that gold advanced north. Bullion broke through the top edge of H4 supply at 1214.8-1211.9 (now an acting support area) and collided with a H4 Quasimodo resistance level drawn from 1217.5, and has so far held firm. What’s more, the recent advance also forced daily candles to break into a daily supply zone seen at 1220.9-1212.0, which ultimately bolsters the current H4 Quasimodo resistance for a sell trade. For all that though, it may be worth noting that weekly action is seen trading some distance above the weekly resistance area at 1205.6-1181.3, hinting further upside may be on the cards.
However, just because the weekly candles are currently flexing their muscles, it does not mean that a short from the current H4 Quasimodo will not work out. With that being said though, our team would not consider becoming sellers in this market until the H4 support area at 1214.8-1211.9 is taken out!
Our suggestions: Before looking to sell, wait for a H4 close to be seen beyond the current H4 support area. This will, alongside a retest and a lower-timeframe confirming signal (see the top of this report for information on this), be sufficient enough to permit a short, targeting the H4 support at 1202.7 as an initial take-profit target.
Levels to watch/live orders:
- Buys: Flat (stop loss: N/A).
- Sells: Watch for a H4 close below 1214.8-1211.9 and look to trade any retest seen thereafter ([lower-timeframe confirmation is required following the retest here before a trade can be executed] stop loss: depends on where one confirms the zone).


