
EUR/USD:
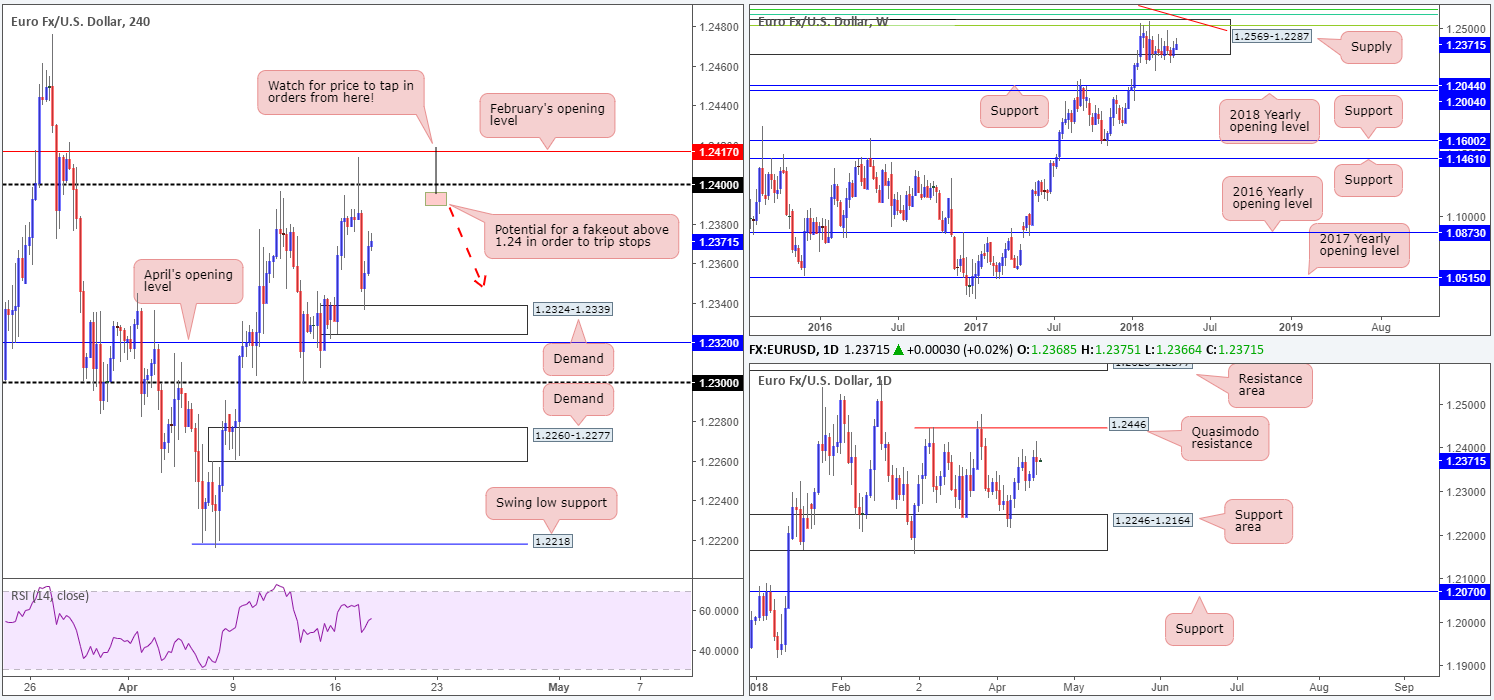
For those who read Tuesday’s report you may recall the desk highlighting a possible fakeout play through 1.24 in the shape of a H4 bearish pin-bar formation. As you can see, this came to fruition during yesterday’s session but failed to tag in orders from February’s opening level seen above it at 1.2417. Nevertheless, price dipped lower and shook hands with H4 demand positioned at 1.2324-1.2339 going into US trade, and has consequently recovered a large portion of the day’s losses. Well done to any of our readers who took advantage of this downside move.
On the data front, German ZEW survey displayed a lower-than-expected reading, plunging to -8.2 for April. US data, on the other hand, was somewhat optimistic. Housing starts and Building permits were firmly up in March, after falling in previous months. US industrial production beat expectations (0.5% MM vs 0.3% exp), while manufacturing output was in line with expectations (+0.1% MM), mainly boosted by a rise in utilities output as the weather improved.
As is shown on the weekly timeframe, the buyers and sellers remain battling for position within the walls of a weekly supply zone seen at 1.2569-1.2287 that has managed to cap upside activity since late January. Navigating price action on the daily timeframe, however, we can see that the unit appears poised to challenge a daily Quasimodo resistance level plotted at 1.2446.
Potential trading zones:
Similar to Tuesday’s outlook, the team believes a fakeout of 1.24 could be in store, but this time actually connecting with February’s opening level at 1.2417. Once again, A H4 bearish pin-bar formation, as drawn on the H4 chart, would be considered a reasonably strong sell signal, with an initial downside target objective set at the aforementioned H4 demand. Should price fail to print a bearish signal, be prepared for the euro to test the daily Quasimodo resistance mentioned above at 1.2446.
Data points to consider today: EUR Final CPI y/y; FOMC members Dudley and Quarles speak.
GBP/USD:
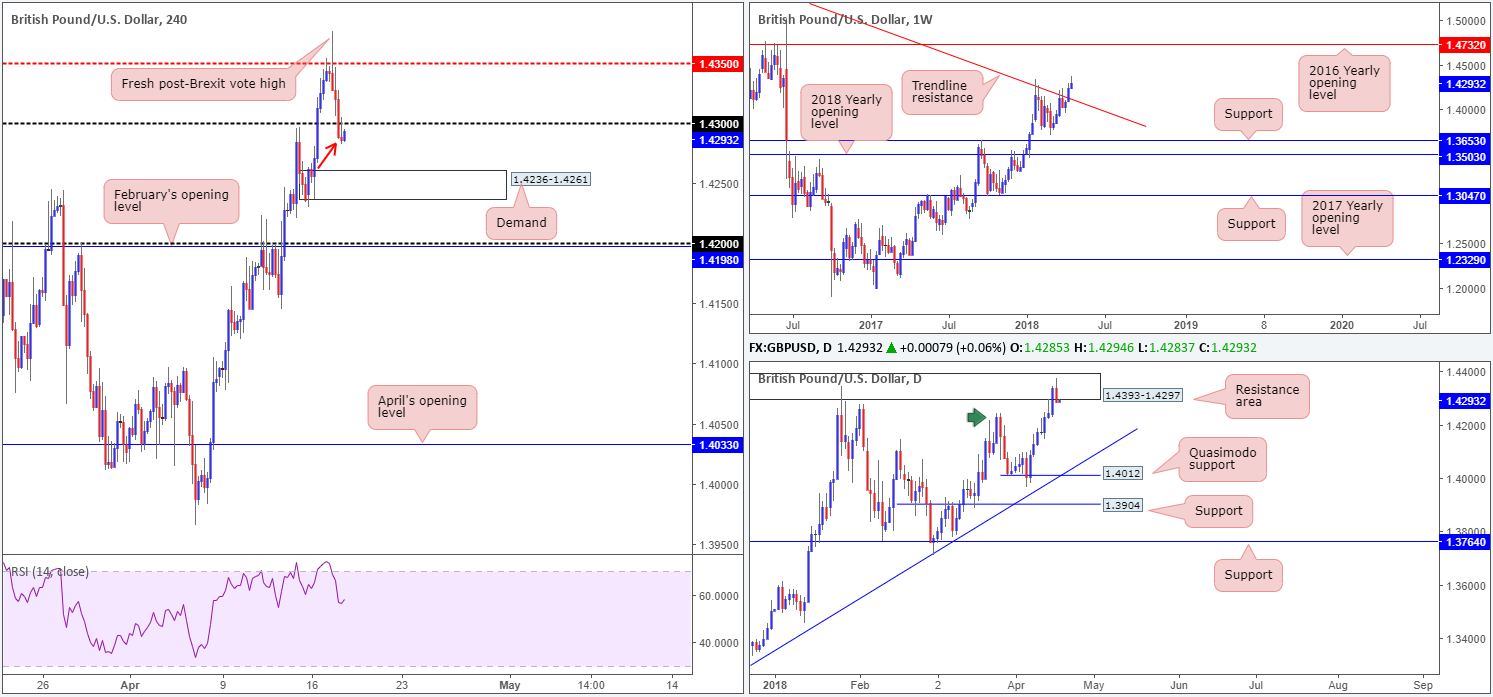
In recent dealings, the British pound retreated from a fresh post-Brexit vote high of 1.4376, stabbing through orders at a H4 mid-level resistance drawn from 1.4350. Disappointing UK job’s data fueled the initial move, with price eventually reclaiming the 1.43 handle by the day’s end. The next downside target seen on the H4 scale is a H4 demand base coming in at 1.4236-1.4261, followed then by 1.42 and February’s opening level at 1.4198.
Turning over to the weekly timeframe, further buying is still likely given current structure. Last week’s firm close above a long-term weekly trend line resistance taken from the high 1.5930 was the first since late 2015! Should the bulls remain defensive, the next upside target can be seen at 1.4732: the 2016 yearly opening level. A little lower on the curve, nonetheless, daily price is currently interacting with a daily resistance area at 1.4393-1.4297. Breaking a seven-day bullish run, the pair chalked up a nice-looking daily bearish rotation candle on Tuesday. March 26 highs at 1.4244 (green arrow) are likely to offer support. A break of these values, however, could lead to a move being seen as far south as the daily Quasimodo support at 1.4012.
Potential trading zones:
While further upside is likely as per the weekly timeframe, waiting for the current daily resistance area to be consumed before entering into any medium-term buy positions is recommended. Medium-term selling, on the other hand, may be an alternative as weekly price may look to retest the recently broken trend line as support.
Intraday, traders are likely looking to fade the recent H4 bearish pin-bar formation seen sub 1.43 today (red arrow). Aggressive stop-loss placement above 1.43 is an option, whereas conservative traders may set sell orders to trigger on the break of the H4 bearish pin-bar formation low (1.4282), and then look to position stops above 1.43 (this will help avoid being stopped out on a fakeout).
Data points to consider today: UK inflation data; FOMC members Dudley and Quarles speak.
AUD/USD:
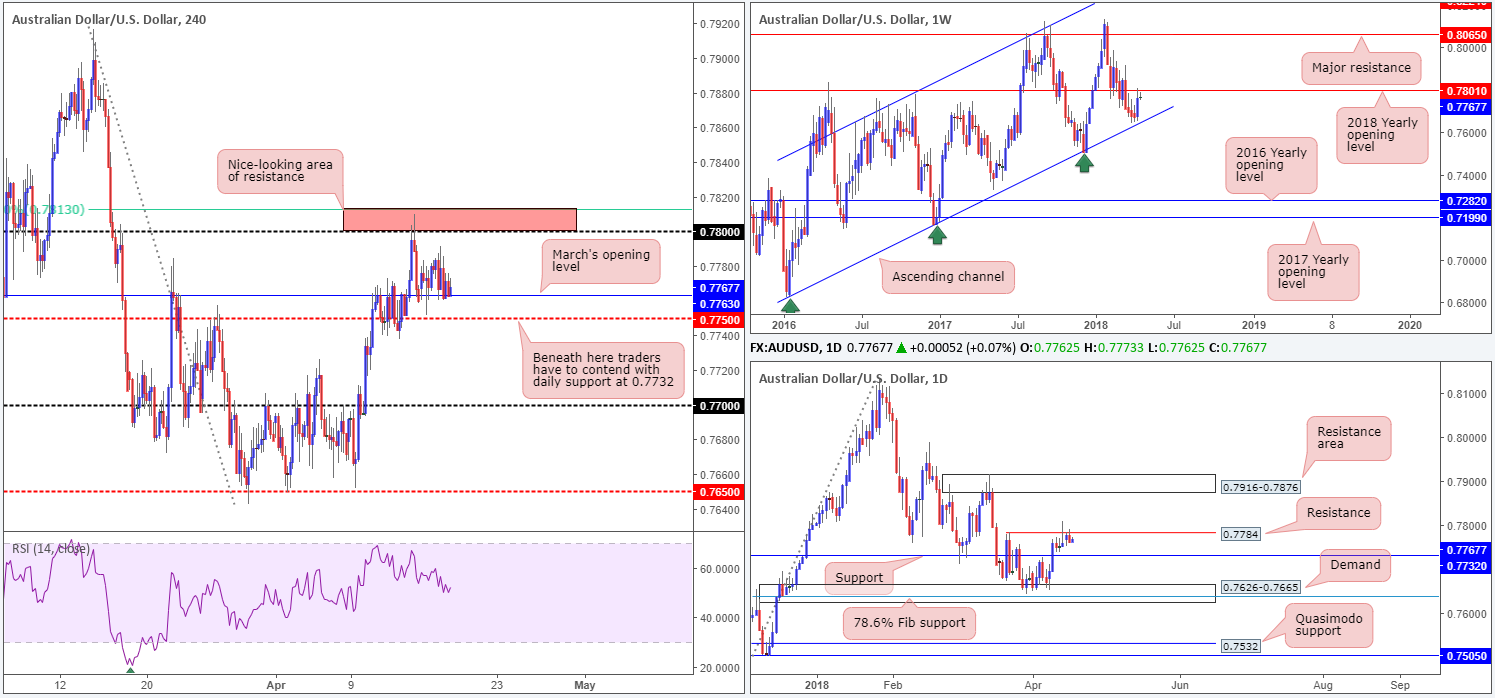
Although the commodity currency wrapped up Tuesday’s session marginally in the red, technical structure remains unchanged. Weekly movement continues to flirt sub 0.7801: a 2018 yearly opening line, while daily action is finding it a challenge to overcome nearby daily resistance located at 0.7784.
Meanwhile, over on the H4 timeframe, March’s opening level at 0.7763 remains in the fight, bolstering this market since Friday. Also still in view is the 0.7813/0.78 (61.8% H4 Fib resistance/round number) H4 resistance area.
Potential trading zones:
The current 2018 yearly opening level seen on the weekly timeframe, coupled with daily resistance at 0.7784, will likely be difficult numbers to breach, without any meaningful fundamental driver. With that in mind, intraday sellers’ crosshairs are still likely fixed on the H4 area 0.7813/0.78 for shorts. As this area has already rejected price once already, though, orders may therefore be weak. As such, waiting for additional candle confirmation in the shape of a H4 full or near-full-bodied bearish formation is advised before pulling the trigger.
Should H4 price fail to reach 0.7813/0.78, traders may then look for a H4 close beneath the H4 mid-level support at 0.7750. While this would be considered a bearish cue, caution is warranted since 18 pips lower sits a daily support level at 0.7732! That does not leave a lot of wiggle room.
Data points to consider today: FOMC members Dudley and Quarles speak.
USD/JPY:
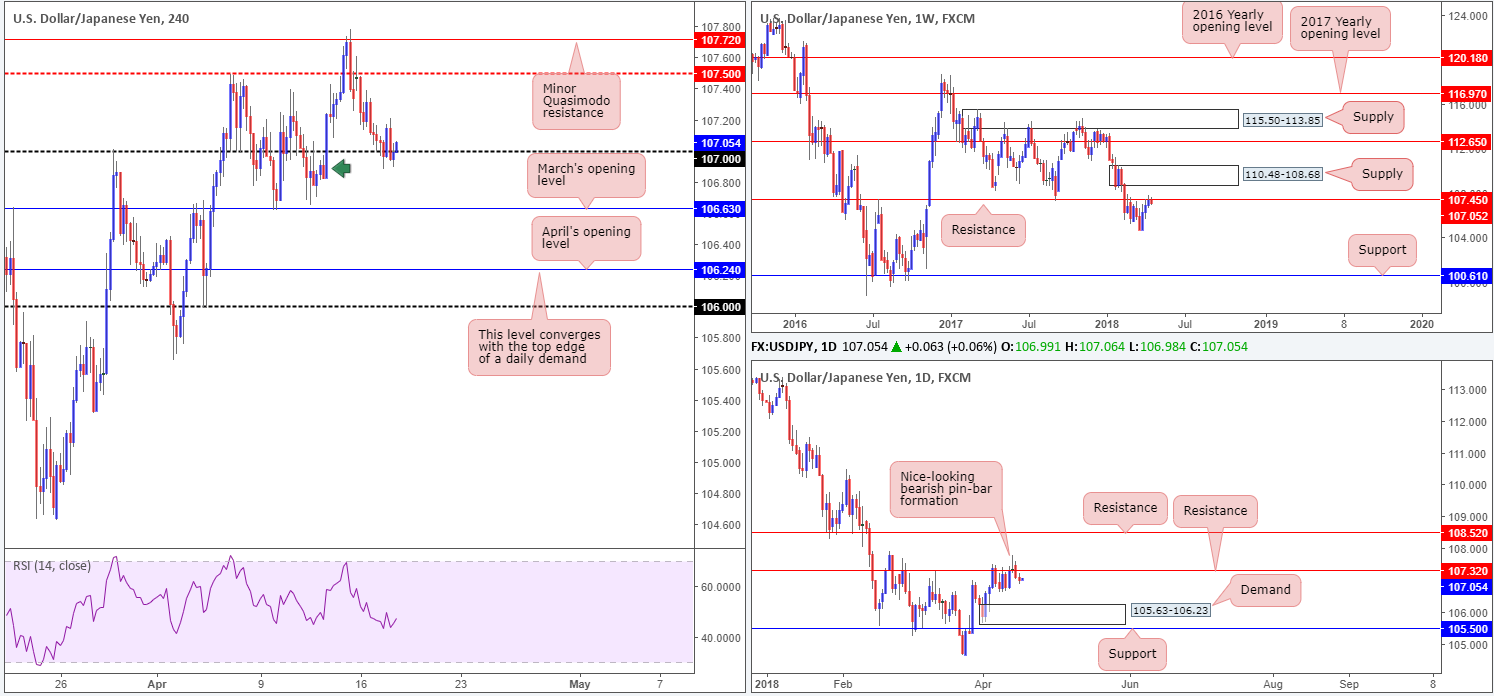
Market action was relatively sedated on Tuesday, with the USD/JPY seen oscillating around the 107 handle on the H4 timeframe. Beneath this value, we see potential support in the form of March’s opening level at 106.63, shadowed closely by April’s opening level plotted at 106.24.
106.24, as denoted on the H4 chart, represents the top edge of a daily demand base coming in at 105.63-106.23. This is the next downside target on the daily scale after price formed a nice-looking daily bearish pin-bar formation around daily resistance at 107.32. Turning the focus up to weekly structure, we can also see resistance at 107.45 currently in play. This level, as you can see, boasts a reasonably robust history and therefore could eventually force price action lower.
Potential trading zones:
To our way of seeing things, 107 appears a somewhat fragile level and is surviving due to a nearby H4 demand seen marked with a green arrow at 106.82-106.91. Despite this factor, we feel overhead resistance on the higher timeframes will eventually pressure this market lower, at least until we connect with daily demand mentioned above at 105.63-106.23 (essentially placing April’s opening level at 106.24 on the H4 timeframe as the next downside target beyond 107).
To take advantage of this potential downside move, we would recommend waiting for a H4 close beneath 107 and a subsequent retest as resistance in the shape of a full or near-full-bodied H4 bearish candle. This would, in our technical book, be enough evidence to suggest a short, targeting 106.24.
Data points to consider today: FOMC members Dudley and Quarles speak.
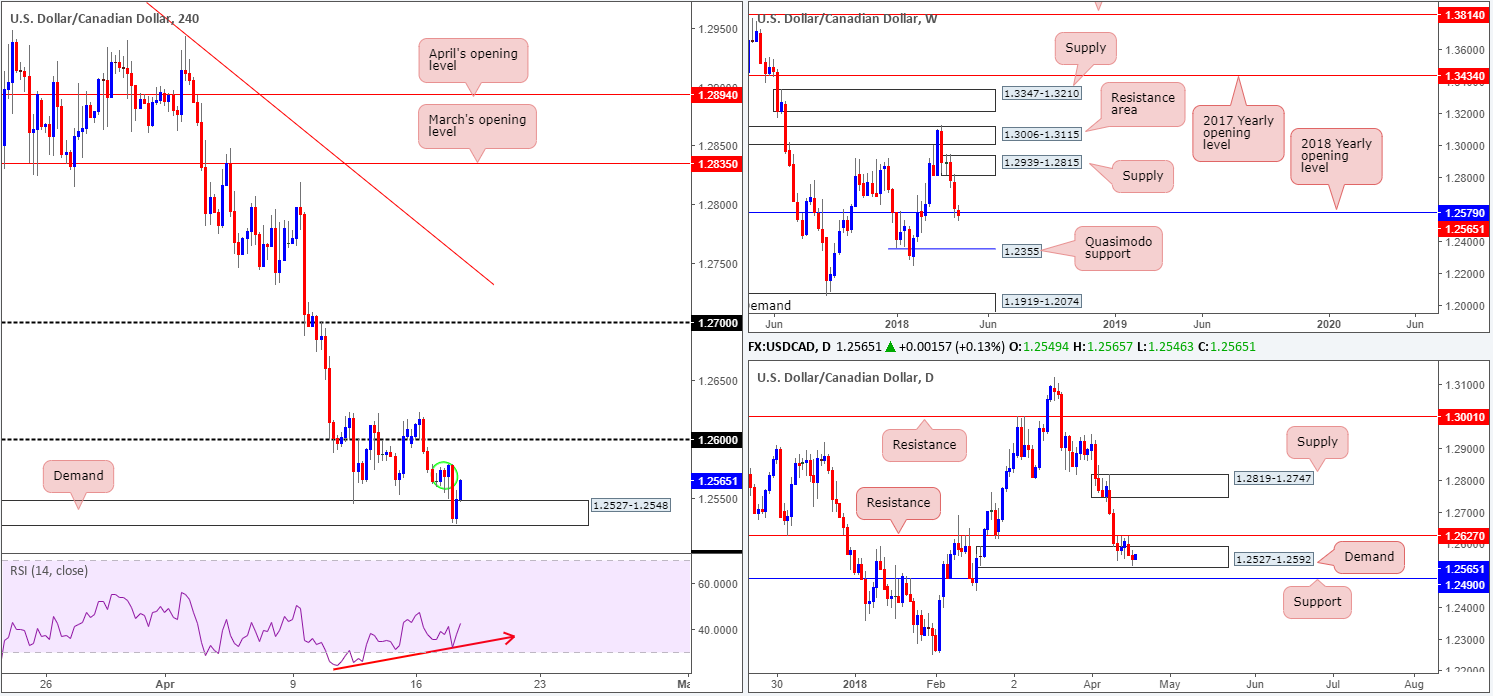
USD/CAD:
The Canadian dollar maintained its bullish trajectory on Tuesday, breaking through Mar 11 lows at 1.2544 and testing H4 demand at 1.2527-1.2548, which, as you can see, has offered support to the market. Although the H4 RSI indicates rather attractive bullish divergence in motion, we’re expecting active sellers to make an appearance at nearby H4 supply circled in green at 1.2578-1.2562.
Daily resistance at 1.2627 continues to hold ground, pressuring nearby daily demand at 1.2527-1.2592. A break of this area would almost immediately place the unit within striking distance of a daily support level at 1.2490. Elsewhere, however, weekly price continues to tease a rather interesting base of support at 1.2579: the 2018 yearly opening level. As of yet, though, we have yet to witness anything meaningful in terms of bullish intent.
Potential trading zones:
With the next big event looming in the form of the BoC policy meeting later today, although no changes are expected given ongoing NAFTA/global trade uncertainty, trading this market technically is likely to be a challenge. Not only because of potential BoC movement, but also due to opposing technical structure.
Although we still believe weekly price exhibits potential to drive higher, this is a chancy market to buy right now. To confirm upside, a DAILY close beyond the daily resistance level mentioned above at 1.2627 needs to take place. At that point, the next upside target on the H4 timeframe would sit at 1.27, followed then by the underside of a daily supply area at 1.2819-1.2747.
To the downside, selling is just as challenging. A break of the current H4 demand will also clear the lower edge of its partner daily demand at 1.2527-1.2592, but, as already highlighted above, immediately open up the path south to daily support pegged at 1.2490! Therefore, until 1.2490 is consumed, downside is also restricted, in our opinion.
Data points to consider today: FOMC members Dudley and Quarles speak; BoC monetary policy report, rate statement and overnight rate decision; Crude oil inventories; BoC press conference.
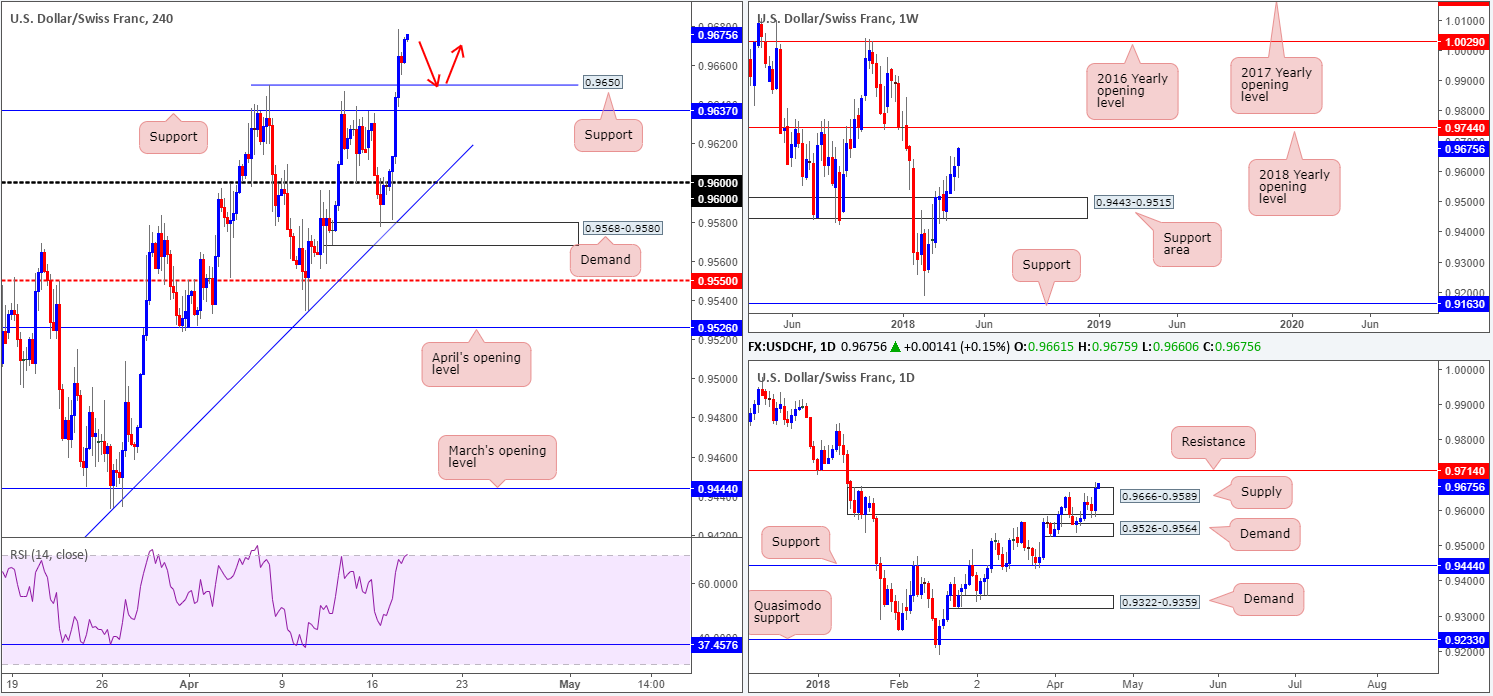
USD/CHF:
As the EUR/USD plunged to lower prices after faking through 1.24, it was of little surprise to see the USD/CHF market advance to higher ground during Tuesday’s segment. As is shown on the H4 timeframe, the pair aggressively spiked through orders at 0.96 – just missing the top edge of a H4 demand base at 0.9568-0.9580 with an intersecting H4 trend line support taken from the low 0.9187 – and wiped out H4 resistance at 0.9637 (now acting support). The next port of call on the H4 timeframe can be seen in the form of a psychological round number at 0.97.
Turning over a page to the higher timeframes, however, we can see daily price recently breached the top edge of a daily supply at 0.9666-0.9589, and has possibly cleared upside to a nearby daily resistance at 0.9714. Meanwhile, weekly price continues to reflect a relatively strong bullish position. According to weekly structure, further buying is entirely possible this week since there’s room for the unit to punch as high as the 2018 yearly opening level at 0.9744.
Potential trading zones:
With all three timeframes exhibiting potential to move higher, the team has noted to keep a watchful eye on 0.9650 on the H4 timeframe. Not only is this considered a support level, it is also registered as a mid-level psychological barrier. Should this line fail to hold price, however, a little lower on the curve is a H4 support level at 0.9637, which will likely lend a helping hand. Targets from 0.9637/0.9650 fall in at 0.97, followed by daily resistance at 0.9714 and then the weekly 2018 yearly opening level at 0.9744.
Data points to consider today: FOMC members Dudley and Quarles speak.
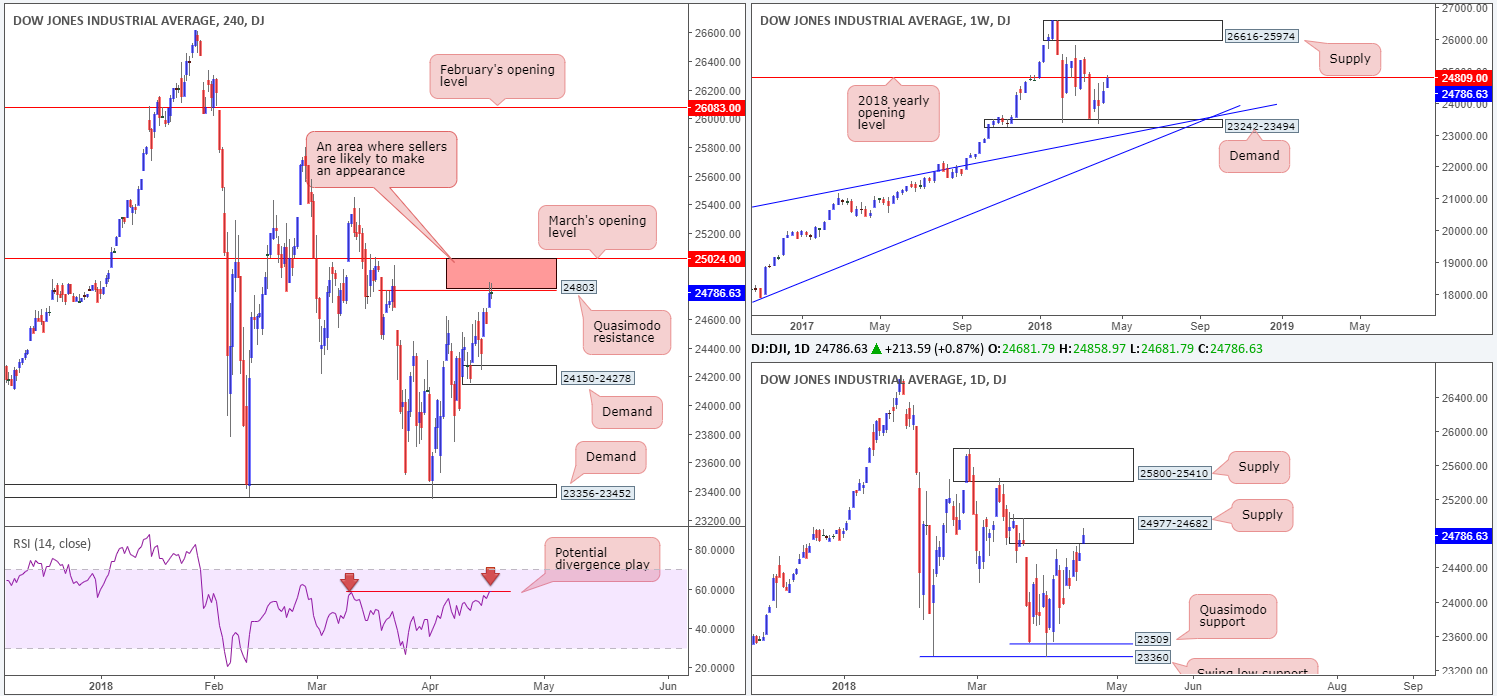
DOW 30:
IBM, Netflix and Goldman Sachs beat earning’s expectations in the first quarter of 2018. The three main US equity indexes lifted higher on Tuesday after recent earnings, pushing aside concerns over China, Russia and Syria.
Coming at you from the top this morning, weekly price recently crossed swords with the 2018 yearly opening level at 24809. These levels, on average, produce a bounce, so we could possibly see a downward move form from here. In conjunction with weekly movement, daily action is seen trading within the walls of a daily supply zone priced in at 24977-24682, which happens to house the aforementioned 2018 yearly open line. Over on the H4 timeframe, we can also see that price recently entered 25024/24803. A H4 resistance area marked in red comprised of March’s opening level and a H4 Quasimodo resistance. In addition to this, the H4 RSI indicator is currently displaying bearish divergence.
Potential trading zones:
The H4 resistance area at 25024/24803 remains of interest, given it encapsulates the 2018 yearly open line and has a connection to the current daily supply. In the event that a H4 bearish rotation candle forms (preferably in the shape of a full or near-full-bodied formation), a short from here is considered high probability, with an initial downside target set at the H4 demand base logged in at 24150-24278.
Data points to consider today: FOMC members Dudley and Quarles speak.
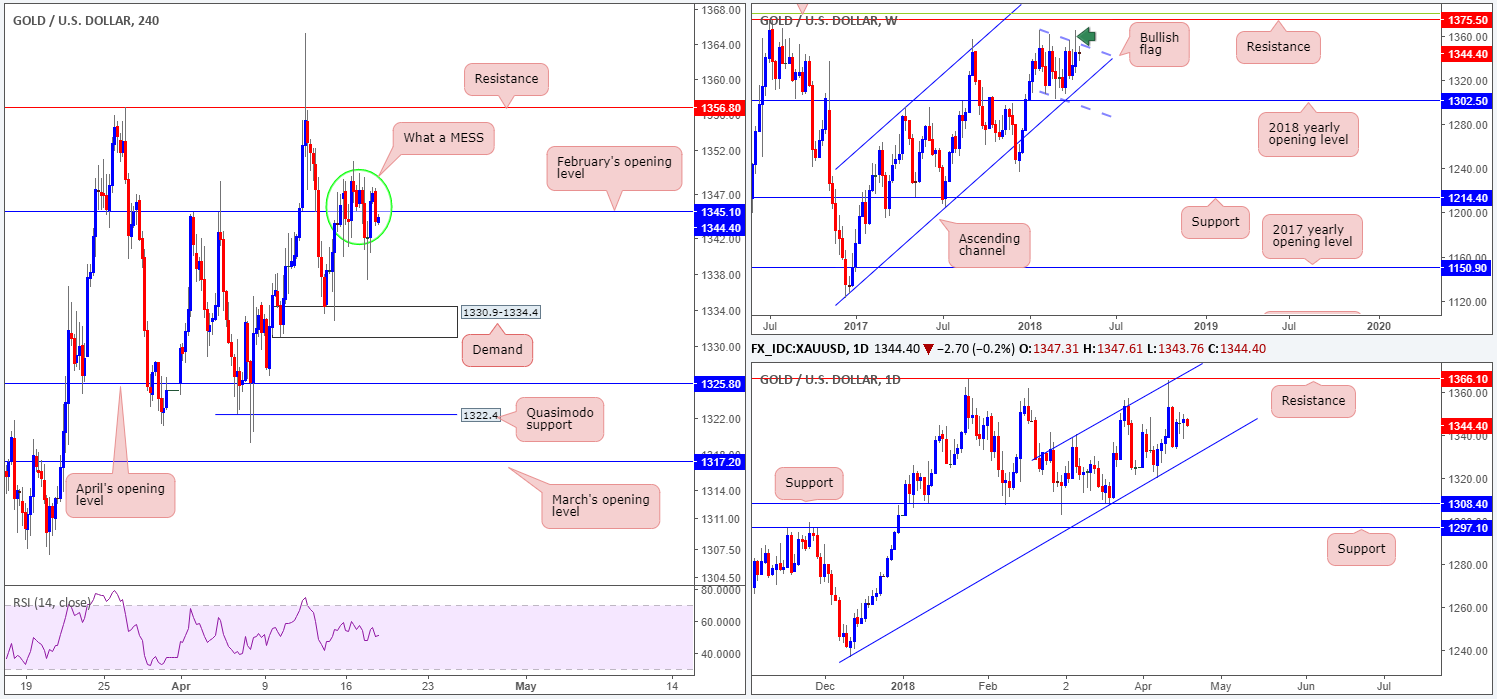
GOLD:
Since Friday, the price of gold has somewhat stagnated, largely oscillating around February’s opening level on the H4 timeframe at 1345.1. Above this number, apart from intraday tops seen at 1349.5ish, there’s a H4 resistance level at 1356.8 to target. To the downside, nevertheless, H4 demand at 1330.9-1334.4 remains the next port of call.
Seeing as how there’s been very little price movement over the last few days, higher-timeframe structure remains unchanged, in our view. Weekly price, as highlighted in Monday’s report, continues to compress within a bullish flag formation (1366.0/1307.2), positioned just ahead of the 2018 yearly opening level at 1302.5 (fuses closely with a long-term weekly channel support etched from the low 1122.8). A bullish breakout here has the weekly resistance level at 1375.5 to target. Turning over a page to the daily timeframe, it’s clear to see that the yellow metal has spent over a month compressing within an ascending channel. The channel support is taken from the low 1236.6, while the channel resistance is extended from the high 1340.5. On the whole, though, we see potential for this market to jolt either way within this formation.
Potential trading zones:
Intraday traders will likely want to keep tabs on H4 demand mentioned above at 1330.9-1334.4 for potential longs, and likewise, H4 resistance at 1356.8 for possible shorting opportunities.
On the bigger picture, sellers are likely weak around the top edge of the current weekly bullish flag, given last week’s breach seen marked with a green circle. As of yet, though, little attempt has been made to push higher. Before this occurs, traders may want to prepare themselves for a test of the noted daily channel support. Should this come to fruition, intraday traders at the current H4 demand will likely experience a fakeout, due to the area being positioned just north of the daily channel support. Therefore, do keep this in mind!
This site has been designed for informational and educational purposes only and does not constitute an offer to sell nor a solicitation of an offer to buy any products which may be referenced upon the site. The services and information provided through this site are for personal, non-commercial, educational use and display. IC Markets does not provide personal trading advice through this site and does not represent that the products or services discussed are suitable for any trader. Traders are advised not to rely on any information contained in the site in the process of making a fully informed decision.
This site may include market analysis. All ideas, opinions, and/or forecasts, expressed or implied herein, information, charts or examples contained in the lessons, are for informational and educational purposes only and should not be construed as a recommendation to invest, trade, and/or speculate in the markets. Any trades, and/or speculations made in light of the ideas, opinions, and/or forecasts, expressed or implied herein, are committed at your own risk, financial or otherwise.
The use of the site is agreement that the site is for informational and educational purposes only and does not constitute advice in any form in the furtherance of any trade or trading decisions.
The accuracy, completeness and timeliness of the information contained on this site cannot be guaranteed. IC Markets does not warranty, guarantee or make any representations, or assume any liability with regard to financial results based on the use of the information in the site.
News, views, opinions, recommendations and other information obtained from sources outside of www.icmarkets.com.au, used in this site are believed to be reliable, but we cannot guarantee their accuracy or completeness. All such information is subject to change at any time without notice. IC Markets assumes no responsibility for the content of any linked site. The fact that such links may exist does not indicate approval or endorsement of any material contained on any linked site.
IC Markets is not liable for any harm caused by the transmission, through accessing the services or information on this site, of a computer virus, or other computer code or programming device that might be used to access, delete, damage, disable, disrupt or otherwise impede in any manner, the operation of the site or of any user’s software, hardware, data or property.


