
A note on lower timeframe confirming price action…
Waiting for lower timeframe confirmation is our main tool to confirm strength within higher timeframe zones, and has really been the key to our trading success. It takes a little time to understand the subtle nuances, however, as each trade is never the same, but once you master the rhythm so to speak, you will be saved from countless unnecessary losing trades. The following is a list of what we look for:
- A break/retest of supply or demand dependent on which way you’re trading.
- A trendline break/retest.
- Buying/selling tails – essentially we look for a cluster of very obvious spikes off of lower timeframe support and resistance levels within the higher timeframe zone.
- Candlestick patterns. We tend to only stick with pin bars and engulfing bars as these have proven to be the most effective.
For us, lower timeframe confirmation starts on the M15 and finishes up on the H1, since most of our higher timeframe areas begin with the H4. Stops usually placed 5-10 pips beyond your confirming structures.
EUR/USD:
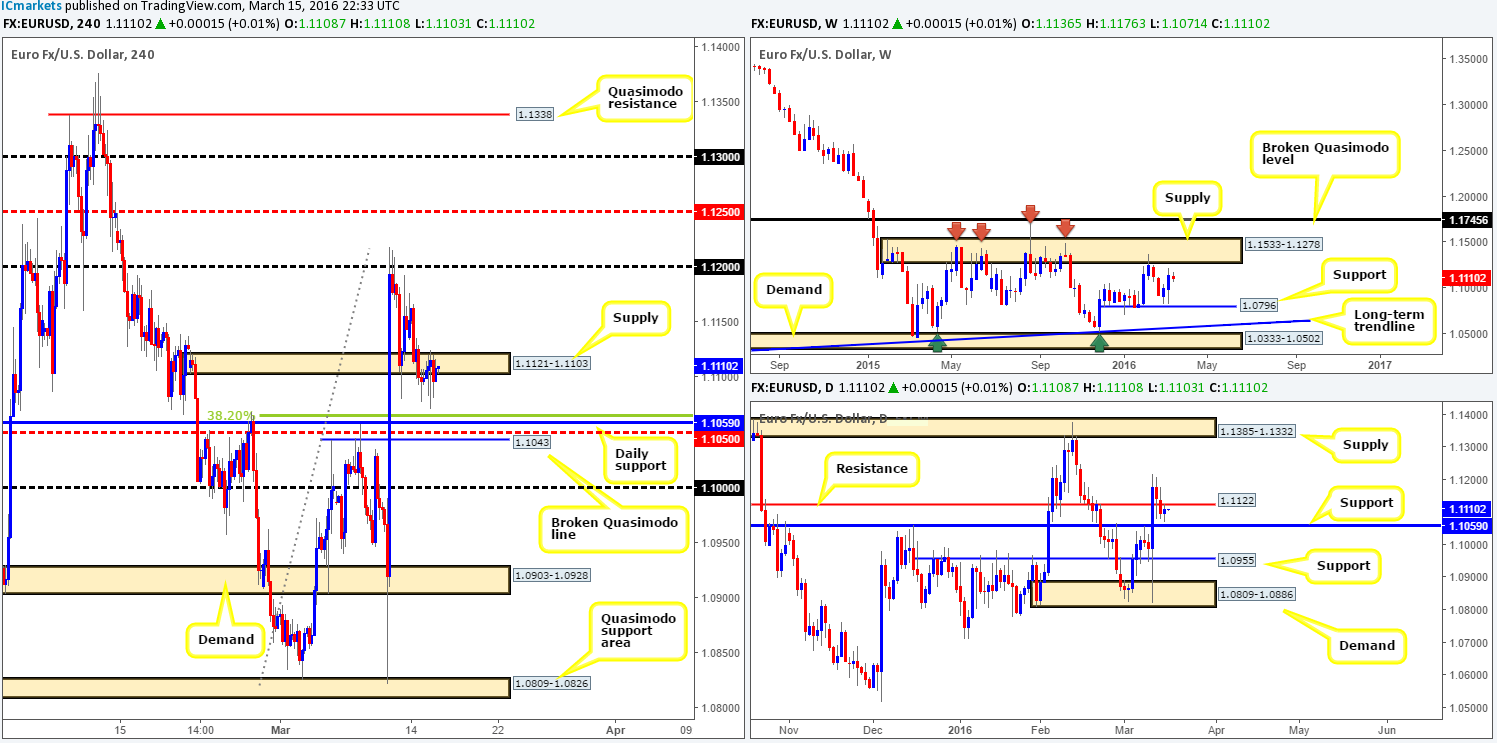
Following Monday’s push below H4 demand at 1.1121-1.1103, the EUR/USD spent much of yesterday consolidating around the underside of this zone as supply (converges with daily resistance at 1.1122). In light of this rather mellow price action, all eyes remain on the daily support barrier we discussed yesterday at 1.1059.
The 1.1059 daily level is quite notable from a technical perspective on the H4 chart: a 38.2% Fibonacci level at 1.1065, a mid-level support at 1.1050 and a broken Quasimodo line at 1.1043 all converge around this barrier. In addition to this confluence, we like the fact that weekly price has yet to reach supply at 1.1533-1.1278, suggesting the single currency still has room to the upside.
Therefore, the 1.1065/1.1043 H4 area is our pre-determined buy zone going into today’s sessions. We would, however, prefer to see a lower timeframe buy setup form within this region before entering into a buy position here for two reasons. Firstly, the FOMC is set to take the stage today which could potentially cause ripples in this market. Secondly, the rather large psychological support sitting just below at 1.1000 may act as a magnet for price thus pushing the EUR below our buy zone. Nevertheless, should all go to plan and we manage to pin down a position within the above said H4 area, we’d look to target the H4 supply at 1.1121-1.1103 as our first take-profit zone.
Levels to watch/live orders:
- Buys: 1.1065/1.1043 [Tentative – confirmation required] (Stop loss: dependent on where one confirms this area).
- Sells: Flat (Stop loss: N/A).
GBP/USD:
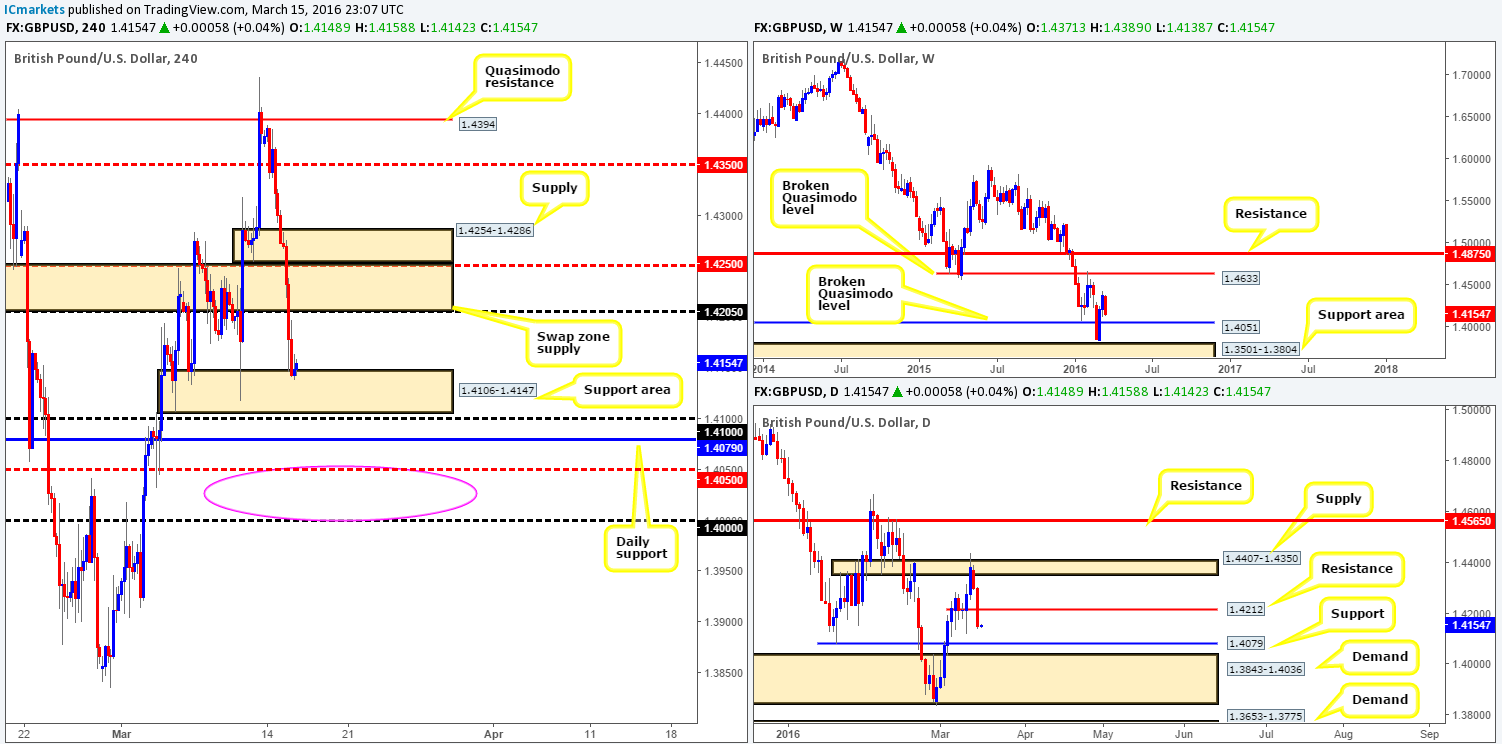
Based on recent H4 price action, we can see that strong sellers stepped in from the word go yesterday, consequently demolishing H4 demand (now acting supply) at 1.4254-1.4286 as well as the H4 swap zone below at 1.4200/1.4250. As you can see, the day ended with Cable driving into a H4 support area at 1.4106-1.4147, which for the time being is holding firm. Brexit concerns clearly played a big part in the recent down move as more and more voters are swaying toward the ‘leave’ camp.
Going forward, here is our take on current structure. Up on the weekly, the Pound is seen trading within a stone’s throw away from a broken Quasimodo line at 1.4051. Similar to the weekly chart, daily action is also lurking close to support found at 1.4079, followed closely by a rather large demand at 1.3843-1.4036. In view of this, we’ll pass on looking for buys around the current H4 demand as higher-timeframe sellers may pressure this market lower. At this point, the only area we’d consider a viable base in which to look for (lower timeframe confirmed) opportunities today would be between the mid-level barrier 1.4050 and the large figure 1.4000 (pink circle) due to its connection with the higher-timeframe picture (see above in bold).
Levels to watch/live orders:
- Buys: 1.4000/1.4050 [Tentative – confirmation required] (Stop loss: dependent on where one confirms this area).
- Sells: Flat (Stop loss: N/A).
AUD/USD:
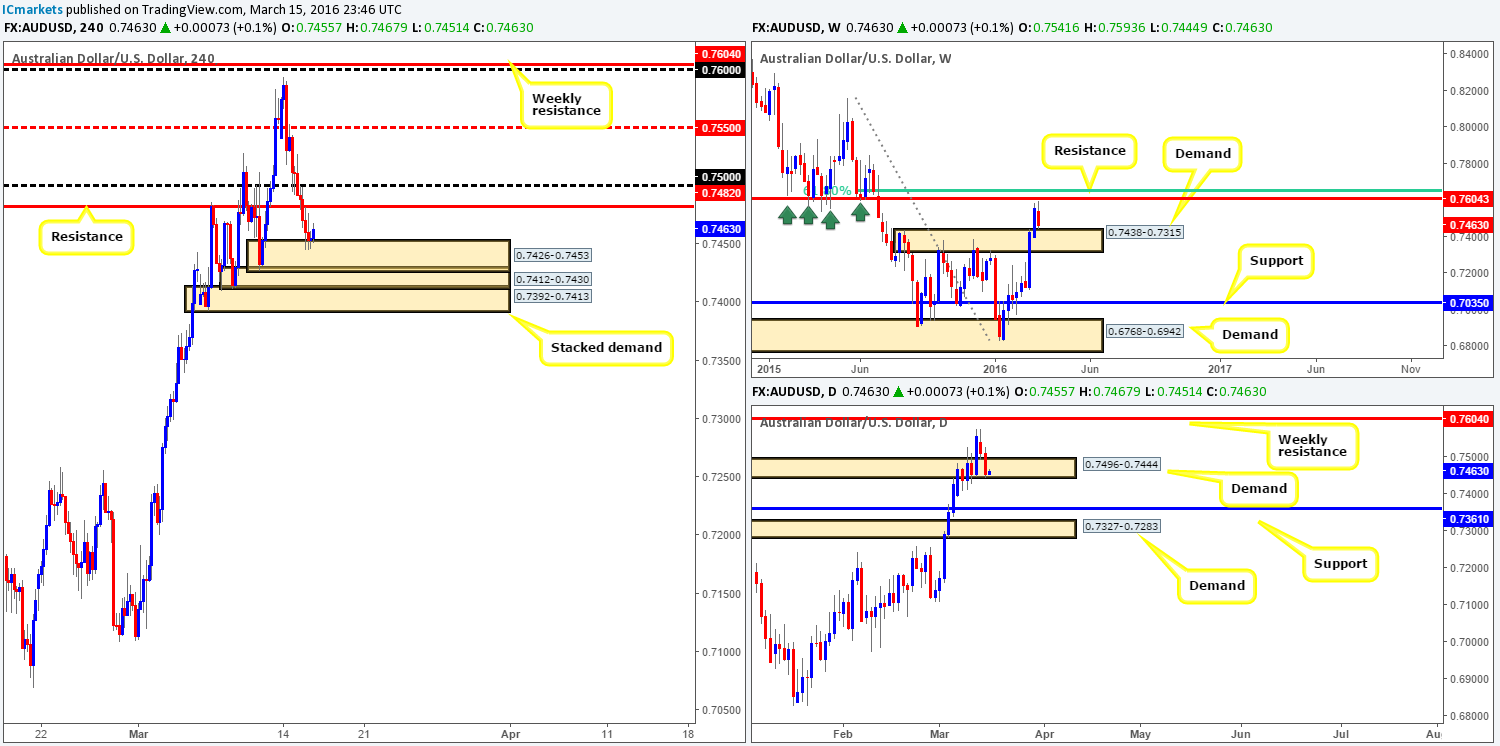
The commodity currency took another hit to the mid-section yesterday, resulting in price taking out H4 support (now acting resistance) at 0.7482 and colliding with a H4 demand zone penciled in at 0.7426-0.7453 (upper layer of a stacked demand formation). Not only this, but over on the weekly chart the Aussie also connected with a demand area coming in at 0.7438-0.7315, as well as daily price now trading within the extremes of demand drawn from 0.7496-0.7444.
Although there is clear structure present on this pair, it’s still difficult to trade as far as we can see. On the one hand, looking to buy from the current H4 demand seems viable, but considering H4 resistance is looming just above at 0.7482, we’d pass here. That being said, however, there is a possible buy opportunity at the extreme demand zone within the H4 stacked formation at 0.7392-0.7413 (we’ve found price usually tags the extreme zones within stacked areas before any real movement is seen). However, by entering long from here, you’d be going up against the weekly trend and also sellers from the MAJOR weekly resistance hurdle chalked up at 0.7604.
As for selling, shorts could be possible if price closes below the current daily demand as daily support at 0.7361 would then be in the firing range. Nevertheless, this would involve selling into the H4 stacked demand, and also the current weekly demand.
Given the points made, we see no clear path for price to run today, leaving our team little choice but to remain flat going into today’s sessions.
Levels to watch/live orders:
- Buys: Flat (Stop loss: N/A).
- Sells: Flat (Stop loss: N/A).
USD/JPY:
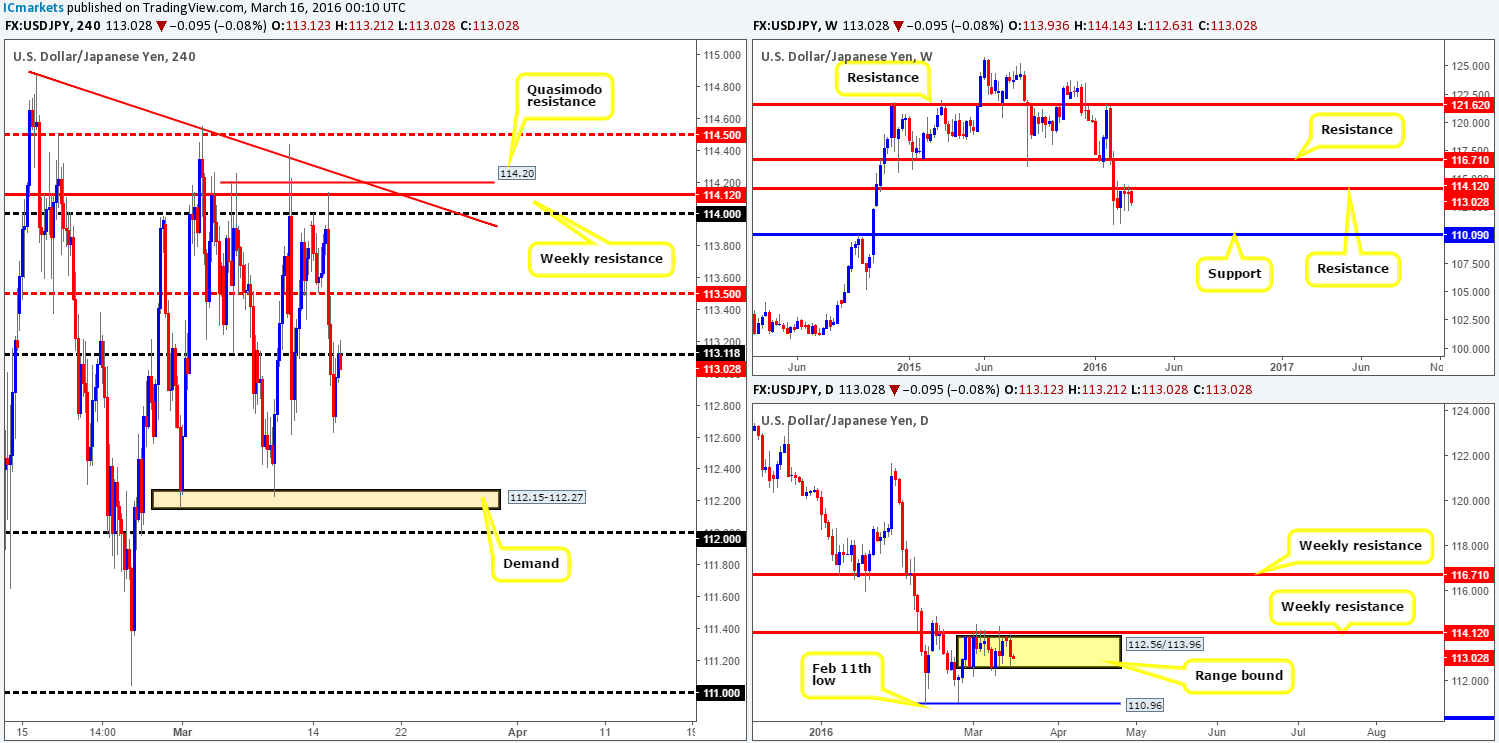
Reporting from the weekly chart this morning we can see that price is selling off from the underside of a weekly resistance barrier at 114.12. As we’ve pointed out in recent reports, if the sellers continue to dominate here the support level at 110.09 would be the next target to achieve.
Down on the daily chart, however, the pair remains confined between 112.56/113.96. A violation of the lower limits of this consolidation likely opens the doors for a potential move down to the 110.96 region (the Feb 11th low), which is all that stands in the way of a move down to the weekly support mentioned above at 110.09.
For those who have been following our past reports, we spoke on several occasions about the Quasimodo resistance line at 114.20 and the 114.00 figure being a very nice-looking sell zone. Reason being is in between here sits the weekly resistance level at 114.12 and a converging trendline extended from the high 114.87. As you can see, price responded beautifully from here yesterday and went on to reach lows of 112.63 on the day. Well done to any of our readers who took advantage of this move.
Pushing forward, the 113.00 figure is currently being retested as resistance and holding strong, which means further selling may be in store today down to H4 demand at 112.15-112.27. However, we would advise only entering short from here alongside a lower timeframe sell setup since price has recently rebounded from the lower limits of the daily range discussed above.
Levels to watch/live orders:
- Buys: Flat (Stop loss: N/A).
- Sells: 113.00 region [Tentative – confirmation required] (Stop loss: dependent on where one confirms this area).
USD/CAD:
Going into the yesterday’s London open the Loonie exploded north, quickly consuming the 1.3300 figure along with 1.3350 before finally stabilizing at 1.3400 for the remainder of the day. In view of price now retesting the 1.3350 level as support, where do we go from here? Well, over on the weekly chart, resistance drawn from 1.3381 has been brought into the action. This level provided reasonable resistance back in late 2015, so the expectation is for price to repeat itself here. Climbing down into the daily chart, it’s clear to see that the recently broken demand (now supply) at 1.3293-1.3396 remains in play for now despite the USD/CAD advancing north for the past two days.
Due to the higher-timeframe picture presently hugging sell zones at the moment, the 1.3350 level on the H4 is likely to cave in sometime today. For us to be given the green light to short following a break lower, nonetheless, price would need to retest this level as resistance together with a lower timeframe (confirmation) sell signal (see the top of this page for confirming patterns). The first take-profit target, should this trade come to fruition, would be the 1.3300 figure, followed closely by the mid-level number 1.3250. On a side note, traders want to be extra careful here today due to the heavy round of high-impacting news events on the docket!
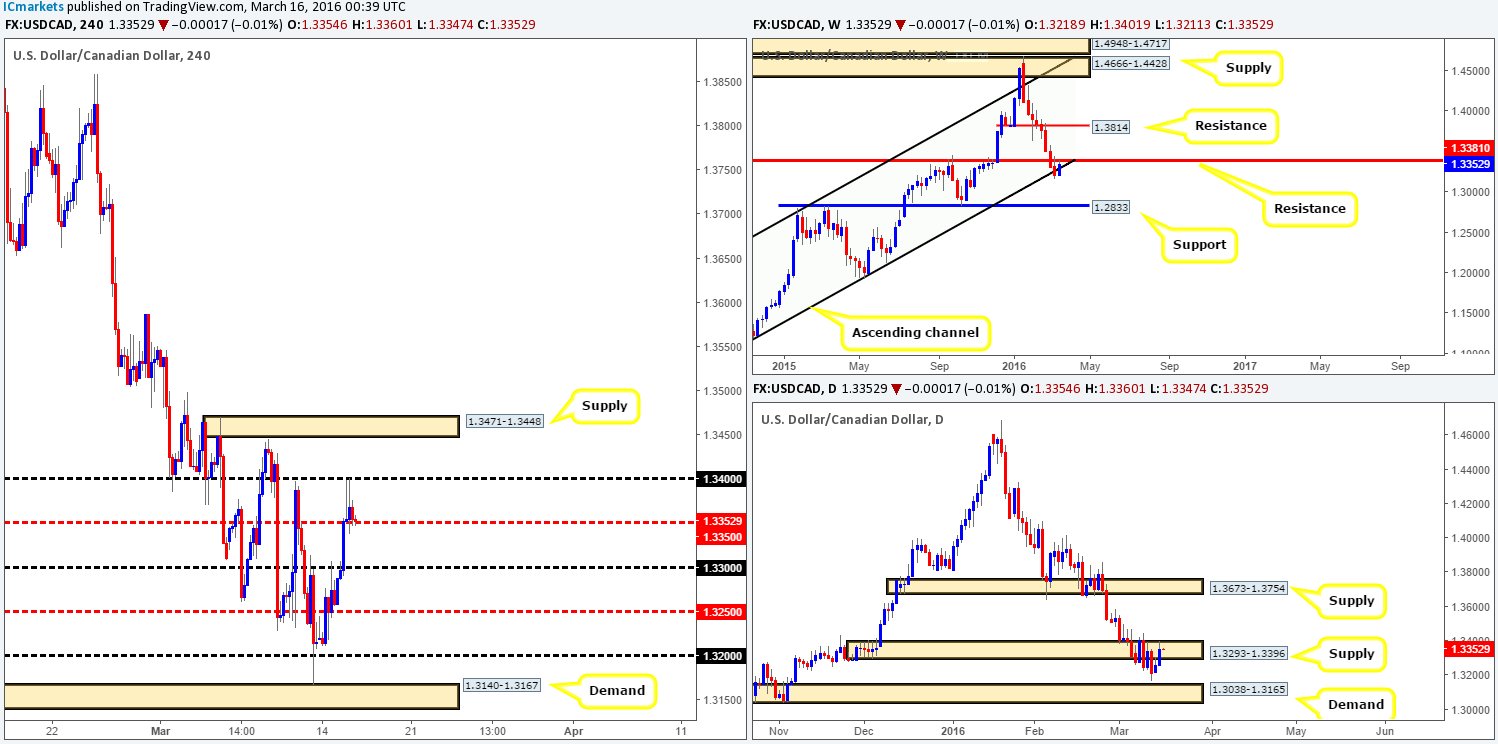
Levels to watch/live orders:
- Buys: Flat (Stop loss: N/A).
- Sells: Watch for price to consume 1.3350 and look to trade any retest seen thereafter (lower timeframe confirmation required).
USD/CHF:
Mirroring the EUR/USD, the USD/CHF also saw rather subdued price action during yesterday’s trading. The pair ranged a mere forty pips resulting in a collection of H4 selling wicks being printed at the underside of daily resistance at 0.9885. Owing to recent movement our outlook for this pair remains unchanged…
As far as we’re concerned the H4 chart continues to trade within a consolidation zone fixed between two daily structures. Support comes in at 0.9822 and resistance can be found at 0.9885. Beyond this range sits two psychological numbers: 0.9800 and 0.9900, and both are likely to see a reaction should price fake the aforementioned daily levels.
Instead of looking to trade between this range, we’re more attracted to the areas beyond here. Above 0.9900, there looks to be a clear run up to parity which could make for a nice long trade should 0.9900 be taken out and retested as support. Looking below, however, there appears to be limited downside potential. Just beneath 0.9800 sits a H4 demand area at 0.9749-0.9781 which will likely hold price higher should it see action. Not only does this zone fuse with a 78.6% Fibonacci level at 0.9754, but it’s also bolstered by the weekly trendline extended from the low 0.9071. However, as highlighted in Monday’s report, even though trendlines are effective at predicting turning points, they are unfortunately prone to some very nasty fakeouts. As such, once or indeed if price reaches the aforementioned H4 demand zone this week, we will only consider this a viable buy zone should lower timeframe buying strength be seen
As we have already mentioned guys, do take extra care today in the markets as there’s a stacked docket ahead!
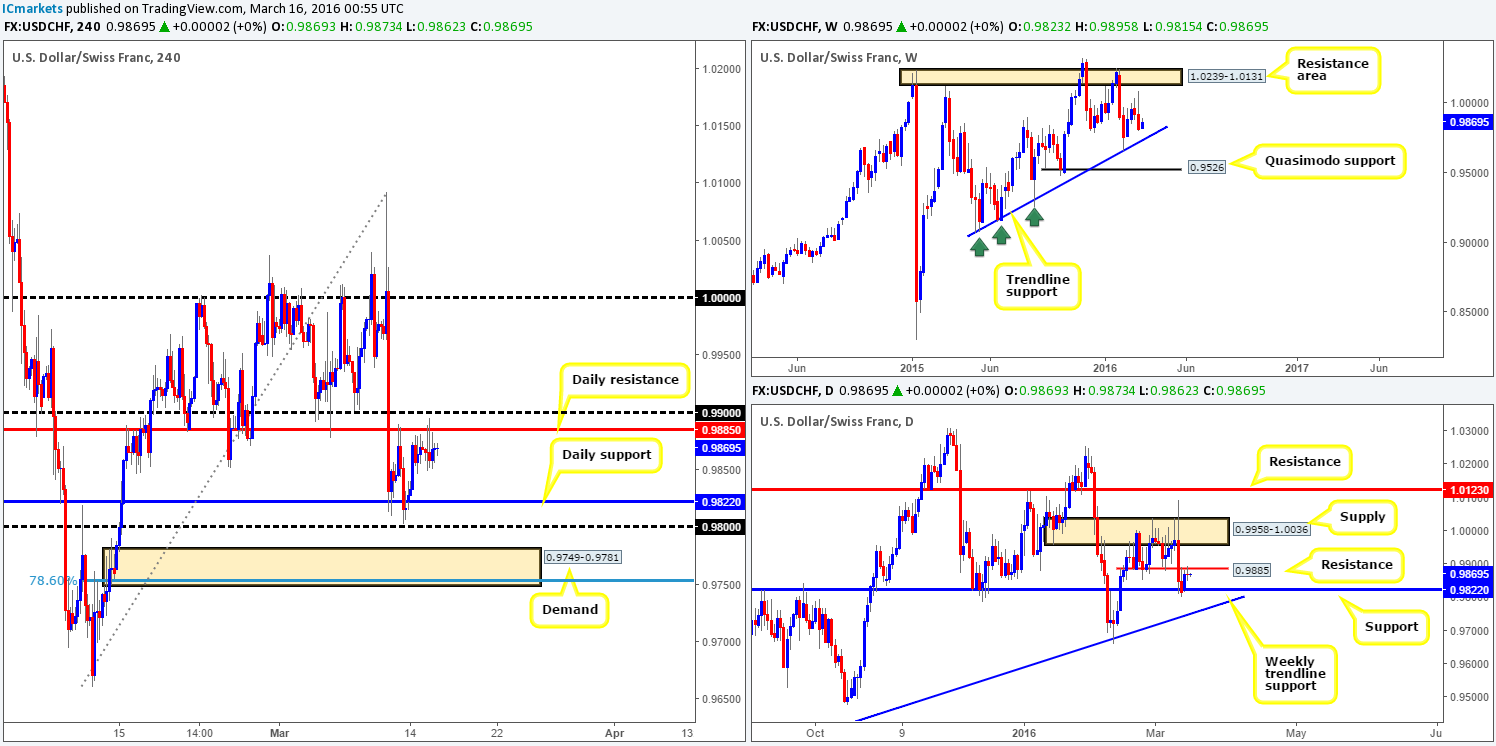
Levels to watch/live orders:
- Buys: 0.9749-0.9781 [Tentative – confirmation required] (Stop loss: dependent on where one confirms this area). Watch for price to consume the 0.9900 level and look to trade any retest seen thereafter (lower timeframe confirmation required).
- Sells: Flat (Stop loss: N/A).
DOW 30:
Yesterday’s stock market action was quite interesting! Monday’s low 17146 on the H4 chart suffered a small fakeout which shortly after saw the DOW rally to fresh highs of 17252 and close above H4 supply at 17244-17159. This, as you can see from the chart, formed a sturdy-looking Quasimodo support level around the 17146 region.
In addition to the above, a clear-cut daily buying tail was painted off the back of weekly support coming in at 17135, indicating that price is likely headed towards weekly supply chalked up at 17752-17552 (fuses with a weekly trendline extended from the high 18365).
Taking all of the above into consideration, our prime focus today will be on looking for lower timeframe buy setups around the H4 Quasimodo support level mentioned above at 17146 (see green arrows). At this point it’s a little difficult to give any definite targets as this will be dependent on the approach to our buy zone.
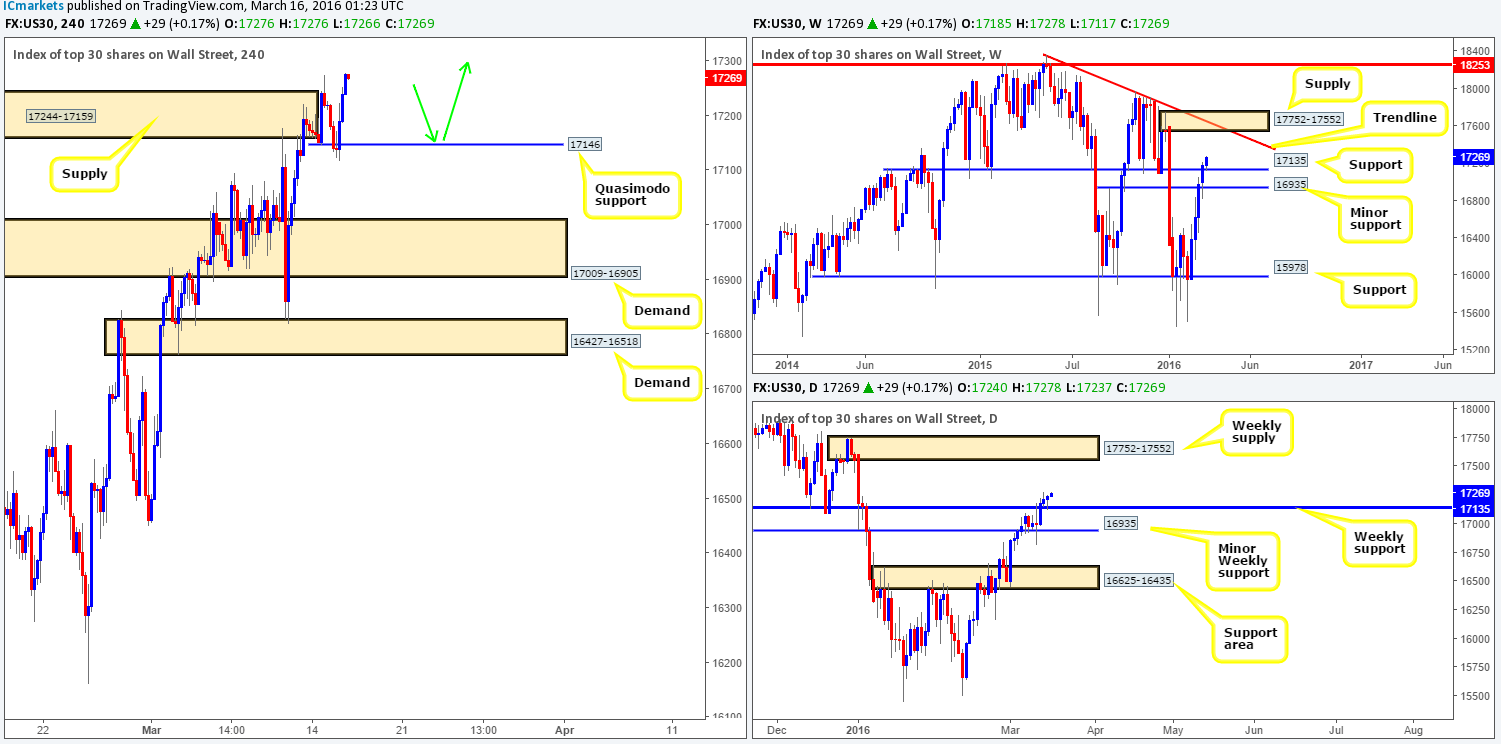
Levels to watch/live orders:
- Buys: 17146 region [Tentative – confirmation required] (Stop loss: dependent on where one confirms this area).
- Sells: Flat (Stop loss: N/A).
XAU/USD: (Gold)
Although Gold printed its third consecutive daily loss yesterday, price action saw a more mellow tone in comparison to Monday. H4 demand at 1224.6-1230.8 is currently capping the downside to this market, whilst H4 supply at 1237.2-1243.9 suppresses the upside.
In view of weekly action trading within touching distance of support painted at 1224.1, and daily price trading within demand at 1224.6-1238.3, shorting this market is not something we’d be comfortable with. In regards to buying the yellow metal today, here is what we have jotted down so far…
Not only is the current H4 demand area housed within the extremes of the above said daily demand zone, but it is also supported by the weekly support level mentioned above at 1224.1. However, considering that the weekly level sits just beneath the H4 demand, there is a high probability that a fakeout will take place before serious buyers step in. That being the case, our team has come to a general consensus that a long entry will only be permitted following a clear fakeout below the current H4 demand. This way we know a truckload of weekly buyers have potentially come into the market and well-funded traders on both the daily and H4 charts will be buying into the sell stops taken from beneath both the daily and H4 demand low 1224.6 (as per the green arrows). In the event that this trade comes to fruition, we’ll take partial profits at the newly-formed supply at 1237.2-1243.9 and then look to protect our position by reducing risk.
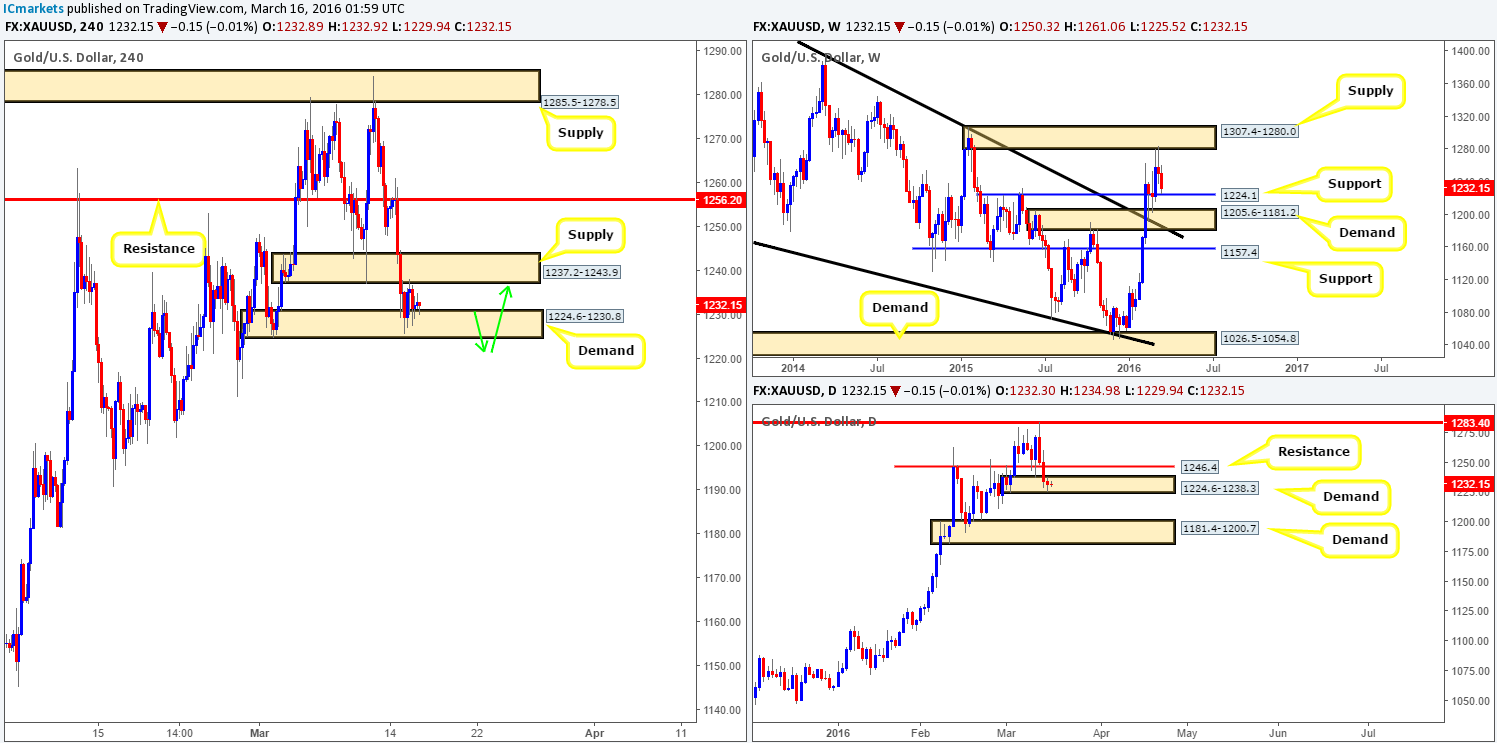
Levels to watch/live orders:
- Buys: 1224.6-1230.8 [Watch for a fakeout beneath this barrier before looking to go long] (Stop loss: dependent on how deep the fakeout is – ideally stops should be below the lowest low of that fakeout spike).
- Sells: Flat (Stop loss: N/A).


