
Waiting for lower timeframe confirmation is our main tool to confirm strength within higher timeframe zones, and has really been the key to our trading success. It takes a little time to understand the subtle nuances, however, as each trade is never the same, but once you master the rhythm so to speak, you will be saved from countless unnecessary losing trades. The following is a list of what we look for:
- A break/retest of supply or demand dependent on which way you’re trading.
- A trendline break/retest.
- Buying/selling tails/wicks – essentially we look for a cluster of very obvious spikes off of lower timeframe support and resistance levels within the higher timeframe zone.
We typically search for lower-timeframe confirmation between the M15 and H1 timeframes, since most of our higher-timeframe areas begin with the H4. Stops are usually placed 1-3 pips beyond confirming structures.
EUR/USD:
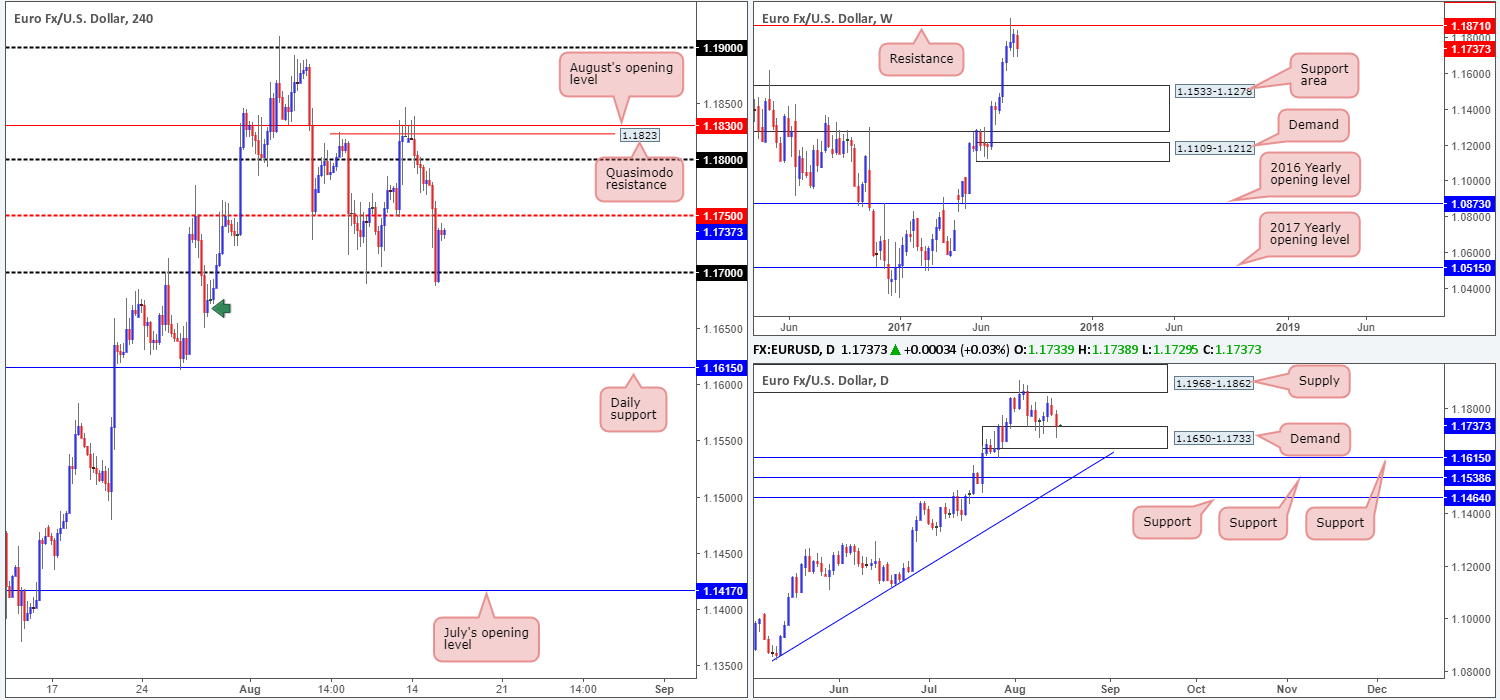
The EUR/USD experienced another wave of selling on Tuesday, exacerbated by a broad-based advance in US retail sales. The single currency did, however, recover some ground going into the US segment as price struck the 1.17 handle, together with a minor daily demand base coming in at 1.1650-1.1733. Closing just ahead of the H4 mid-level resistance at 1.1750, where does this leave us in terms of trading opportunities?
Buying above 1.1750 could be an option, but by doing so, we’d potentially be going up against weekly selling from the weekly resistance level planted at 1.1871!
What about a short below the 1.17 region? By selling sub 1.17, not only would you then be trading into daily buyers from the demand mentioned above, but you’d also be going up against possible buyers from the ‘hook’ shaped H4 demand marked with a green arrow at 1.1650-1.1664.
.Suggestions: Technically speaking, we do not see much to hang our hat on at the moment. No matter which direction we select to trade, there’s some form of higher-timeframe structure in the foreground. Therefore, we’ll remain on the sidelines for now and wait for further developments.
Data points to consider: EUR Flash GBP at 10am. US Housing numbers at 1.30pm, followed later by the FOMC meeting minutes at 7pm GMT+1.
Levels to watch/live orders:
- Buys: Flat (stop loss: N/A).
- Sells: Flat (stop loss: N/A).
GBP/USD:
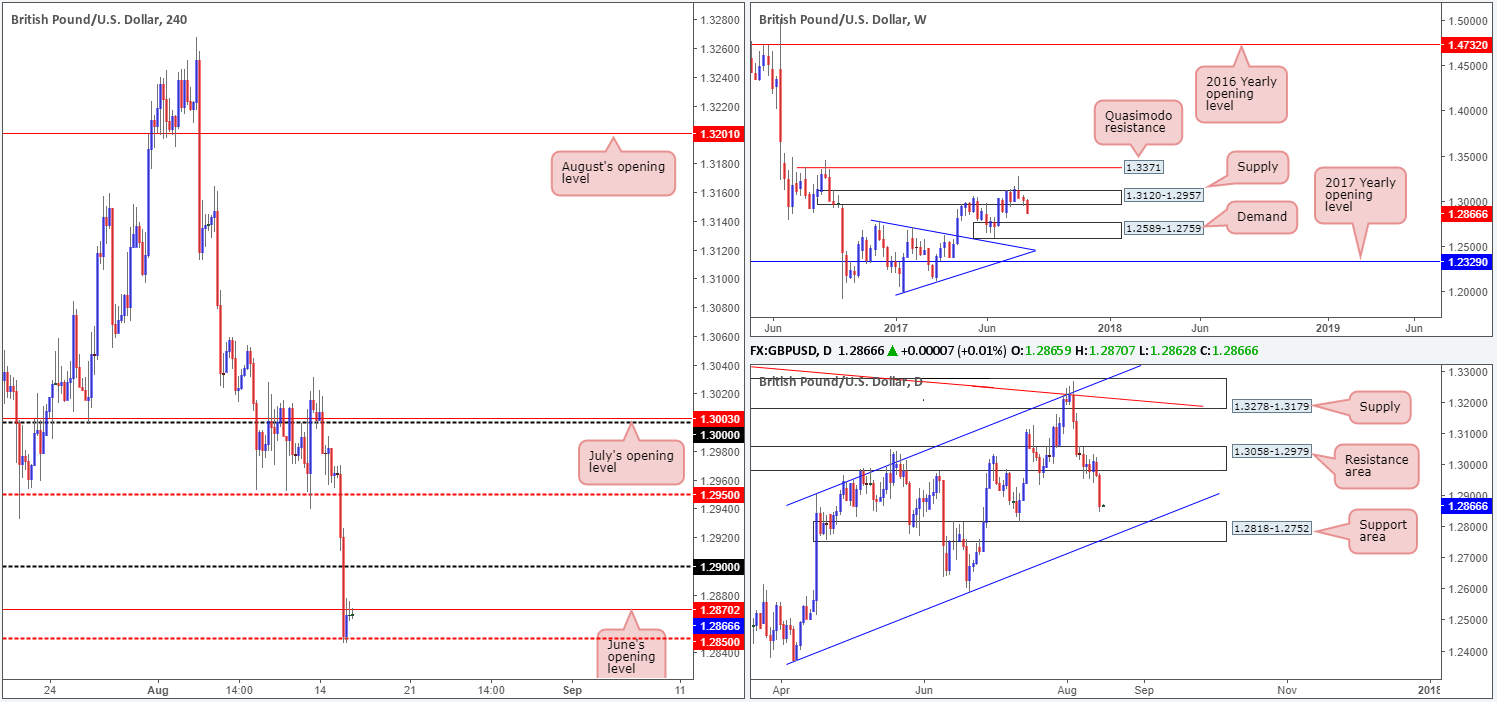
The British pound took an absolute hammering on Tuesday, plummeting nearly 100 pips from open to close! The first round of selling came after UK inflation data failed to meet market expectations, eventually forcing H4 price beneath the 1.29 handle. Further selling was seen later on in the day after better-than-expected US retail sales, forcing the unit to trade below June’s opening level at 1.2870 and into the H4 mid-level support barrier at 1.2850.
While the bulls have registered some interest from 1.2850, June’s opening level seen just above is well offered at the moment. In addition to this, over on the bigger picture we can see that the daily support area at 1.3058-1.2979 finally gave way and price now looks poised to challenge the daily support area pegged at 1.2818-1.2752. Further supporting the bears, the weekly timeframe shows space for the market to trade as far down as the demand area coming in at 1.2589-1.2759.
Suggestions: Although the higher timeframes suggest further selling could be upon us, shorting this market sub 1.2850 is challenging. Positioned only 30 pips beneath this number is the top edge of the aforementioned daily support area, followed closely by the 1.28 handle drawn on the H4 chart (not seen on the screen).Given the lack of space for sellers here, we’re going to take the safest position of all today: FLAT.
Data points to consider: UK employment figures at 9.30am. US Housing numbers at 1.30pm, followed later by the FOMC meeting minutes at 7pm GMT+1.
Levels to watch/live orders:
- Buys: Flat (stop loss: N/A).
- Sells: Flat (stop loss: N/A).
AUD/USD:
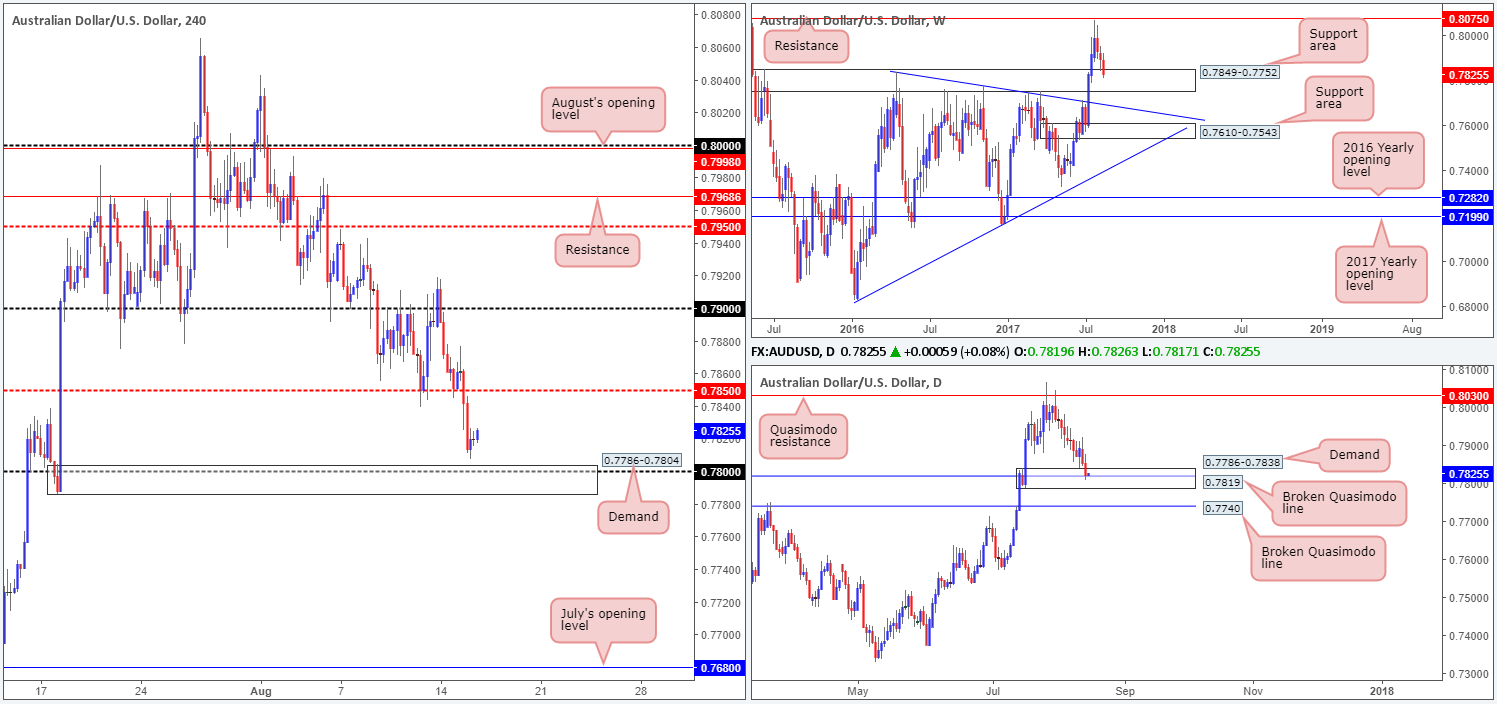
For those who read Tuesday’s report you may recall that we set a pending buy order at 0.7805, with a stop-loss order tucked beneath H4 demand at 0.7784. Thanks to yesterday’s selloff, fueled by better-than-expected US retail sales figures, we may see this order filled later on today.
Why we chose this H4 demand as a buy zone is due to the following:
- The weekly candles recently came into contact with a support area marked at 0.7849-0.7752.
- The daily timeframe also shows price interacting with a demand at 0.7786-0.7838, which encases a broken Quasimodo level at 0.7819.
- The 0.78 handle is seen housed within the current H4 demand.
Suggestions: Wait for the pending buy order to fill and look to target 0.7850 as your initial take-profit zone. With a 21-pip stop and 42 pips to the first target, we have attractive risk/reward in play here.
Data points to consider: US Housing numbers at 1.30pm, followed later by the FOMC meeting minutes at 7pm GMT+1.
Levels to watch/live orders:
- Buys: 0.7805 ([pending order] stop loss: 0.7784).
- Sells: Flat (stop loss: N/A).
USD/JPY:
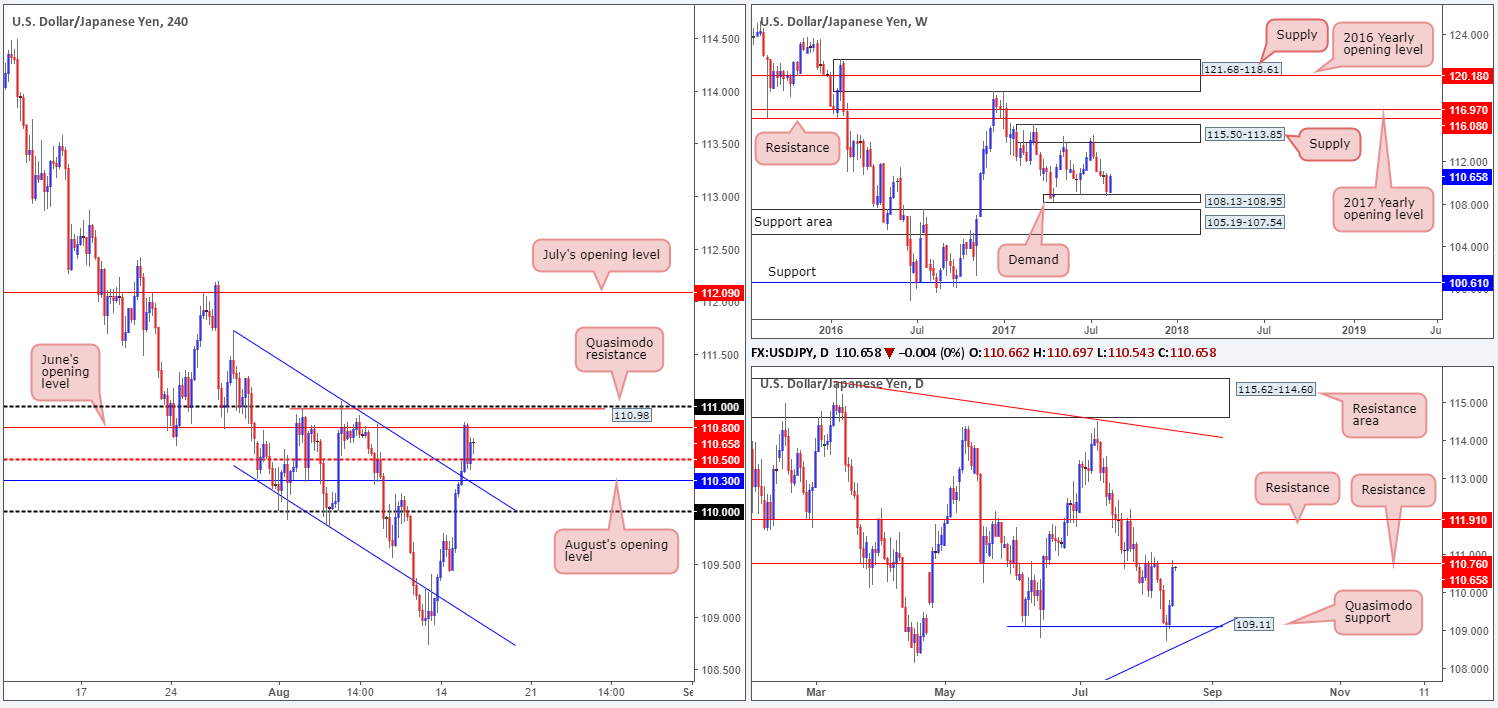
The US dollar continued to rise against its Japanese counterpart on Tuesday, reaching a high of 110.84 on the day. Those who were looking to short the 110.50 region based on yesterday’s report, the level was unfortunately violated due to upbeat US retail sales figures. Never trade before high-impacting news!
The H4 candles are currently seen capped between June’s opening level at 110.80 and the 110.50 boundary, so where does one go from here? Well, according to the daily structure, a move lower could be on the cards due to price currently interacting with resistance at 110.76. The flip side to this, of course, is the weekly timeframe showing the unit trading from demand at 108.13-108.95.
Suggestions: Ultimately, what we’re looking for is a daily close above the current resistance. This, on the daily timeframe, would likely clear the pathway north up to resistance pegged at 111.91. As for a possible entry, a H4 close above 111, followed up with a retest as support and a H4 bullish candle (preferably a full-bodied candle) would be enough for us to pull the trigger and target the 112 region/July’s opening level at 112.09 (positioned just above the said daily resistance).
Data points to consider: US Housing numbers at 1.30pm, followed later by the FOMC meeting minutes at 7pm GMT+1.
Levels to watch/live orders:
- Buys: Watch for H4 price to close above the 111 region and then look to trade any retest seen thereafter ([waiting for a reasonably sized bullish candle to form following the retest – in the shape of either a full, or near-full-bodied candle – is advised] stop loss: ideally beyond the candle’s tail).
- Sells: Flat (stop loss: N/A).
USD/CAD:
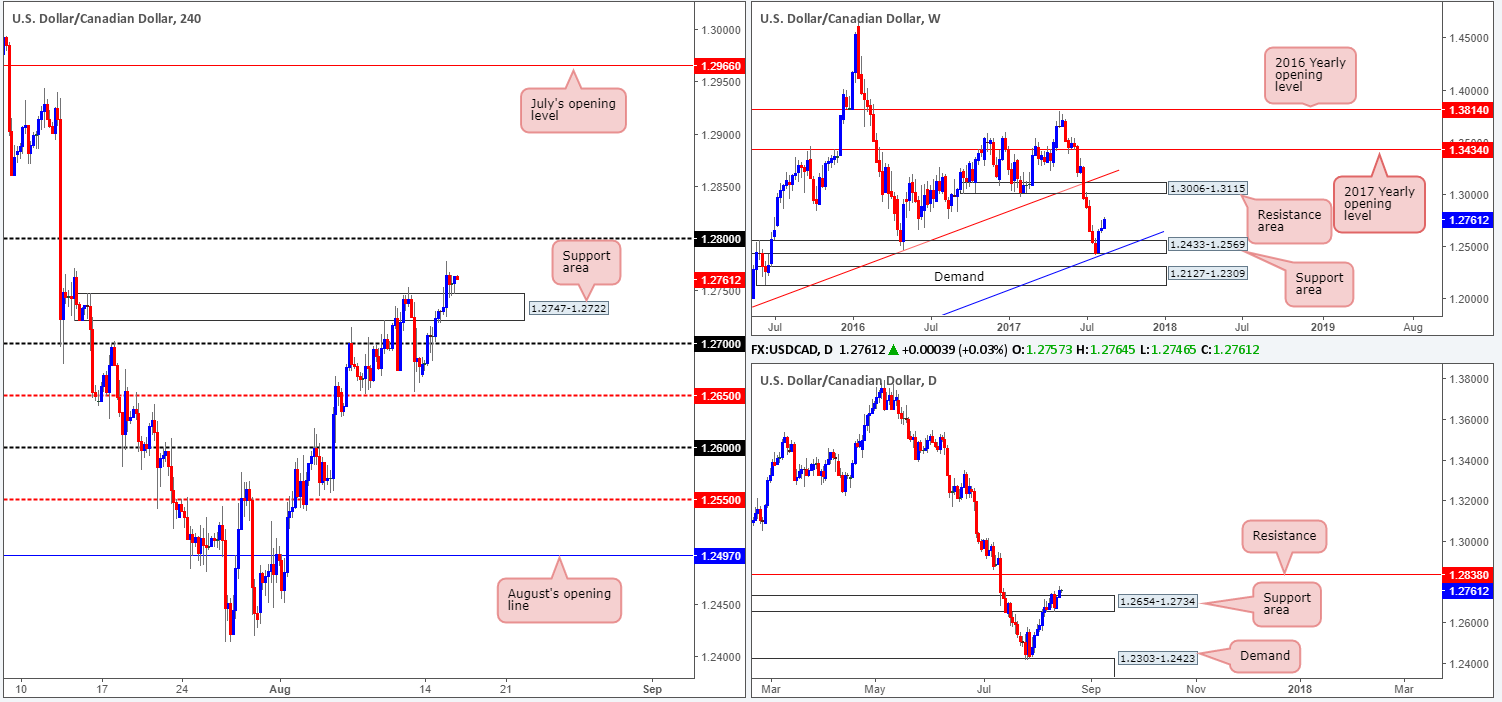
Following stronger-than-expected US retail sales data, the dollar appreciated against its Canadian rival and closed above the H4 supply fixed at 1.2747-1.2722. With the H4 candles now seen retesting this area, we may see price cross swords with the 1.28 handle seen overhead. On a similar note, daily action also crossed above the resistance area coming in at 1.2654-1.2734, which could, if the bulls remain in control, send the unit up to resistance at 1.2838. Further supporting the bid-side of this market is the weekly bulls from 1.2433-1.2569. We do not see any obvious resistance on this scale until the 1.3006-1.3115 area.
Suggestions: Given how well the H4 candles have held following a retest of the recently broken supply, a buy from current price is, in our opinion, valid. However, you need to be prepared to face some opposition from 1.28, and then the daily resistance at 1.2838.
Data points to consider: US Housing numbers at 1.30pm, followed later by the FOMC meeting minutes at 7pm GMT+1.
Levels to watch/live orders:
- Buys: A long at current price is valid given the structure of this market (stop loss: aggressive: 1.2740 conservative: 1.2720).
- Sells: Flat (stop loss: N/A).
USD/CHF:
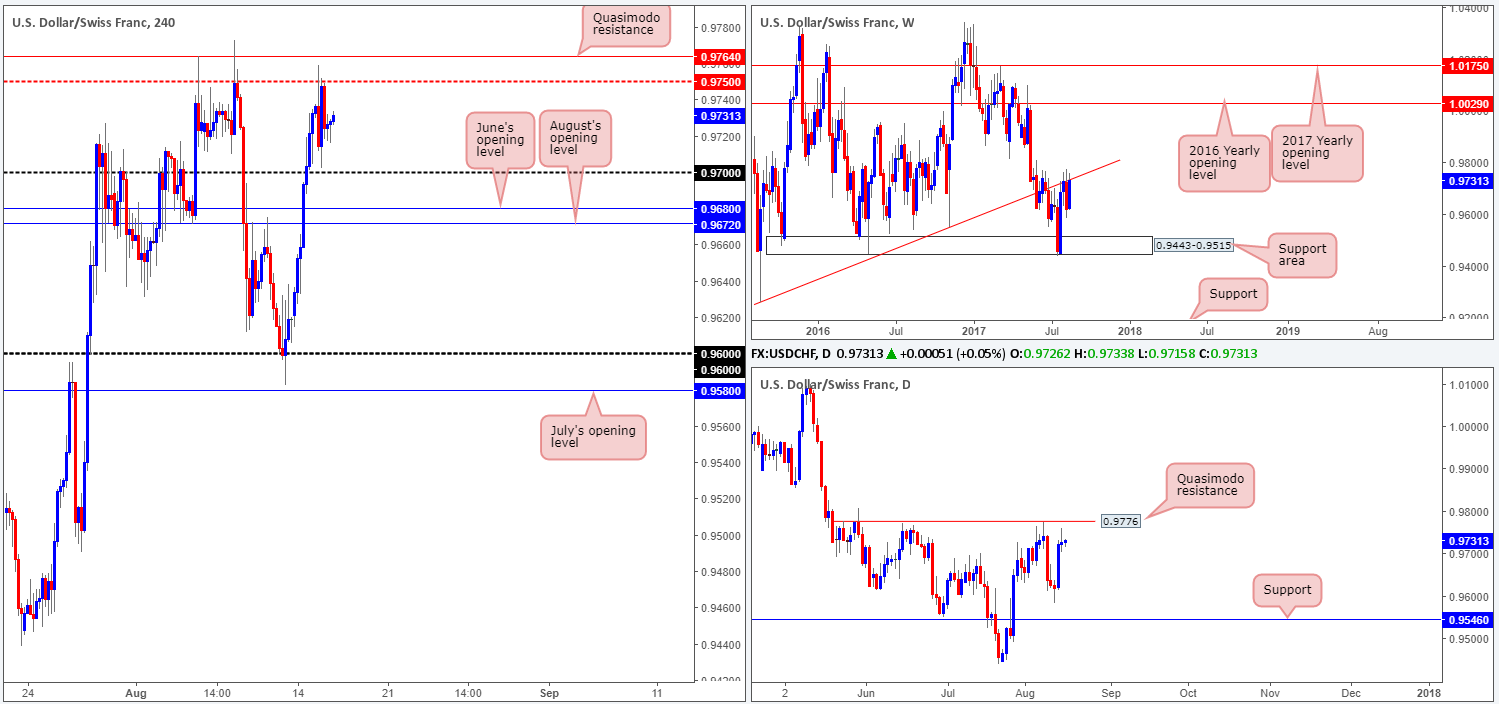
In recent trading, the USD/CHF tested the H4 mid-level resistance at 0.9750 and managed to punch to a low of 0.9702 on the day. As you can see, 0.9750 is shadowed closely by a H4 Quasimodo resistance at 0.9764 and a daily Quasimodo resistance planted just above that at 0.9776. All of this structure – coupled with a major weekly trendline resistance extended from the low 0.9257, makes for an overbought market, in our humble view.
As we mentioned in Tuesday’s report, we are interested in the daily Quasimodo resistance mentioned above, largely because of how well price reacted when it came near to testing the boundary last week, and, of course, the converging weekly trendline resistance!
Suggestions: Although we believe price will bounce from the daily Quasimodo resistance, we still require a bearish H4 candle to form in the shape of either a full, or near-full-bodied candle. This just helps confirm whether there are interested sellers from this point.
Data points to consider: US Housing numbers at 1.30pm, followed later by the FOMC meeting minutes at 7pm GMT+1.
Levels to watch/live orders:
- Buys: Flat (stop loss: N/A).
- Sells: 0.9776 region ([waiting for a reasonably sized bearish candle to form – in the shape of either a full, or near-full-bodied candle – is advised] stop loss: ideally beyond the candle’s wick).
DOW 30:
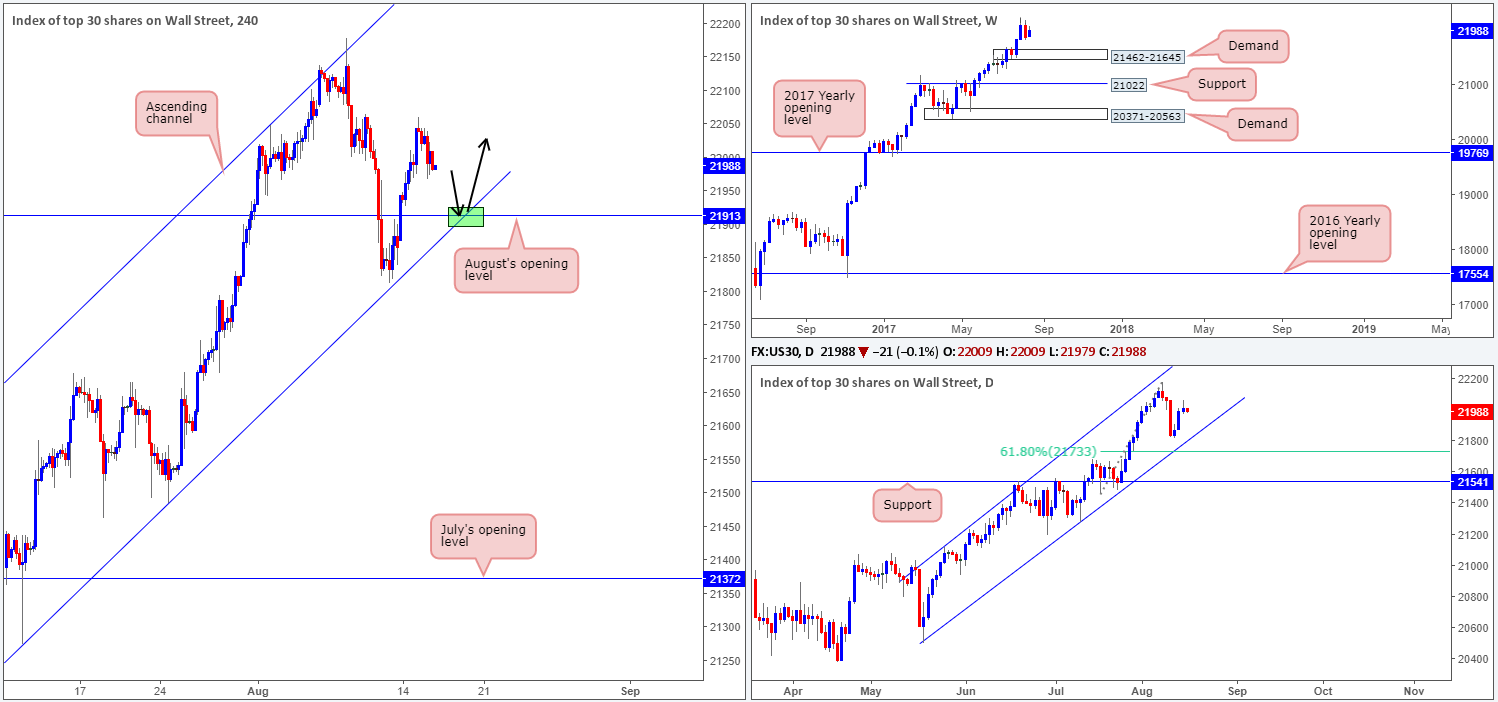
Of late, we’ve seen the US equity market ease from highs of 22060 and clock a low of 21968. Seen directly below current price on the H4 timeframe is August’s opening level at 21913, which happens to fuse beautifully with a channel support line extended from the low 21273.
As noted in yesterday’s report, we do not see any higher-timeframe resistances on the horizon at the moment. Therefore, a retest of August’s opening level, alongside the aforementioned H4 channel support would, in our humble view, be a nice area to consider entering long from (green zone).
Our suggestions: As you are probably already aware trendlines are unfortunately prone to being faked, so we would highly recommend being patient and waiting for a H4 bullish candle to take shape in the form of a full, or near-full-bodied candle. This will, of course, not guarantee that the level will hold, but what it will do is show bullish intent from a potential buy zone!
Data points to consider: US Housing numbers at 1.30pm, followed later by the FOMC meeting minutes at 7pm GMT+1.
Levels to watch/live orders:
- Buys: 21913 region ([waiting for a reasonably sized H4 bullish candle to form – in the shape of either a full, or near-full-bodied candle – is advised] stop loss: ideally beyond the candle’s tail).
- Sells: Flat (stop loss: N/A).
GOLD:
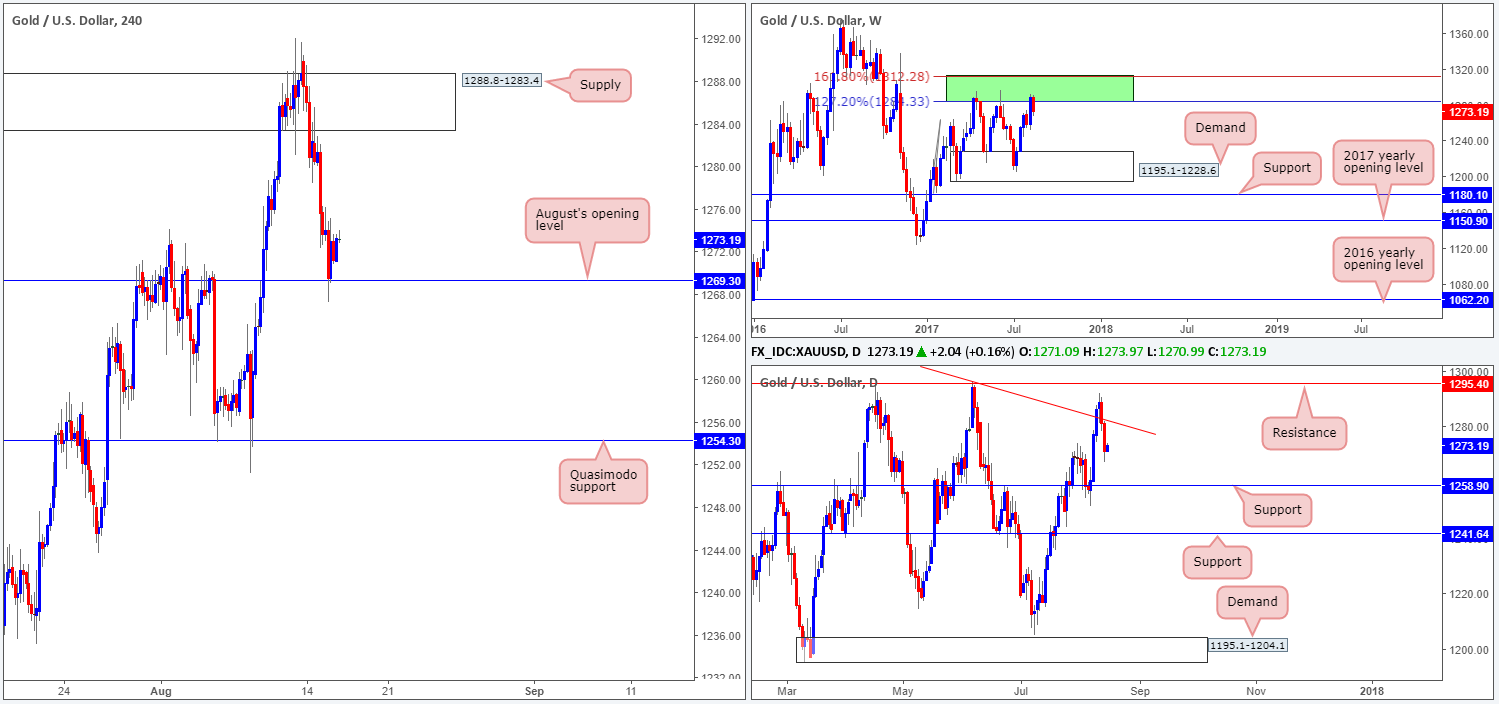
Demand for the safe-haven metal continued to diminish on Tuesday, bringing H4 price down to August’s opening level pegged at 1269.3. With tensions easing between the US and North Korea, and weekly price trading from a resistance area comprised of two weekly Fibonacci extensions 161.8/127.2% at 1312.2/1284.3 taken from the low 1188.1, a selloff in this market was high probability.
As well as seeing space for weekly price to continue selling off, we can also see that daily price shows room to trade down as far as a support level seen at 1258.9. However, as we mentioned above, August’s opening level is currently seen providing support.
Our suggestions: Until we see a H4 close print below August’s opening level, we will refrain from taking any shorts in this market. A close below this monthly line, followed up with a retest and a lower-timeframe sell signal (see the top of this report) would, in our opinion, be enough to confirm a sell trade down to the daily support mentioned above at 1258.9, followed closely by the H4 Quasimodo support at 1254.3.
Levels to watch/live orders:
- Buys: Flat (stop loss: N/A).
- Sells: Watch for H4 price to close below 1269.3 and then look to trade any retest seen thereafter ([waiting for a lower-timeframe sell signal to form following the retest is advised] stop loss: dependent on where one confirms this level).


