
EUR/USD:
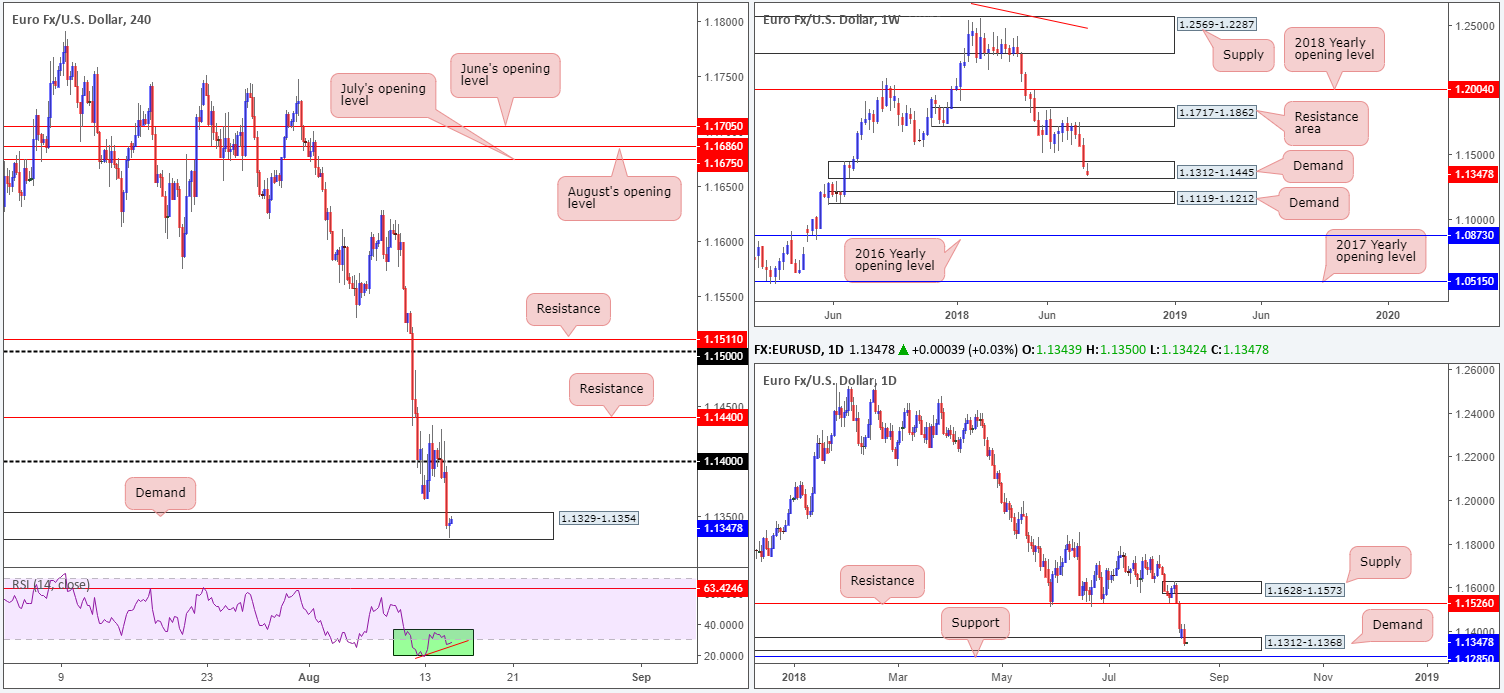
Despite Monday’s modest recovery from lows of 1.1365, and a reasonably solid round of macroeconomic data out of the EU on Tuesday, the shared currency went back to playing on the defensive against its US counterpart. As you can see, the H4 candles reclaimed the 1.14 handle – retested it as resistance – and fell sharply towards nearby demand penciled in at 1.1329-1.1354, consequently clocking fresh 2018 lows of 1.1330.
Across on the higher timeframes, weekly flow remains trading within the walls of a demand area at 1.1312-1.1445. Until now, price action has failed to print anything of note to the upside from here. Continued selling may call for a move towards the next layer of demand coming in at 1.1119-1.1212. Supporting the current weekly demand, though, is a partner demand seen on the daily timeframe at 1.1312-1.1368. A break of this zone on this scale, however, almost immediately places daily support at 1.1285 in the firing range.
Areas of consideration:
Tuesday’s session concluded in the shape of a H4 bullish pin-bar formation within the confines of H4 demand mentioned above at 1.1329-1.1354. Note this area is also housed within both the aforementioned weekly and daily demand areas, and the H4 RSI indicator is seen displaying divergence within oversold territory. Technically speaking, a move back up to retest 1.14 could be seen from here, given this confluence. Aggressive traders may look to position stops beneath the current H4 demand base, whereas conservative traders are likely to opt for the safety of higher-timeframe demands: beneath 1.1312. Should price breach 1.14 to the upside, the next area of interest falls in at 1.1440: a H4 resistance level – an ideal second take-profit target.
Today’s data points: French and Italian banks will be closed in observance of Assumption Day; US retail sales m/m; US empire state manufacturing index; US industrial production m/m and capacity utilization rate.
GBP/USD:
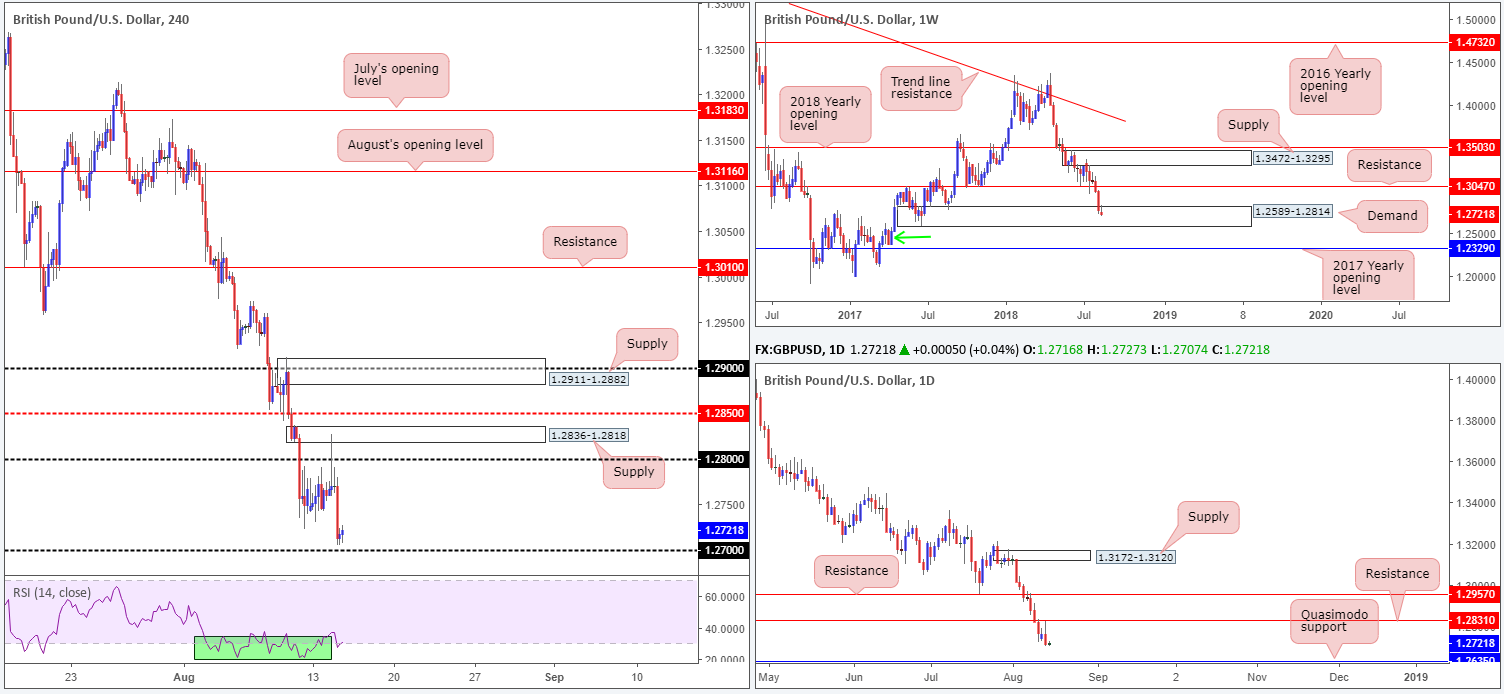
Sterling witnessed a temporary upside move in early London hours on Tuesday, piggybacking of a better-than-expected UK unemployment reading. In spite of this, the pair was unable to keep hold of the 1.28 handle on the H4 timeframe after shaking hands with a nearby H4 supply at 1.2836-1.2818, retreating lower on more Bruit warnings about a no-deal or a disorderly withdrawal from the EU.
For those who read Tuesday’s report you may recall the team highlighted the aforementioned H4 supply as a potential sell zone. We liked this area largely due to daily resistance at 1.2831 converging with the zone. The only grumble from here was, of course, the fact weekly players are seen trading within the walls of a demand zone at 1.2589-1.2814. Well done to any of our readers who managed to jump aboard this recent sell!
Moving forward, the H4 candles are seen loitering just north of the 1.27 handle, whereas daily action, after coming within touching distance of resistance at 1.2831, exhibits potential to drive as far south as a Quasimodo support located at 1.2635.
Areas of consideration:
This is a tricky market to trade at the moment. Ignoring the political situation in the UK, technical display conflicting stories. Weekly price suggests a turn north may be on the cards, while daily price indicates lower levels are likely. On top of this, the 1.27 handle on the H4 timeframe could possibly act as support.
At this time, we feel neither a long nor short seems attractive. It’s always best to trade when all the ducks are lining up on each timeframe!
Today’s data points: UK inflation figures; US retail sales m/m; US empire state manufacturing index; US industrial production m/m and capacity utilization rate.
AUD/USD:
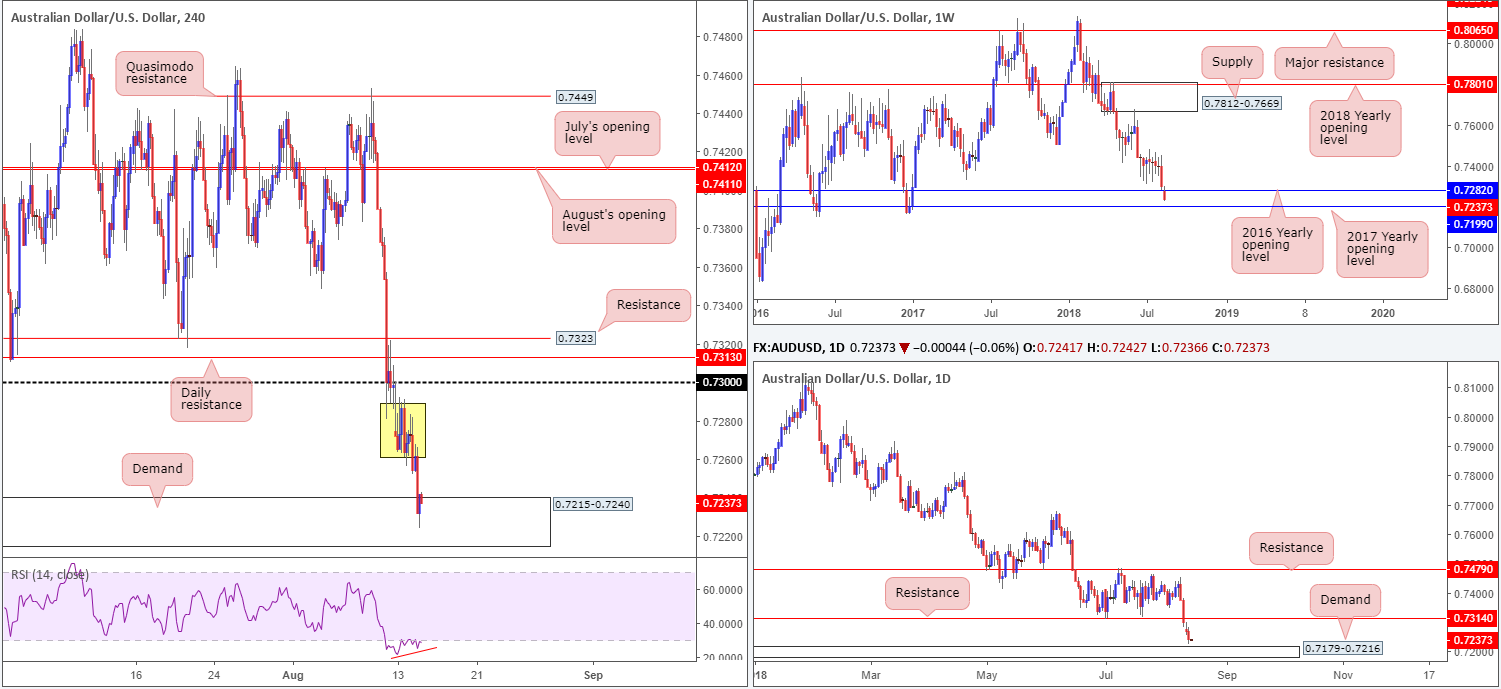
The AUD/USD traded to fresh 2018 lows of 0.7224 on Tuesday, as the US dollar resumed its march north across the broader FX space.
Demand at 0.7215-0.7240, along with the RSI indicator displaying divergence in oversold terrain, is currently observed on the H4 scale. Traders may have also noticed the H4 demand is glued to the top edge of a daily demand base located at 0.7179-0.7216, which itself holds the 2017 yearly opening level support on the weekly timeframe at 0.7199.
Areas of consideration:
In a nutshell, all three timeframes point to a move higher, assuming the H4 demand base holds ground. A modest amount of H4 consolidation is, however, seen above this demand at 0.7289/61 (yellow zone), which could potentially act as supply. Despite this, a move higher from the current H4 demand should eventually reach the 0.73 neighborhood, positioned directly below daily resistance at 0.7313 (the next upside target on the daily scale).
A break of the H4 demand, on the other hand, will press daily action further into its demand at 0.7179-0.7216 and possibly target the 2017 yearly opening level highlighted above on the weekly timeframe at 0.7199.
Today’s data points: AUD Wage price index q/q; US retail sales m/m; US empire state manufacturing index; US industrial production m/m and capacity utilization rate.
USD/JPY:
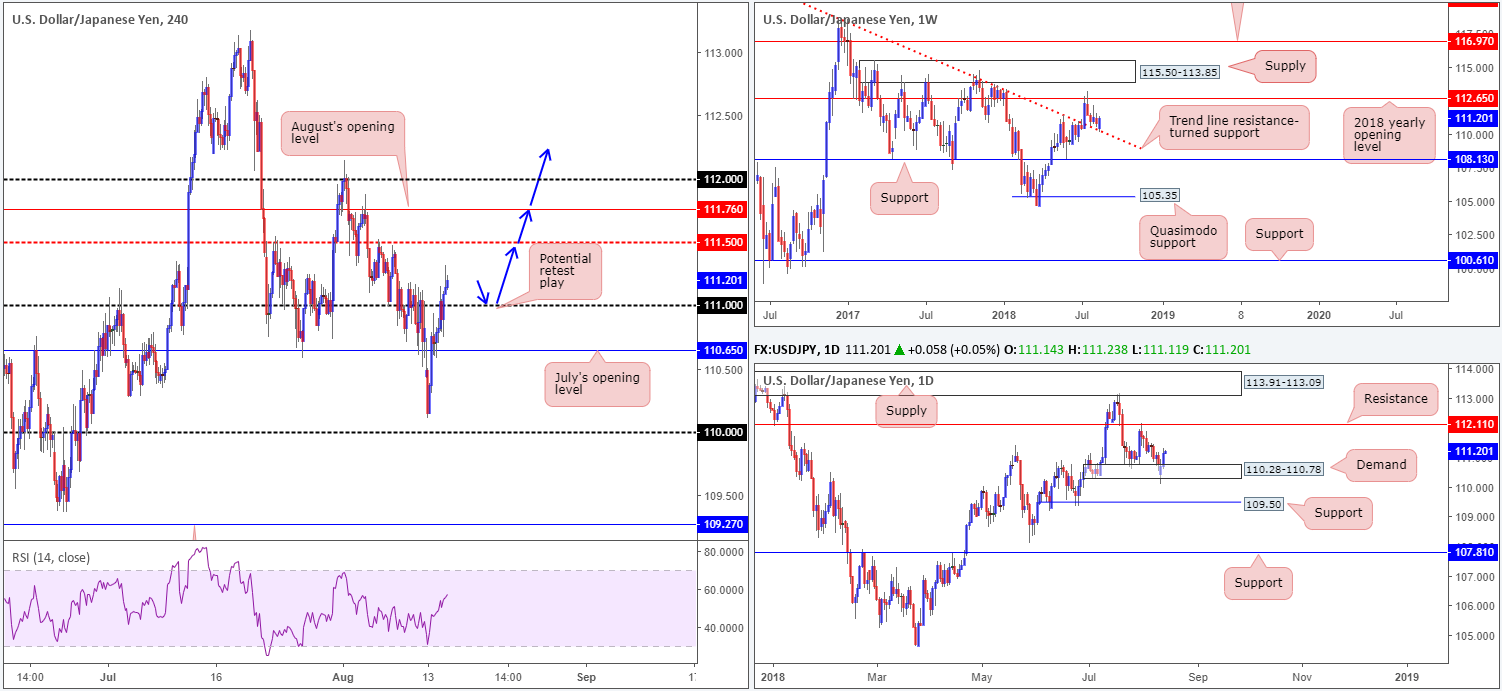
Broad USD strength, backed by a recovery in US equities and firmer US Treasury yields, saw the USD/JPY couple print its second consecutive daily gain on Tuesday.
Kicking off with a look at the weekly timeframe, we can see recent activity crossed swords with a trend line resistance-turned support (taken from the high 123.57). Having seen the current trend line hold firm as resistance on a number of occasions in the past, we felt confident it was likely to remain a defensive support going forward. Further buying from current price has the 2018 yearly opening level at 112.65 to target. It might also be worth noting the DJIA weekly chart also shows a similar picture: bouncing from a weekly trend line resistance-turned support (extended from the high 25807).
In terms of daily activity, demand at 110.28-110.78 remains in the fight despite suffering a minor breach to the downside on Monday. The next upside target on this scale can be seen at a resistance level drawn from 112.11. Meanwhile, on the H4 timeframe, the pair reclaimed 111 status, now eyeing a potential continuation towards the 111.50 region: mid-level resistance.
Areas of consideration:
Having seen H4 price close above 111, along with both weekly and daily timeframes indicating further upside, the team has noted to wait for a retest of 111 as support in the shape of a full or near-full-bodied H4 bull candle, before initiating longs. From here, the ultimate take-profit target can be set at the 2018 yearly opening level mentioned above on the weekly timeframe at 112.65.
Today’s data points: US retail sales m/m; US empire state manufacturing index; US industrial production m/m and capacity utilization rate.
USD/CAD:
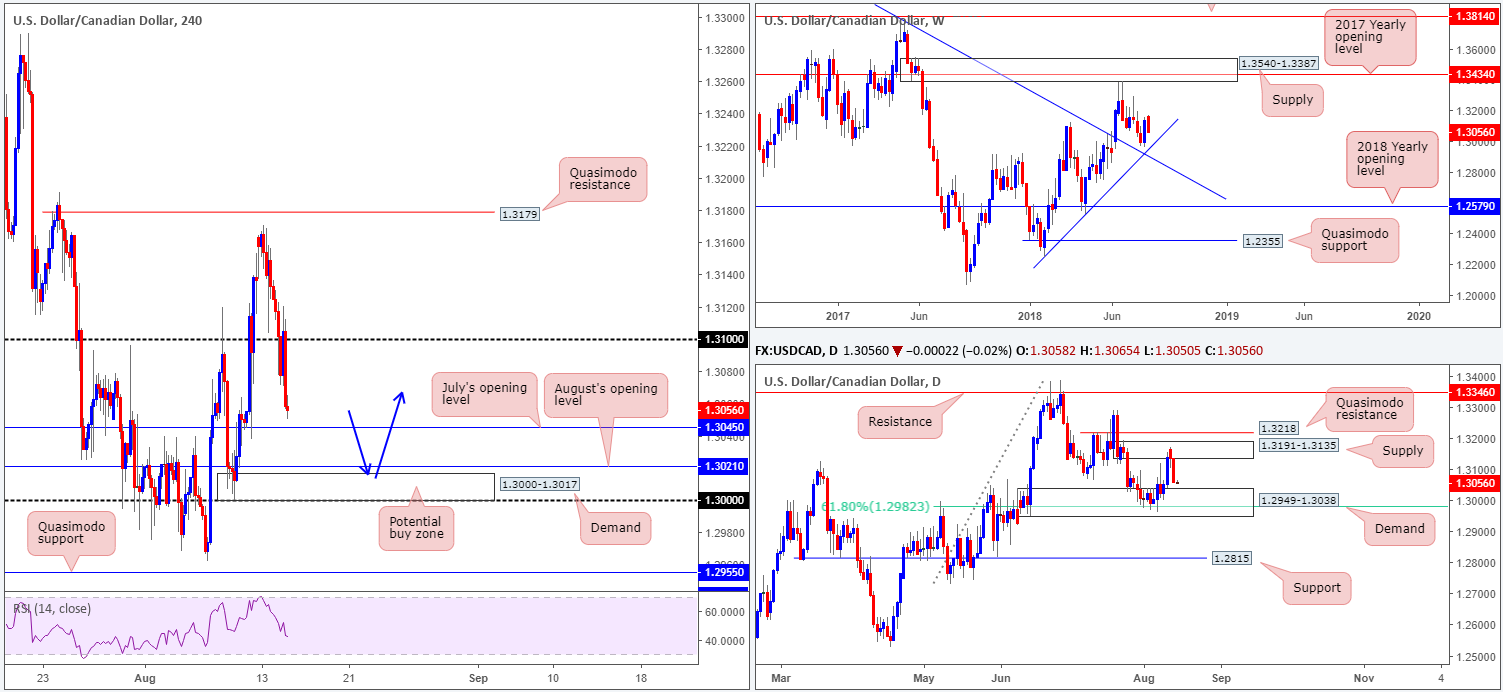
In recent sessions, the USD/CAD witnessed additional losses, following Monday’s near-touch of a H4 Quasimodo resistance at 1.3179. H4 sellers, as you can see, swallowed the 1.31 handle and concluded Tuesday’s segment closing just ahead of July’s opening level at 1.3045. Beyond this support, traders’ crosshairs will likely be fixed on August’s opening level at 1.3021, followed closely by the key figure 1.30.
Daily supply at 1.3191-1.3135 proved a valuable barrier, with the daily candles now seen hovering just north of a daily demand base at 1.2949-1.3038. Note this area also intersects with a 61.8% Fib support value at 1.2982. Higher up on the curve, nevertheless, weekly price appears somewhat confined between two trend line supports (1.2247/1.4689) at the moment. To the upside on this scale, keep tabs on supply penciled in at 1.3540-1.3387, which happens to fuse with a 2017 yearly opening level at 1.3434.
Areas of consideration:
In view of the current daily demand at 1.2949-1.3038, buying opportunities on the H4 scale are possible around demand printed at 1.3000-1.3017. We like this H4 zone due to it being housed within the noted daily demand area, and formed on top of the 1.30 handle, as well as positioned just beneath August’s opening level mentioned above at 1.3021.
Those who are interested in executing a long from 1.3000-1.3017, waiting and seeing if H4 price can chalk up a full or near-full-bodied bull candle before pulling the trigger is advised. Why this is, simply comes down to round numbers, particularly full round numbers, being susceptible to fadeouts.
Today’s data points: US retail sales m/m; US empire state manufacturing index; US industrial production m/m and capacity utilization rate.
USD/CHF:
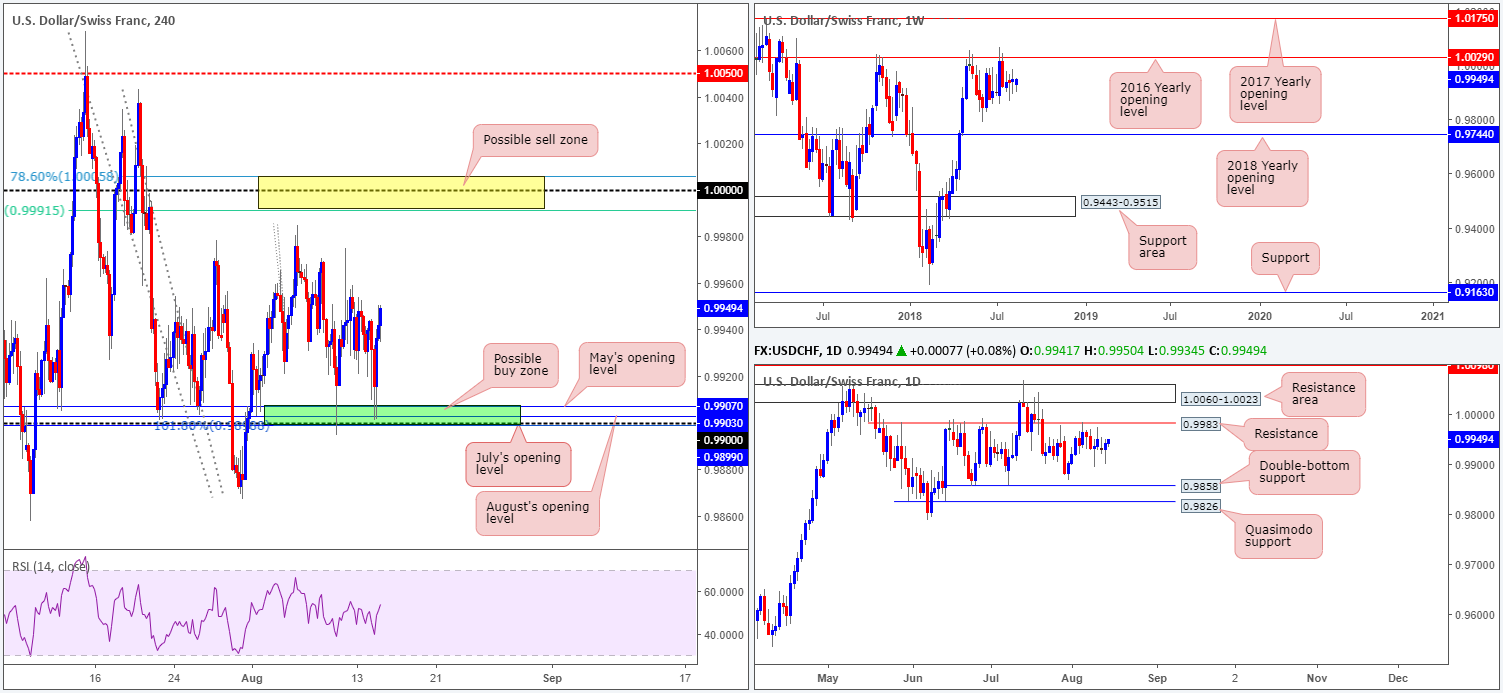
For those who read Tuesday’s briefing you may recall the team highlighted a possible H4 buy zone marked in green at 0.9899/0.9907 (comprised of July’s opening level at 0.9899, a 161.8% Fib ext. point at 0.9899 [taken from the high 0.9984], the 0.99 handle, August’s opening level at 0.9903 and May’s opening level at 0.9907). As you can see, this area was challenged amid trade yesterday and responded beautifully, lifting the market to session highs of 0.9950. Well done to any of our readers who managed to jump aboard this move!
The next area of interest on the H4 timeframe can be seen at parity (1.0000). Note surrounding this widely watched number are two Fibonacci resistances: 78.6% at 1.0005 and 61.8% at 0.9991 (yellow zone).
In terms of higher-timeframe movement, structure remains unchanged:
As can be seen on the weekly timeframe, price action penciled in a clear-cut indecision candle last week as the piece consolidates just south of a key resistance at 1.0029: the 2016 yearly opening level. Holding price lower on two occasions in 2017, and twice already in 2018, this level commands attention! Downside supports to keep eyeballs on from here fall in at June’s low 0.9788, followed by the 2018 yearly opening level at 0.9744.
Daily resistance at 0.9983, as is evident from the chart, continues to cap upside at the moment. In the event of a break north, nonetheless, the resistance area planted at 1.0060-1.0023 (holds the 2016 yearly opening level at 1.0029 mentioned on the weekly timeframe) is likely the next base in the firing range. A move lower from current price, on the other hand, has 0.9858 in view: a double-bottom support, shadowed closely by Quasimodo support at 0.9826.
Areas of consideration:
Both H4 zones: 0.9899/0.9907 and 1.0005/0.9991 should remain on the watch list for trading opportunities until one of these areas are engulfed.
Traders are still urged to wait for additional H4 candle confirmation at both the above said areas prior to pulling the trigger, preferably in the shape of a full or near-full-bodied candle. The reason being is round numbers (1.0000 and 0.99) tend to attract ‘stop runs’ (fadeouts). There’s little worse than having your stop-loss order triggered by a hair only to watch price shortly after hit your take-profit area!
Today’s data points: US retail sales m/m; US empire state manufacturing index; US industrial production m/m and capacity utilization rate.
Dow Jones Industrial Average:
Concerns over Turkey’s recent turmoil appears to have marginally diminished in recent trade, allowing US equities to disrupt a four-day bearish phase. Turkey’s central bank pledged to provide liquidity to financial institutions and ease pressure on the currency.
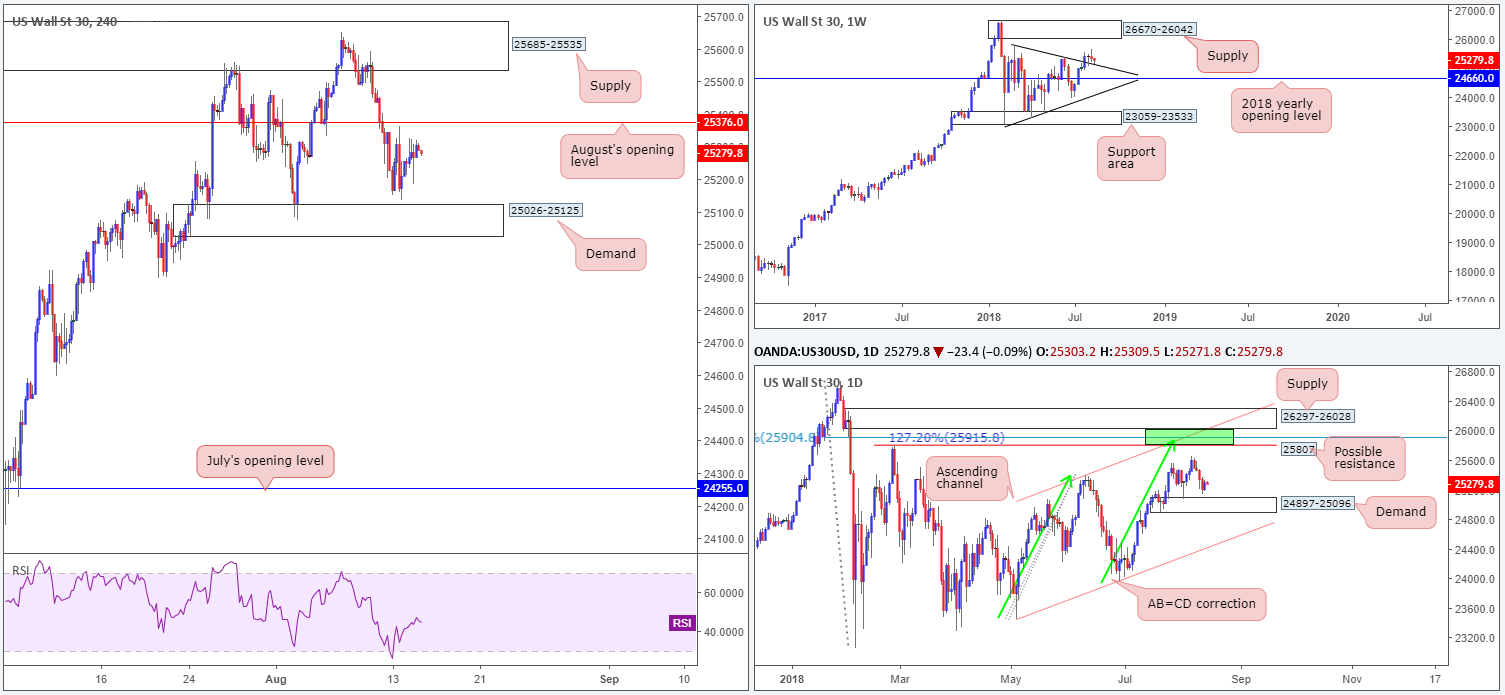
From a technical standpoint, however, the DJIA observed a retest of a weekly trend line resistance-turned support (etched from the high 25807). From here, a run up to weekly supply at 26670-26042 is potentially on the cards. In conjunction with weekly action, daily movement shows price bottomed just north of demand at 24897-25096. Also of interest here is the H4 demand base coming in at 25026-25125, seen glued to the top edge of the said daily demand area. Note this area has managed to hold this market higher twice already – will history repeat itself here? The next upside target on the H4 scale resides at 25376: August’s opening level.
Areas of consideration:
Despite the weekly trend line support seen in play right now, the H4 demand base mentioned above at 25026-25125 will still likely be on the radar for the majority of short/medium-term traders. Aggressive traders may look to enter at market around the top edge of this zone with stops planted a few points beneath the area. Conservative traders, on the other hand, might want to wait and see if H4 price can pencil in a full or near-full-bodied bull candle before pulling the trigger (stops set beneath the candle’s rejection tail), since one can never be sure if daily price wants to test the lower edge of its demand at 24897-25096.
In the event a push above August’s opening level takes shape (next upside target on the H4 scale), without connecting with the noted H4 demand, traders can then expect follow-through buying towards H4 supply at 25685-25535. A retest of 25376 as support would, in our view, be enough evidence to suggest an intraday long position here.
Today’s data points: US retail sales m/m; US empire state manufacturing index; US industrial production m/m and capacity utilization rate.
XAU/USD (Gold)
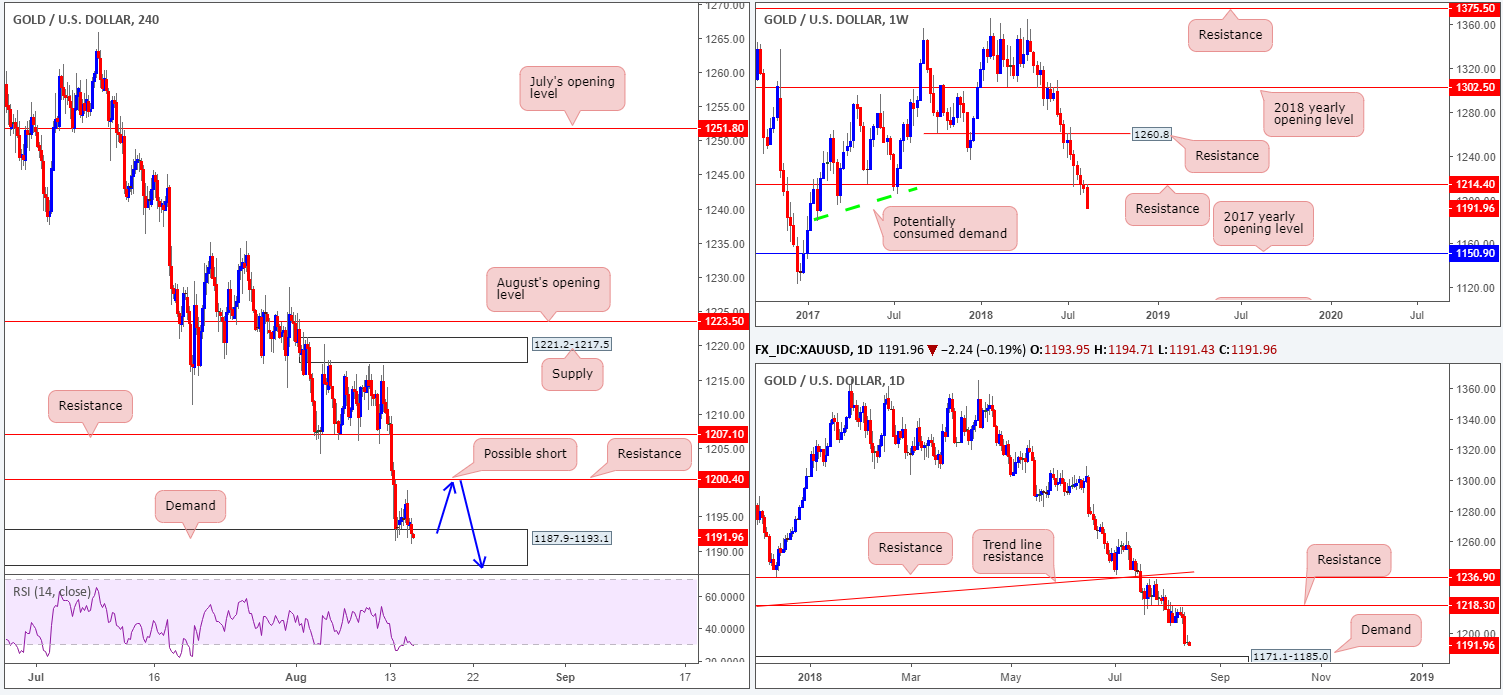
During the course of yesterday’s sessions the USD clocked fresh 2018 highs, consequently weighing on the precious metal. Weekly movement is seen emphasizing a strong bearish tone beneath resistance at 1214.4. The possibility of further selling as far south as the 2017 yearly opening level at 1150.9 is certainly there, as there’s limited active demand seen to the left of current price. A closer look at price action on the daily timeframe, however, shows demand hovering nearby at 1171.1-1185.0. Formed back in January of 2017, the area is not considered a fresh zone as it held price higher once already in late January (2017).
Across on the H4 timeframe, demand at 1187.9-1193.1 remains in the fray, seen positioned just north of a Quasimodo support at 1184.2 (not seen on the screen). As is evident from the chart, H4 buyers attempted to press higher from here on Tuesday, though failed just south of a resistance level printed at 1200.4.
Areas of consideration:
A long from the current H4 demand area has a number of competing themes to contend with: both weekly and daily flow portending lower prices. Therefore, a buy from the H4 zone is considered low probability, with the most still expected out of a move from here is resistance at 1200.4, which is a possible shorting level, according to our technical view. On the assumption H4 demand is fragile, and higher-timeframe direction pointing in a southerly direction, a short from 1200.4 boasts healthy odds (blue arrows), targeting the top edge of daily demand at 1185.0.
The use of the site is agreement that the site is for informational and educational purposes only and does not constitute advice in any form in the furtherance of any trade or trading decisions.
The accuracy, completeness and timeliness of the information contained on this site cannot be guaranteed. IC Markets does not warranty, guarantee or make any representations, or assume any liability with regard to financial results based on the use of the information in the site.
News, views, opinions, recommendations and other information obtained from sources outside of www.icmarkets.com.au, used in this site are believed to be reliable, but we cannot guarantee their accuracy or completeness. All such information is subject to change at any time without notice. IC Markets assumes no responsibility for the content of any linked site. The fact that such links may exist does not indicate approval or endorsement of any material contained on any linked site.
IC Markets is not liable for any harm caused by the transmission, through accessing the services or information on this site, of a computer virus, or other computer code or programming device that might be used to access, delete, damage, disable, disrupt or otherwise impede in any manner, the operation of the site or of any user’s software, hardware, data or property.


