
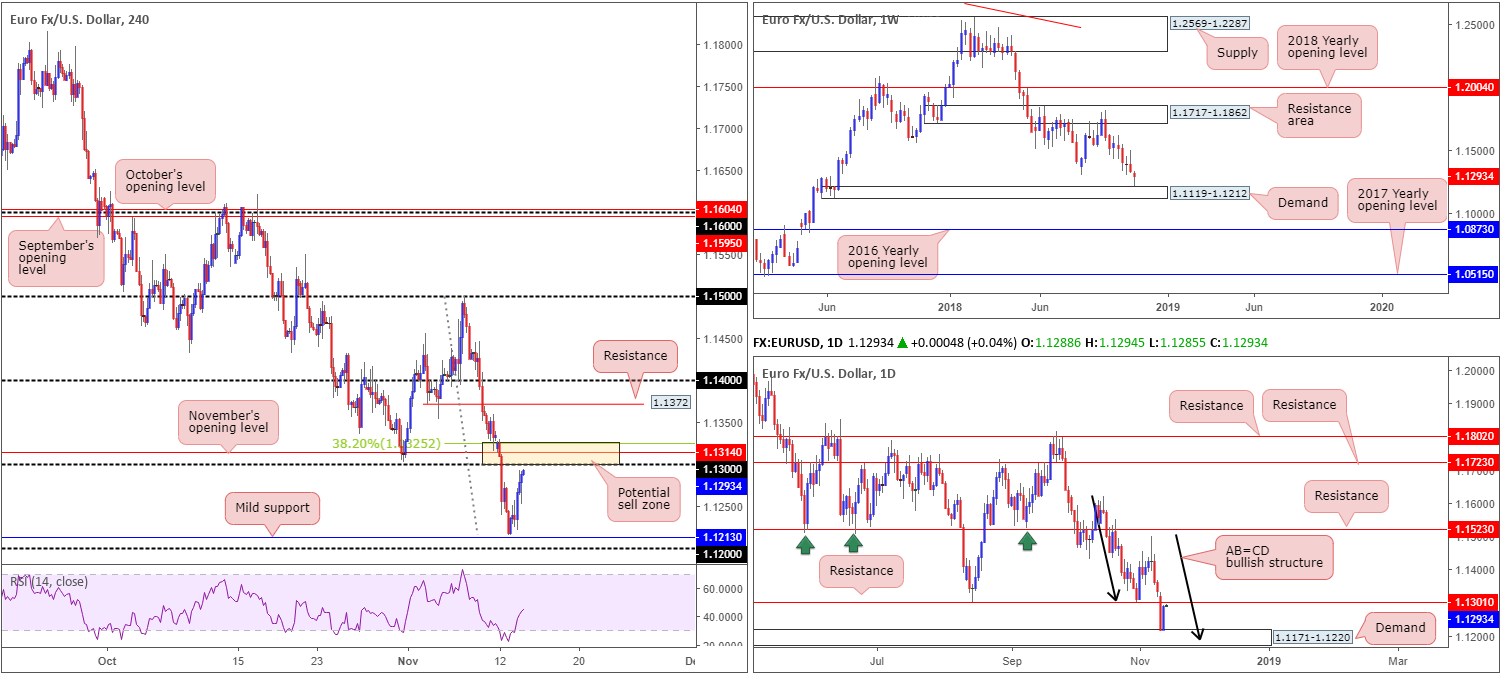
EUR/USD:
The EUR/USD witnessed a modest recovery come together Tuesday, as the pair rebounded off fresh 2018 lows of 1.1216. Up 0.63% on the day, as well as erasing a large portion of Monday’s losses, the catalyst behind recent buying largely stemmed from reports the UK-EU agreed on a technical withdrawal agreement draft.
Leaving mild H4 support at 1.1213 unchallenged, the H4 candles rose to highs of 1.1293, settling just south of the round number 1.13, November’s opening level at 1.1314 and a 38.2% Fib resistance at 1.1325 (light yellow zone). Technically speaking, yesterday’s advance was reinforced by daily demand coming in at 1.1171-1.1220, which happens to be glued to the top edge of a weekly demand area at 1.1119-1.1212. The next upside objective on the daily timeframe, however, is located close by at 1.1301: a reasonably strong resistance level. It may also interest some traders to note the US dollar index is seen selling off from within weekly supply at 97.87-96.32.
Areas of consideration:
Having noted an area of H4 resistance around the 1.1325/1.13 region (light yellow zone) that’s further supported by a daily resistance mentioned above at 1.1301, a bounce lower could be seen from here today. Conservative traders may opt to wait and see how H4 price action behaves before pulling the trigger. A bearish candlestick formation would help confirm seller interest, and also provide entry/stop parameters. Aggressive traders, on the other hand, will likely enter short from 1.13 with stop-loss orders planted a few pips beyond 1.1325.
In regard to downside targets from 1.1325/1.13, there’s limited support seen in this market until the top edge of daily demand at 1.1220, shadowed by H4 support at 1.1213 and then the 1.12 handle.
Today’s data points: German Prelim GDP q/q; Euro Flash GDP q/q; US CPI m/m/Core CPI m/m; FOMC Member Quarles Speaks.
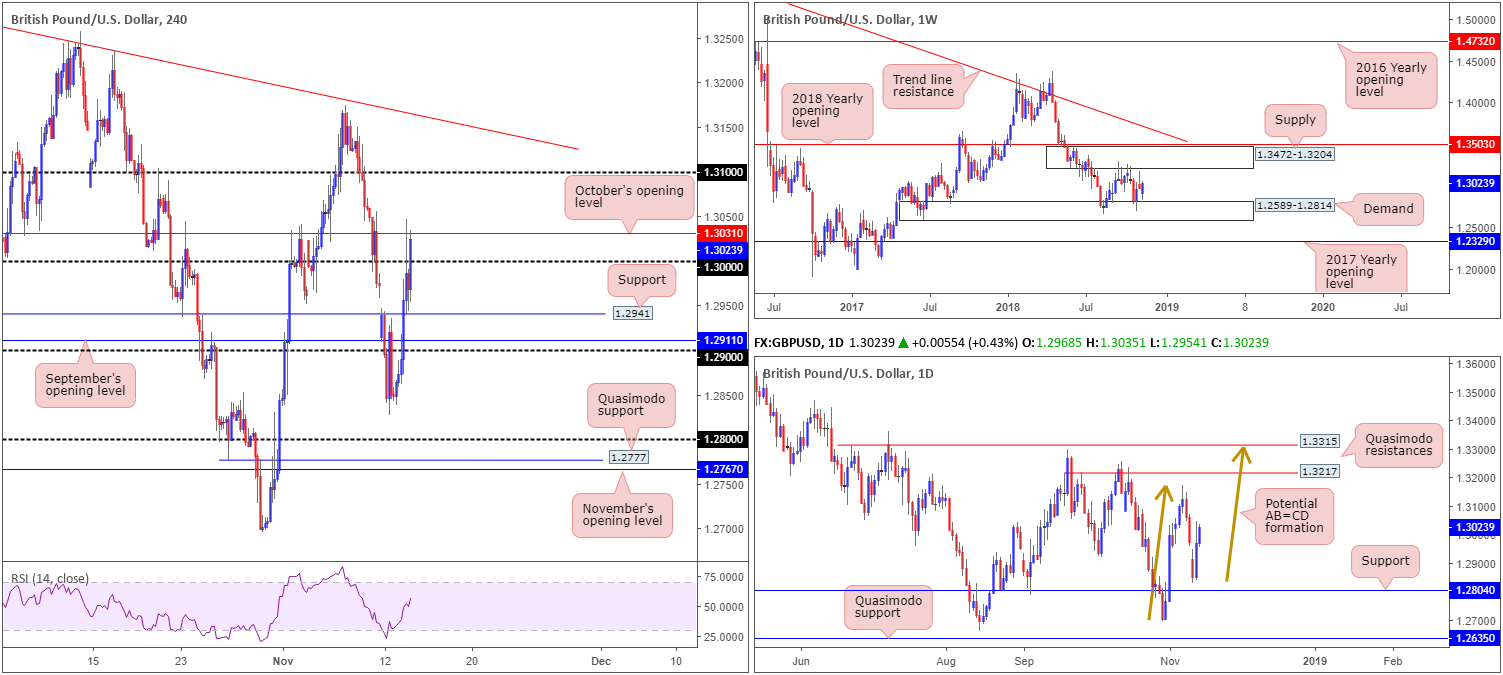
GBP/USD:
EU and UK negotiators have agreed the text of a draft withdrawal agreement, with Downing Street indicating there’ll be an emergency Cabinet meeting Wednesday morning to discuss it.
Recent developments, as you can see on the charts, witnessed reasonably strong GBP buying enter the market yesterday, rallying 120 pips, or 0.93%. In recent hours, the GBP/USD reclaimed its key figure 1.30 to the upside and is seen testing the underside of October’s opening level at 1.3031, following reports 5 senior ministers will back the Brexit deal.
A violation of 1.3031, could set the stage for a possible run towards 1.31 on the H4 timeframe. Beyond here, trend line resistance (extended from highs of 1.3298) is visible. In terms of the market’s position on the weekly timeframe, nevertheless, the unit remains confined between supply drawn from 1.3472-1.3204 and demand coming in at 1.2589-1.2814. Lower on the curve, daily movement shows room to press as far north as the 1.3073 Nov 7 high, shadowed closely by 1.3217: a Quasimodo resistance level. Another point worth mentioning is the possibility of an AB=CD bearish formation completing (brown arrows) at another nearby Quasimodo resistance level carved from 1.3315.
Areas of consideration:
As of current price, there’s not really much to hang one’s hat on in terms of tradable setups. Despite this, a firm H4 close above 1.3031 that’s followed up with a retest as support could still be something to keep eyes on. Though with UK inflation figures scheduled to hit the wires in early London hours, along with more Brexit news expected to rumble the markets, remaining on the sidelines may be the safer option today.
Today’s data points: UK Inflation Figures; US CPI m/m/Core CPI m/m; FOMC Member Quarles Speaks.
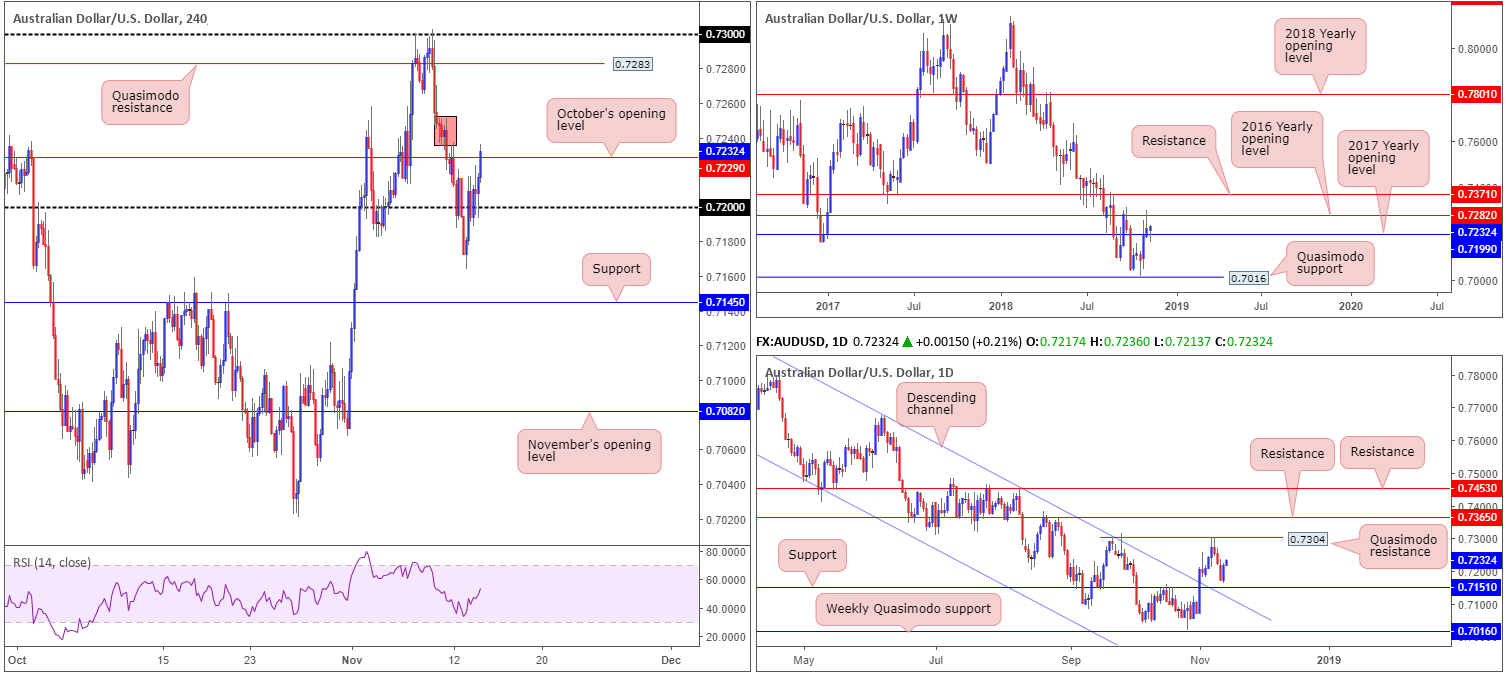
AUD/USD:
Optimism continued to surface in recent trade after White House Economic adviser Kudlow announced positive talks with China. In response, the AUD/USD concluded Tuesday’s session up 0.63% and pared all of Monday’s losses.
From a technical perspective, this has seen weekly action respect its 2017 yearly opening level at 0.7199. Room for further buying is also visible on this scale towards the 2016 yearly opening base at 0.7282. Daily price also found support just north of 0.7151 and its closely positioned channel resistance-turned support (taken from the high 0.8135). The next upside target on this scale, however, falls in around 0.7304: a Quasimodo resistance level.
H4 action has recently crossed above its October opening level at 0.7229. Nearby supply (marked red) appears fragile given it has already been tested. For that reason, sellers are likely weak here. Beyond this point, traders’ crosshairs will be fixed on the Quasimodo resistance at 0.7283, followed closely by the 0.73 handle.
Areas of consideration:
All three timeframes point to further buying at the moment. In order to confirm this, however, traders are urged to wait for a H4 close to form above October’s opening level at 0.7229. This – coupled with a retest of this level as support in the shape of a bullish candlestick formation – would likely be enough to draw in buyers and push for the H4 Quasimodo resistance level mentioned above at 0.7283.
Today’s data points: Wage Price Index q/q; China Fixed Asset Investment ytd/y; China Industrial Production y/y; US CPI m/m/Core CPI m/m; FOMC Member Quarles Speaks.
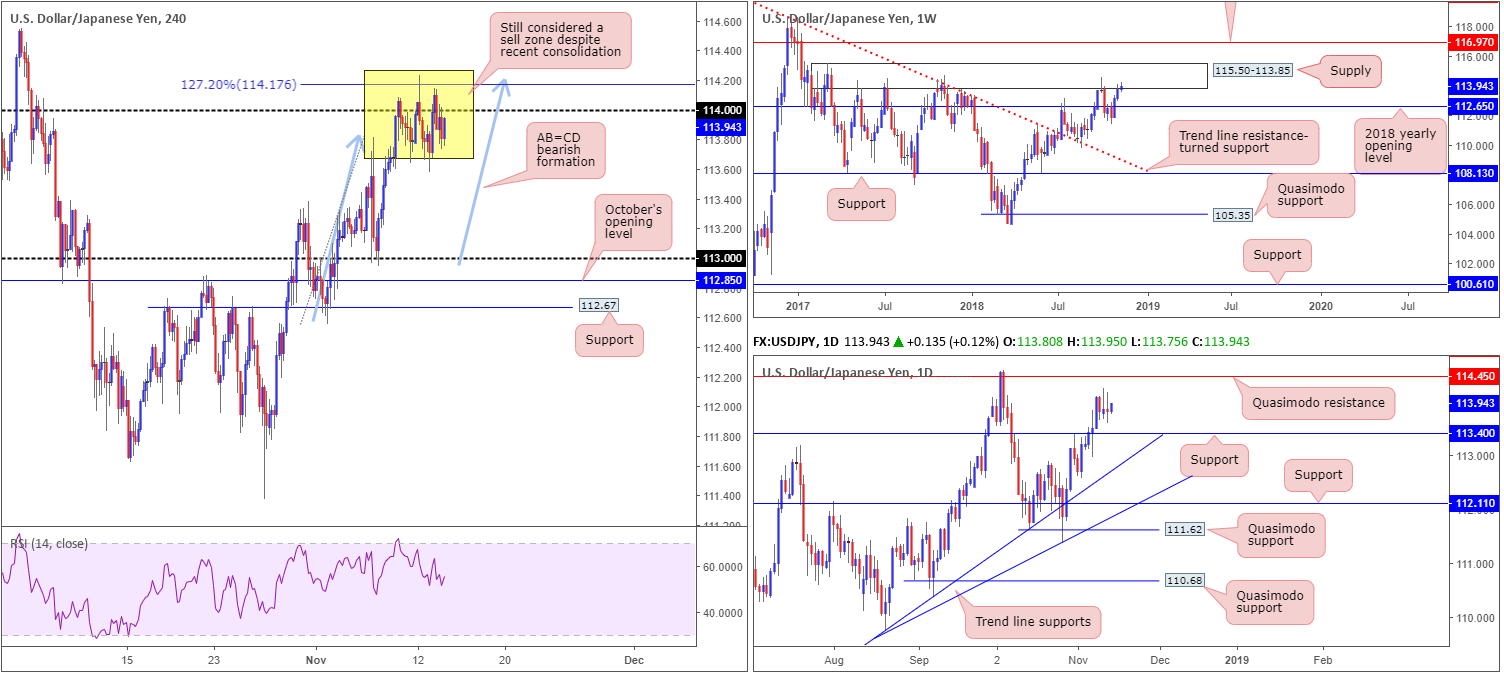
USD/JPY:
Despite ranging over 50 pips Tuesday, the USD/JPY ended the session unchanged. The pair gained traction in early European trade, though lost momentum shortly after clocking session highs of 114.14.
For folks who read previous briefings you may recall the team highlighted possible shorting opportunities around the 114.17 neighbourhood: a 127.2% (Fib ext.) H4 AB=CD (blue arrows) completion. The main attraction here, aside from the AB=CD formation, was the fact it completed around the underside of a weekly supply base coming in at 115.50-113.85.
Those who remain short this market may want to consider reducing risk to breakeven at this point, as H4 local support around 113.60 is proving troublesome to overthrow. The next downside target beyond 113.60, however, falls in around daily support at 113.40, followed then by the 113 handle.
Areas of consideration:
On the whole, we feel a sell off is still likely to be seen in this market, given where we’re coming from on the weekly timeframe, along with room seen for daily price to press as low as support at 113.40. With risk reduced to breakeven, traders short from 114.17, therefore, still have a healthy chance of receiving generous profits from the trade.
For those who missed the initial short at 114.17 may also still receive a second opportunity to sell should the H4 candles retest the underside of 114 by way of a bearish candlestick pattern (entry/stop parameters can be defined by the candlestick structure).
Today’s data points: US CPI m/m/Core CPI m/m; FOMC Member Quarles Speaks.
USD/CAD:
After striking highs of 1.3263 Tuesday, its highest daily close in nearly four months, the USD/CAD came under pressure. Weighed on by broad-based USD selling, the H4 candles successfully faded a nearby Quasimodo resistance at 1.3260. Additional confluence supporting a move lower from the H4 Quasimodo resistance is the ABCD approach (black arrows) that terminated around 1.3251, the nearby channel resistance (extended from the high 1.3132) and the RSI indicator testing overbought territory.
Further supporting a downside move from the aforementioned H4 Quasimodo resistance was the level also represented daily resistance as well. From the daily scale, movement lower could potentially stretch as far south as trend line support (extended from the low 1.2782).
Well done to those who sold 1.3260, as this was a noted level to keep eyes on in Tuesday’s briefing. Reducing risk to breakeven at this point is certainly an option.
Areas of consideration:
As highlighted in yesterday’s report, the initial downside target from 1.3260 rests around the 1.32 handle. Following this, November’s opening level at 1.3158 is next in line.
Unless a second retest of 1.3260 is observed in the shape of a bearish candlestick formation today, there’s little in terms of tradable opportunity seen. To short from 1.3260, stop-loss placement remains best positioned above the H4 channel resistance (around 1.3285ish).
Today’s data points: US CPI m/m/Core CPI m/m; FOMC Member Quarles Speaks.

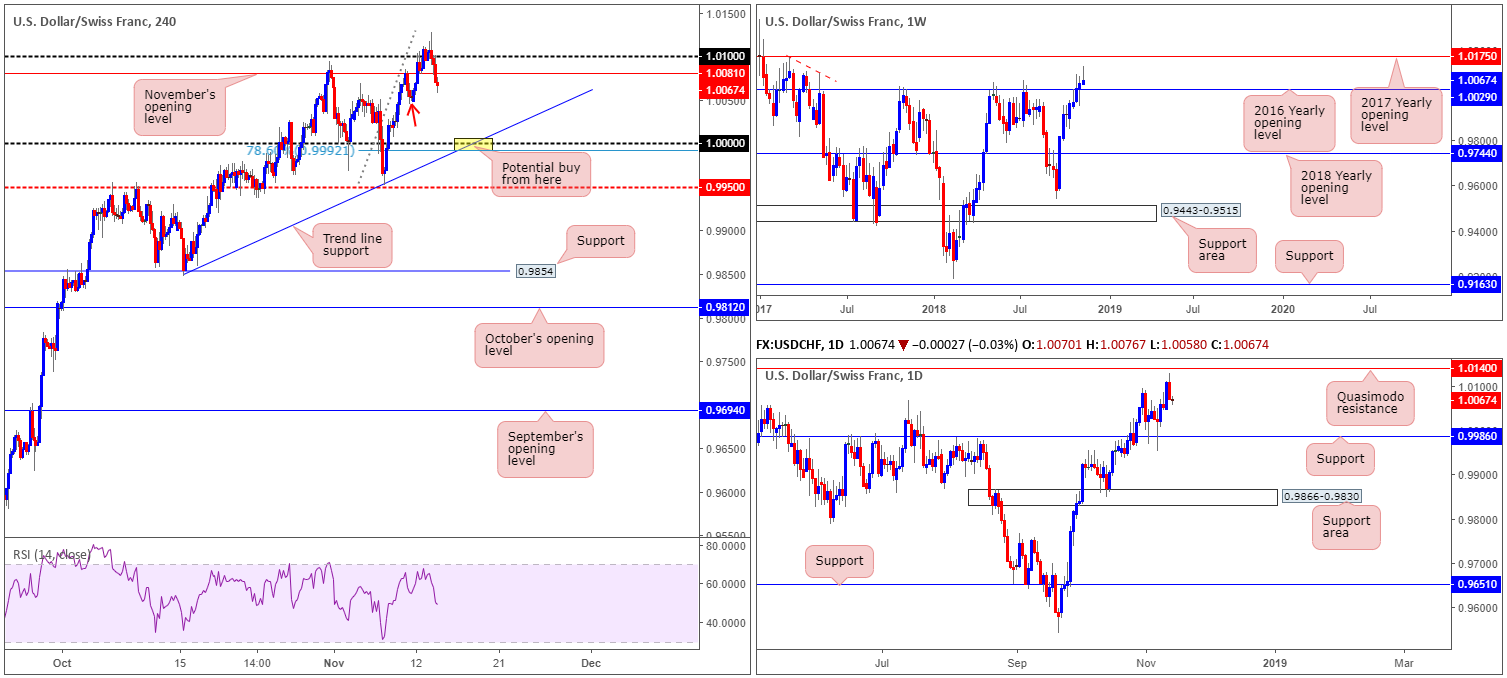
USD/CHF:
Having seen USD markets explore lower ground Tuesday, this consequently pulled the USD/CHF lower. As you can see from the H4 timeframe, the candles failed to sustain gains beyond its 1.01 point, despite reaching a high of 1.0128 amid London’s morning session.
With a truckload of sellers’ stops likely filled by the recent move to the said high, this provided liquidity for traders to sell (remember a sellers’ stop-loss order becomes a buy order once filled). Although we could possibly witness buying enter the market from H4 demand marked with a red arrow at 1.0044-1.0061, parity (1.0000) is the more appealing level, given it fuses nicely with a trend line support (etched from the low 0.9847) and a 78.6% Fib support at 0.9992.
In addition to the above, 1.0000 is seen positioned just north of daily support coming in at 0.9986. Traders will, however, want to acknowledge the 2016 yearly opening level at 1.0029 as possible support on the weekly timeframe. As a result, price action could turn higher prior to reaching 1.0000.
Areas of consideration:
Based on our technical studies, the pair is likely headed for lower ground until higher-timeframe supportive structure enters the fray. Despite the 2016 yearly opening level at 1.0029 possibly offering support, 1.0000 still remains a high probability buy zone at the point at which the aforementioned H4 trend line support merges (yellow). As psychological numbers are prone to fakeouts, traders are urged to consider waiting for candlestick confirmation to form off 1.0000 before pulling the trigger. Not only will this help avoid an unnecessary loss, it’ll provide entry/stop parameters as well.
Today’s data points: US CPI m/m/Core CPI m/m; FOMC Member Quarles Speaks.
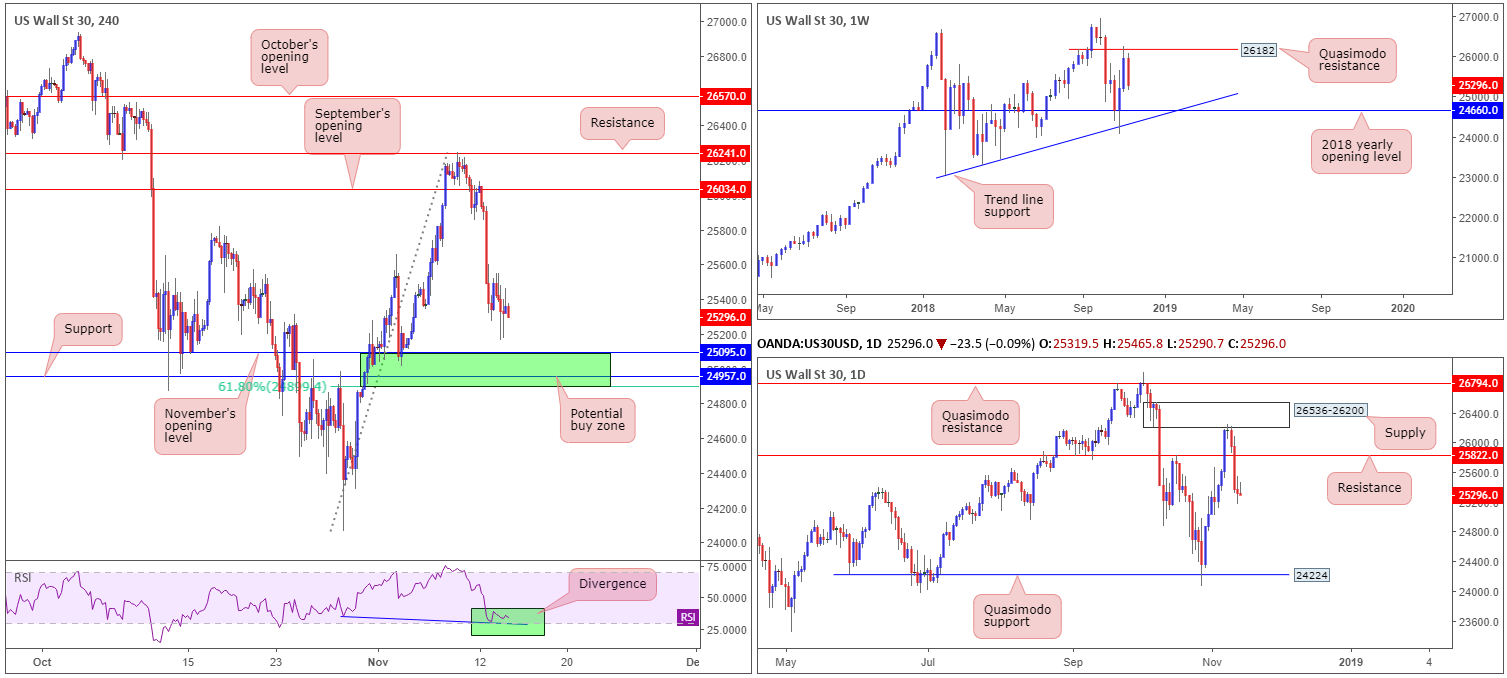
Dow Jones Industrial Average:
(Outlook remains unchanged).
Following Monday’s precipitous decline, US equities staged a reasonably modest rebound in the early hours of US trade Tuesday, though failed to preserve a bullish presence as crude oil prices weighed on energy shares.
The key observation on the H4 timeframe remains at the H4 support area marked in green at 24899/25095. Comprised of a 61.8% Fib support at 24899, a support level at 24957, November’s opening level at 25095 and the RSI indicator suggesting divergence, a bounce higher could be seen from here.
According to the weekly timeframe, however, further selling beyond the H4 support zone could be upon us. After successfully fading the Quasimodo resistance level at 26182, the chart displays room to press as far south as the 2018 yearly opening level at 24660. This is further supported on the daily timeframe. Following a healthy test of supply at 26536-26200, along with price recently engulfing at 25822 (now acting resistance), scope for a test of 24224 is seen.
Areas of consideration:
In view of the limited higher-timeframe convergence out of 24899/25095, traders may want to consider waiting for additional candlestick confirmation before pulling the trigger. Not only will this help avoid an unnecessary loss, it’ll provide entry/stop parameters.
Today’s data points: US CPI m/m/Core CPI m/m; FOMC Member Quarles Speaks.
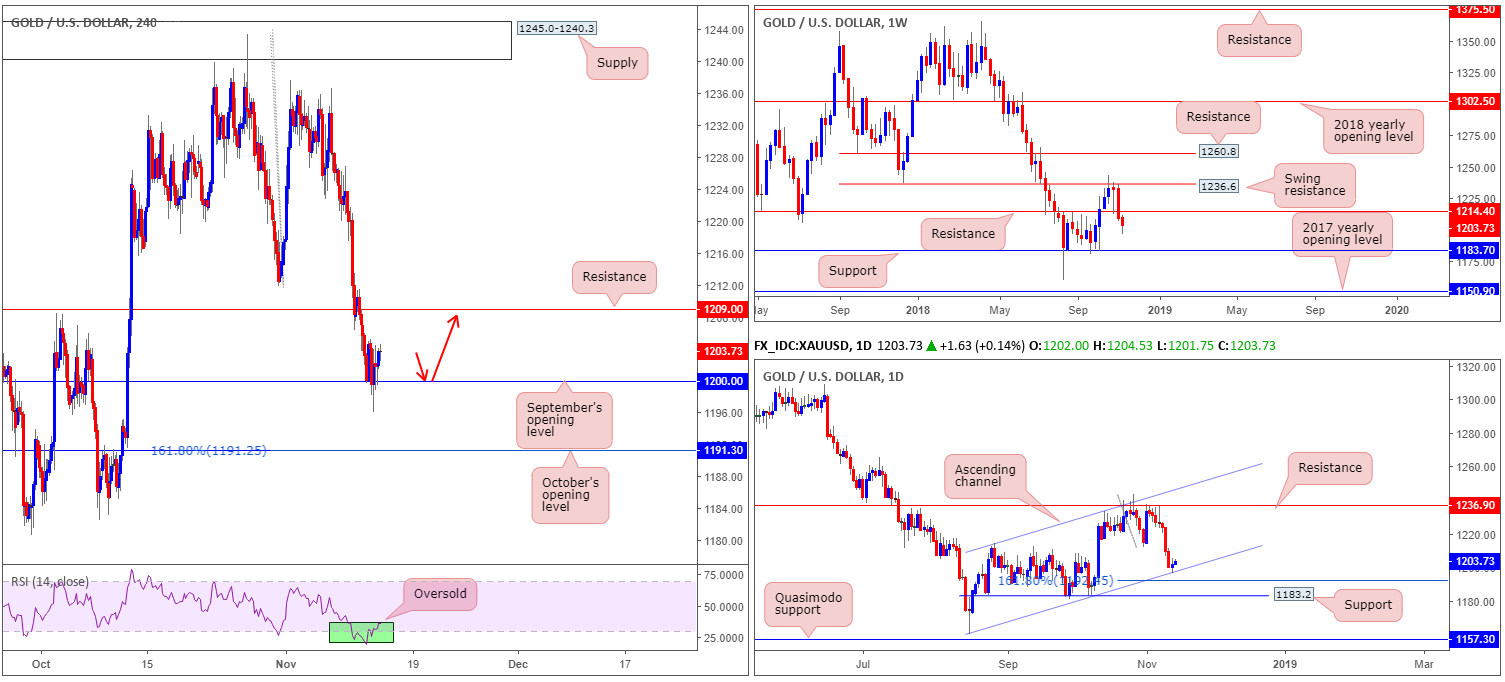
XAU/USD (Gold):
Bullion was a reasonably subdued market Tuesday, in spite of a relatively ravenous USD decline. September’s opening level at 1200.0, as you can see, remains in play, though did suffer a rather meaty fakeout to fresh lows. While weekly price indicates further selling could be on the cards in the direction of support at 1183.7, daily movement checked in with a channel support (extended from the low 1160.3) yesterday. It might also be worth noting, the H4 RSI indicator is seen recovering from oversold territory.
Should daily buyers continue to respect the current channel support, resistance at 1236.9 is in view as a possible upside target, followed by channel resistance (taken from the high 1214.3). Buying this market based on this structure, and the fact September’s opening level mentioned above at 1200.0 is holding ground, is an option today. The only downside is H4 resistance is located close by at 1209.0, which happens to be shadowed closely by weekly resistance at 1214.4 (the next upside target on this timeframe).
Areas of consideration:
In order to buy this market and satisfy risk/reward considerations, a retest of September’s opening level at 1200.0 is desirable (red arrows). Entering on the back of a bullish candlestick signal is also recommended (entry/stop parameters can be defined by the candlestick structure), since let’s not forget where price is trading on the weekly timeframe: there’s room to press beyond 1200.0.
As mentioned above, nearby upside targets from 1200.0 reside at 1209.0 and 1214.4.
The use of the site is agreement that the site is for informational and educational purposes only and does not constitute advice in any form in the furtherance of any trade or trading decisions.
The accuracy, completeness and timeliness of the information contained on this site cannot be guaranteed. IC Markets does not warranty, guarantee or make any representations, or assume any liability with regard to financial results based on the use of the information in the site.
News, views, opinions, recommendations and other information obtained from sources outside of www.icmarkets.com.au, used in this site are believed to be reliable, but we cannot guarantee their accuracy or completeness. All such information is subject to change at any time without notice. IC Markets assumes no responsibility for the content of any linked site. The fact that such links may exist does not indicate approval or endorsement of any material contained on any linked site.
IC Markets is not liable for any harm caused by the transmission, through accessing the services or information on this site, of a computer virus, or other computer code or programming device that might be used to access, delete, damage, disable, disrupt or otherwise impede in any manner, the operation of the site or of any user’s software, hardware, data or property.


