
A note on lower timeframe confirming price action…
Waiting for lower timeframe confirmation is our main tool to confirm strength within higher timeframe zones, and has really been the key to our trading success. It takes a little time to understand the subtle nuances, however, as each trade is never the same, but once you master the rhythm so to speak, you will be saved from countless unnecessary losing trades. The following is a list of what we look for:
- A break/retest of supply or demand dependent on which way you’re trading.
- A trendline break/retest.
- Buying/selling tails/wicks – essentially we look for a cluster of very obvious spikes off of lower timeframe support and resistance levels within the higher timeframe zone.
- Candlestick patterns. We tend to stick with pin bars and engulfing bars as these have proven to be the most effective.
We search for lower timeframe confirmation between the M15 and H1 timeframes, since most of our higher-timeframe areas begin with the H4. Stops are usually placed 5-10 pips beyond confirming structures.
EUR/USD:
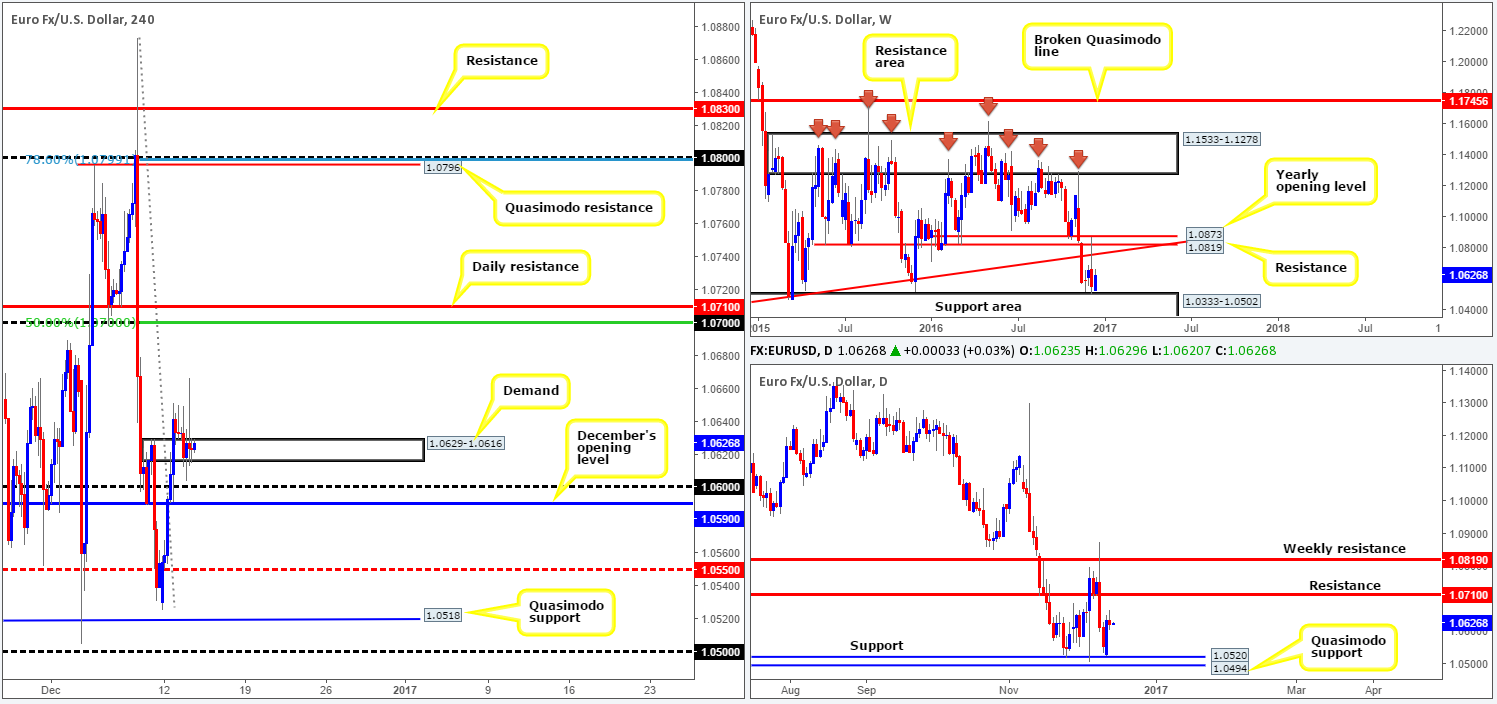
For the most part, direction was rather limited during yesterday’s sessions. H4 supply turned-demand at 1.0629-1.0616, as you can see, held firm but did, nevertheless, suffer a slight breach mid-way through the London morning segment, as the H4 candles attempted to link with the 1.06 handle. As highlighted in yesterday’s report, both the weekly and daily charts show scope to advance north. The closest obstacle can be seen on the daily scale around 1.0710: a resistance level. This – coupled with the H4 upside also being relatively free, the shared currency is likely to catch a bid in the coming sessions. As a result, the pair could look to target the 1.07 handle, which fuses beautifully with the 50.0% Fib resistance and is suitably positioned just ahead of the above noted daily resistance line.
Fundamentally, nonetheless, there are a truckload of news events on the docket today that could possibly alter the technical landscape. Of note is today’s FOMC decision. Pricing for a December rate hike is now pegged at 95% according to the
Our suggestions: While a long from the current H4 demand base is tempting given that there is little standing in the way of a rally, we would still recommend waiting for at least a reasonably sized H4 bull candle to form to confirm bullish intent. This is to avoid the possibility of a fakeout down to 1.06 and perhaps December’s opening level nearby at 1.0590.
Furthermore, holding this position beyond the 1.07 handle is chancy, in our view. The reason is due to the confluence surrounding this number as mentioned above, and as such it would be considered a viable sell zone! However, DO remain aware of the fundamentals today, guys, and try to not initiate any trades 30 minutes pre/post listed events.
Data points to consider: US retail sales/PPI reading at 1.30pm, Industrial production and capacity utilization rate at 2.15pm and finally the FOMC interest-rate statement and press conference at 7-7.30pm GMT.
Levels to watch/live orders:
- Buys: 1.0629-1.0616 ([reasonably sized H4 bullish close required prior to pulling the trigger] stop loss: ideally beyond the trigger candle).
- Sells: Flat (stop loss: N/A).
GBP/USD:
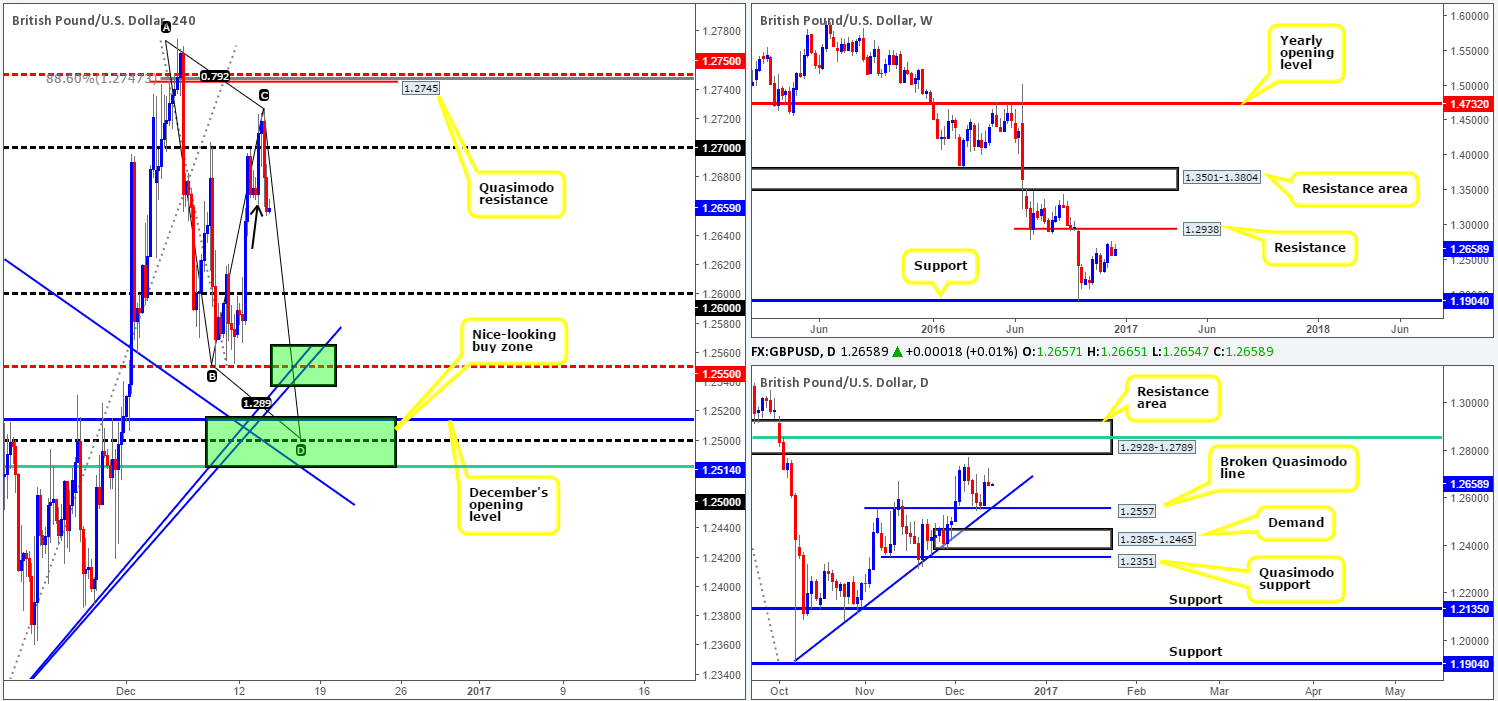
Underpinned by a better-than-expected UK inflation print, yesterday’s action saw the GBP squeeze shorts out from the 1.27 boundary as well as fill breakout buyers’ orders. Be that as it may, the pair failed to push much past this region, reaching highs of only 1.2727 before collapsing to lows of 1.2653 throughout the course of the US session. In view of price breaking below the H4 pivot marked with a black arrow at 1.2660, sterling could continue to press lower today down to at least 1.26.
Over on the bigger picture, however, the weekly chart shows the possibility of rallying higher to check in with resistance at 1.2938. Meanwhile, daily action is seen currently lodged mid-range between a resistance area coming in at 1.2928-1.2789 (houses a 61.8% Fib resistance level at 1.2853) and a broken Quasimodo support line at 1.2557 that intersects nicely with a trendline support drawn from the low 1.1904.
Our suggestions: With the above points in mind, there are two areas that catch our eye this morning:
- The H4 mid-way support at 1.2550. This level boasts two H4 trendline supports taken from the lows 1.2113/1.2301 and is located nearby the aforementioned daily broken Quasimodo support line. However, trading this area places one at risk of a fakeout down to our next area of interest (see point 2). Therefore, wait at least for a reasonably sized H4 bullish candle to form before pressing the buy button.
- Between December’s opening level at 1.2514 and the H4 61.8% Fib support at 1.2481 holds not only a psychological support at 1.25 which converges with a H4 AB=CD bull pattern, there’s also a H4 trendline support extended from the high 1.2673 intersecting with this barrier. Granted, a trade from this area does mean that a slight fakeout beyond the above said daily broken Quasimodo support is required. Dependent on the time of day, this zone holds enough confluence, at least in our book, to justify a long position without the need to wait for other confirmation.
From a fundamental standpoint, both currencies boast market-moving events today, specifically in the US with the FOMC set to make a decision on interest rates. Therefore, remain vigilant trading this pair today!
Data points to consider: UK employment data at 9.30am, followed by BoE Gov. Carney taking the stage at 12.15pm. US retail sales/PPI reading at 1.30pm, Industrial production and capacity utilization rate at 2.15pm and finally the FOMC interest-rate statement and press conference at 7-7.30pm GMT.
Levels to watch/live orders:
- Buys: 1.2550 region ([reasonably sized H4 bullish close required prior to pulling the trigger] stop loss: ideally beyond the trigger candle). 1.2505 ([dependent on the time of day, a buy from this area without the need for confirmation is high probability] stop loss 1.2476).
- Sells: Flat (stop loss: N/A).
AUD/USD:
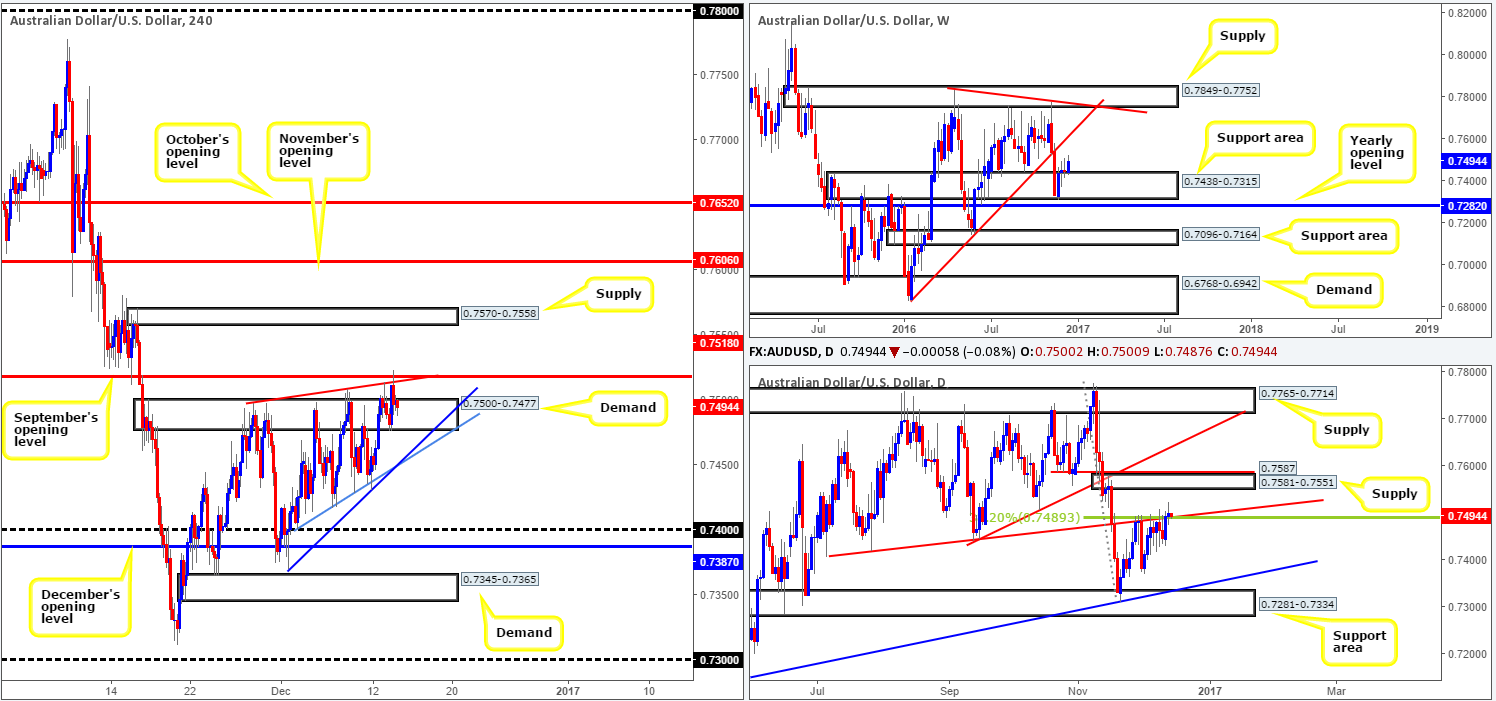
Amid yesterday’s London morning segment, the commodity currency attracted fresh buyers into the market and rose to connect with September’s opening level at 0.7518. Holding firm, this level has, as you can see, forced the H4 candles back into a supply turned demand at 0.7500-0.7477.
According to the weekly chart, the pair remains bid from the support area chiseled in at 0.7438-0.7315. A continuation move higher from this angle could force price to connect with a trendline resistance stretched from the low 0.6827. On the other side of the coin, however, daily price continues to flirt with the trendline resistance extended from the low 0.7407 that ties in nicely with a 38.2% Fib resistance at 0.7489 (taken from the high 0.7778).
Our suggestions: To confirm further upside, we require a H4 close above September’s opening level at 0.7518. This would not only likely clear offers from the aforementioned daily trendline resistance and also clear upside on the H4 to supply at 0.7570-0.7558, but it would further validate bullish strength from the weekly support area mentioned above. To that end, a H4 close beyond 0.7518, followed by a retest and a lower timeframe buy signal (see the top of this report for ideas on how to utilize the lower-timeframe action) would, in our estimation, be enough to buy this market, targeting the above said H4 supply zone. However, traders may want to exercise caution today given the fact that we have a heavy schedule of market-moving events ahead of us today in the US, including the FOMC rate decision.
Data points to consider: US retail sales/PPI reading at 1.30pm, Industrial production and capacity utilization rate at 2.15pm and finally the FOMC interest-rate statement and press conference at 7-7.30pm GMT.
Levels to watch/live orders:
- Buys: Watch for a H4 close above 0.7518 and then look to trade any retest seen thereafter ([lower-timeframe confirmation required following the retest] stop loss: dependent on where one confirms the area).
- Sells: Flat (stop loss: N/A).
USD/JPY:
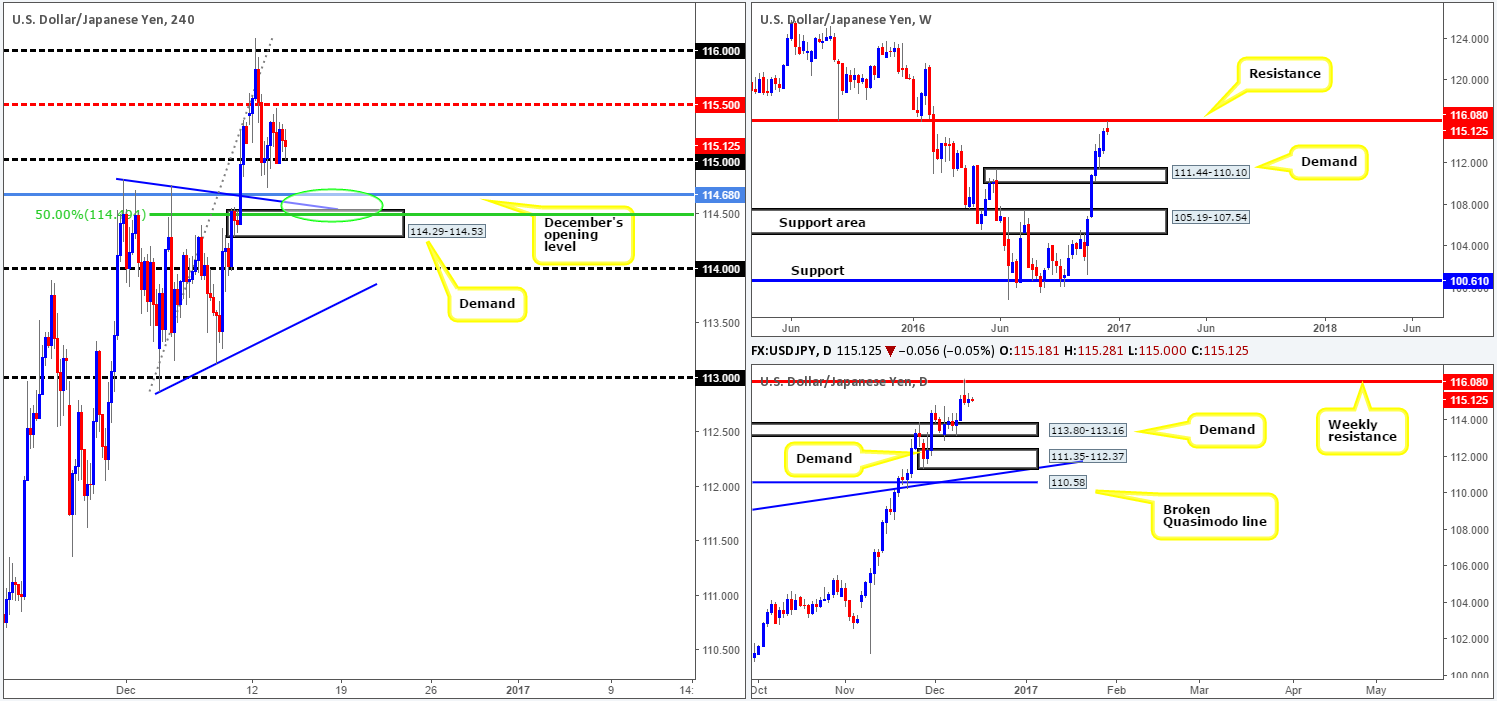
The USD/JPY spent the majority of yesterday bouncing from the 115 psychological support, with price only managing to clock highs of 115.47 on the day. While this level is seen holding ground, our desk feels it may be on the verge of giving way.
Of late, weekly action tagged resistance coming in at 116.08, which shows room on both the weekly and daily charts to extend lower. The closest higher-timeframe obstacle can be seen at a daily demand base drawn from 113.80-113.16, followed closely by another daily demand at 111.35-112.37.
Despite bigger-picture direction, below 115 sits December’s opening level at 114.68 along with a H4 trendline support extended from the high 114.82, and a H4 demand area at 114.29-114.53 (green circle). Now, given that the closest higher-timeframe support is seen around daily demand at 113.80-113.16, a fakeout through the above said H4 confluence down to the 114 neighborhood is a strong possibility (114 sits 20 pips above the top edge of the nearest daily demand).
Our suggestions: Although a bounce is likely to be seen from the above noted H4 structures today, our team will humbly pass trading from here. The risk of a loss is just too great given the overwhelming weekly resistance in play right now. Furthermore, some of today’s action could potentially sideline the technicals, especially considering that we have the FOMC taking the spotlight later on concerning interest rates.
Data points to consider today: US retail sales/PPI reading at 1.30pm, Industrial production and capacity utilization rate at 2.15pm and finally the FOMC interest-rate statement and press conference at 7-7.30pm GMT.
Levels to watch/live orders:
- Buys: Flat (stop loss: N/A).
- Sells: Flat (stop loss: N/A).
USD/CAD:
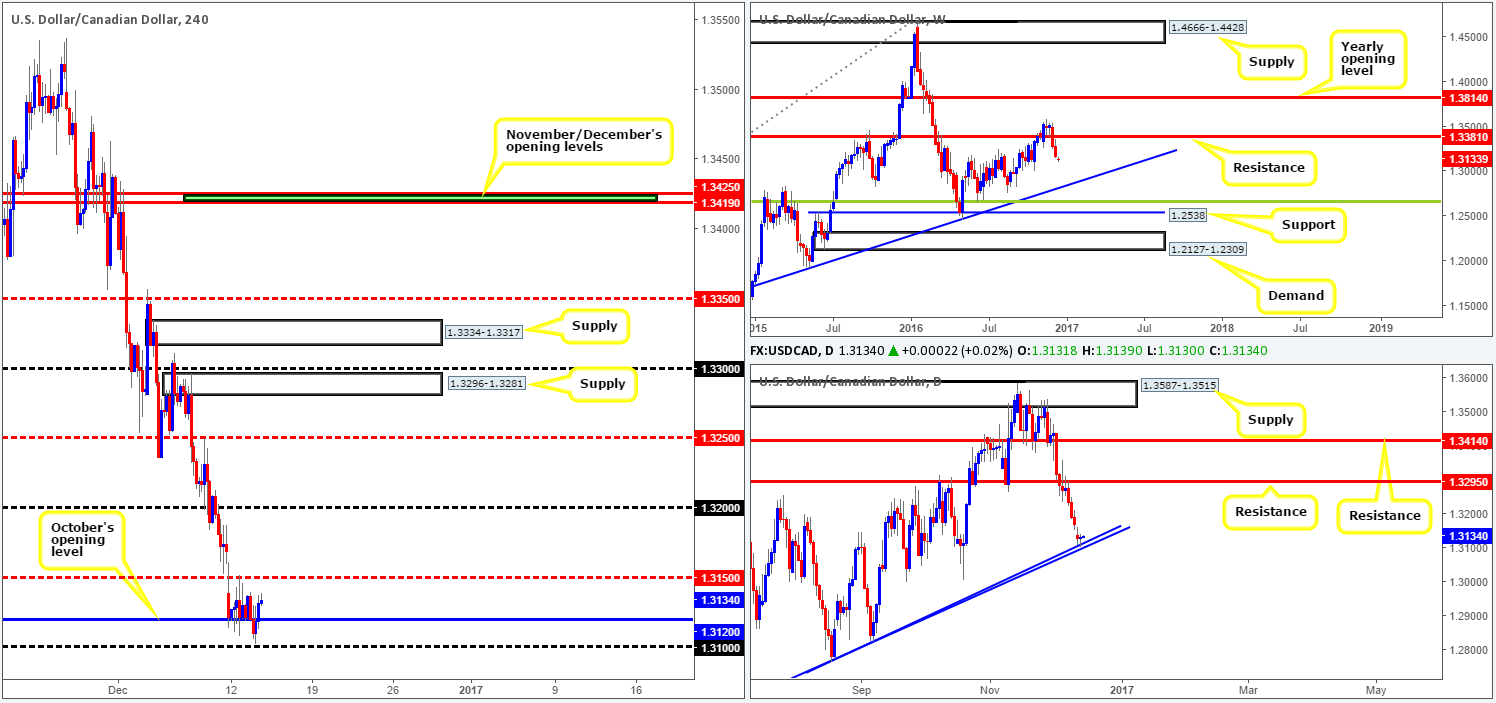
As can be seen from the H4 chart this morning, October’s opening level at 1.3120 continued to hold going into yesterday’s London session. Though, as US traders entered the fray the US dollar was offered, consequently breaking through the monthly level and coming within striking distance of connecting with the 1.31 band. It was from this point that we saw the bulls come into the picture and drive the unit back above the monthly base into the closing bell.
This end-of-day correction was bolstered by two nearby daily trendline supports etched from the lows 1.2460/1.2763. Should the bulls continue to defend this line, the next daily upside target to have an eye on is resistance coming in at 1.3295. Be that as it may, on the weekly chart there’s little seen stopping the loonie from continuing lower this week down to the trendline support taken from the high 1.1278.
Our suggestions: In Tuesday’s report our desk mentioned that should a reasonably strong-looking H4 bull candle take shape from the 1.31/1.3120 region, it would be sufficient enough to condone a buy order. Price has extended nicely from this zone in recent hours and is close to achieving its first take-profit target of 1.3150. Well done to any of our readers who managed to pin down an entry here!
To further confirm buying, however, we require a decisive close to be seen above 1.3150. This – coupled with a retest and a reasonably sized H4 bull candle would be enough evidence for a buy, targeting the 1.32 handle as an immediate take-profit zone. The reason we feel it best to wait for a H4 bull candle to form is simply due to weekly action suggesting that further selling may be on the cards (see above).
In addition to the above, technicals could also be affected today given the heavy round of news events on the US docket today, especially the FOMC decision.
Data points to consider today: US retail sales/PPI reading at 1.30pm, Industrial production and capacity utilization rate at 2.15pm and finally the FOMC interest-rate statement and press conference at 7-7.30pm GMT.
Levels to watch/live orders:
- Buys: Watch for a H4 close above 1.3150 and then look to trade any retest seen thereafter ([reasonably sized H4 bull candle required following the retest] stop loss: ideally beyond the trigger candle).
- Sells: Flat (stop loss: N/A).
USD/CHF:
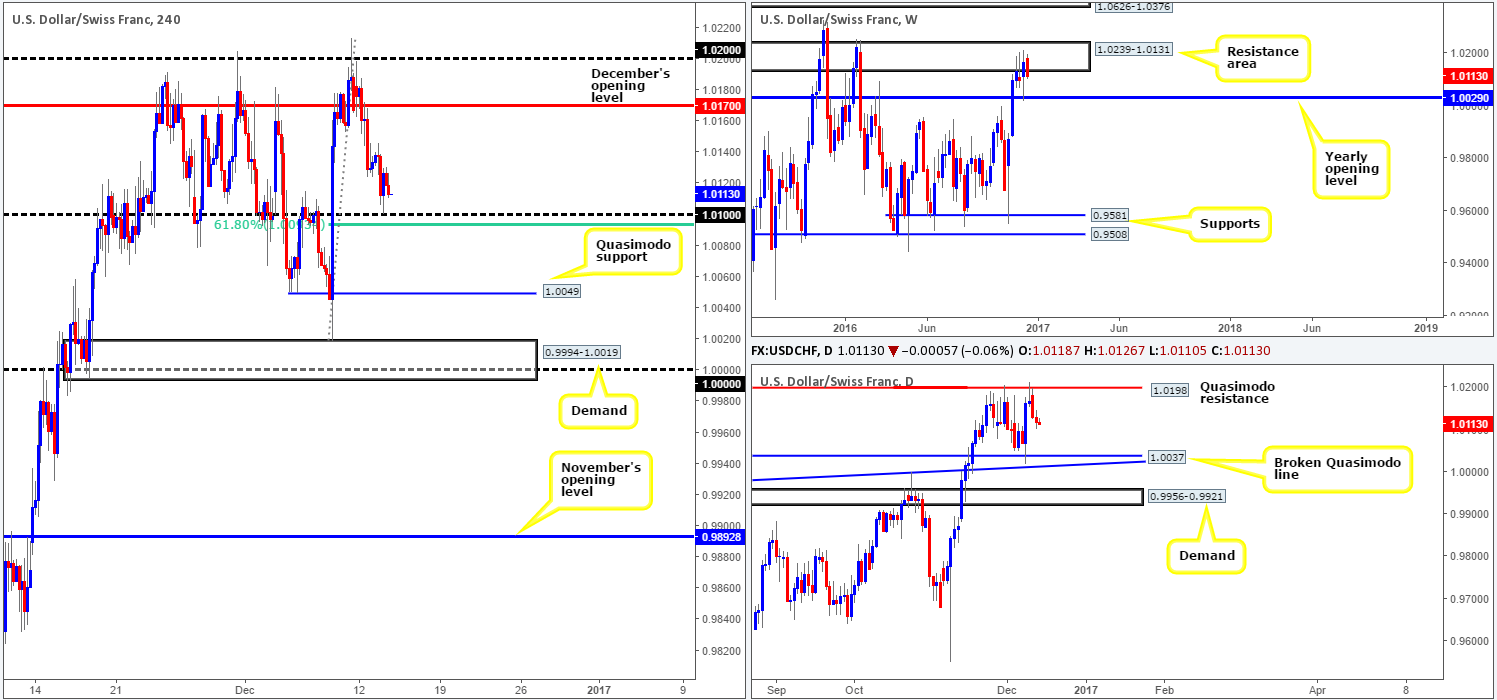
Coming at you from the top this morning, the weekly candles show that the bears are presently in the driving seat at the moment from within the walls of a resistance area seen at 1.0239-1.0131. The next downside objective from here falls in at 1.0029: a 2016 yearly opening level. Along the same vein, the daily candles continue to reflect a bearish stance following Monday’s rebound from the Quasimodo resistance level seen at 1.0198 (lodged within the above said weekly resistance area).
Looking over to the H4 chart on the other hand, the 1.01 handle is currently bid. Despite this number being strengthened by H4 support seen over on the US dollar index at 100.78 and a H4 61.8% Fib just below 1.01 at 1.0093; the pressure from the bigger-picture structures may just be too overwhelming for the buyers here.
Our suggestions: On account of the US dollar being in the spotlight today (FOMC), and the fact that there is little higher-timeframe confluence supporting a buy from the 1.01 region, our desk has decided that the best course of action is to look for sells beyond 1.01, rather than buys. Below the 1.01 neighborhood, the H4 Quasimodo support at 1.0049 is the next downside hurdle to be aware of, shadowed closely by the daily broken Quasimodo line at 1.0037 (next downside target on that scale) and then the above said yearly opening level.
Data points to consider today: US retail sales/PPI reading at 1.30pm, Industrial production and capacity utilization rate at 2.15pm and finally the FOMC interest-rate statement and press conference at 7-7.30pm. Swiss PPI reading at 8.15am GMT.
Levels to watch/live orders:
- Buys: Flat (stop loss: N/A).
- Sells: Watch for a H4 close below 1.01 and then look to trade any retest seen thereafter ([reasonably sized H4 bear candle required following the retest] stop loss: ideally beyond the trigger candle).
DOW 30:
The US equity market continued to thump its way higher yesterday, reaching a record high of 19954. With the 20000 mark now in sight and the FOMC interest-rate statement just around the corner, where do we see this index trading to? Well, given that pricing for a December rate hike sits at 95% according to the CME group Fed Watch tool, this action would, in our opinion, signal confidence in the US economy and likely force stocks beyond the 20000 point!
Now, technically speaking we see only one nearby zone on the table: a H4 demand base at 19747-19774. An area which has little connection to the higher-timeframe picture, other than it formed within the current uptrend!
On that note, from the weekly timeframe we can see that should the market pullback, the demand area at 18808-18971 that converges with trendline support taken from the high 18365 is where we believe the index could withdraw to on this scale. Looking a little lower down on the curve, the daily candles reveal that the next support hurdle in the mix, should a retracement be seen, is planted at 19071-19151 (seen above the aforementioned weekly demand).
Our suggestions: In that the above noted H4 demand looks reasonably strong; our team will be keeping a close eye on this barrier during today’s trading. Along with the backing of a reasonably sized H4 bull candle, we would feel comfortable buying from here on the basis of it forming in such a strong uptrend. A decisive push below this boundary on the other hand, could be an early cue to a move back down to H4 demand at 19611-19642.
Data points to consider today: US retail sales/PPI reading at 1.30pm, Industrial production and capacity utilization rate at 2.15pm and finally the FOMC interest-rate statement and press conference at 7-7.30pm GMT.

Levels to watch/live orders:
- Buys: 19747-19774 ([reasonably sized H4 bullish close required prior to pulling the trigger] stop loss: ideally beyond the trigger candle).
- Sells: Flat (stop loss: N/A).
GOLD:
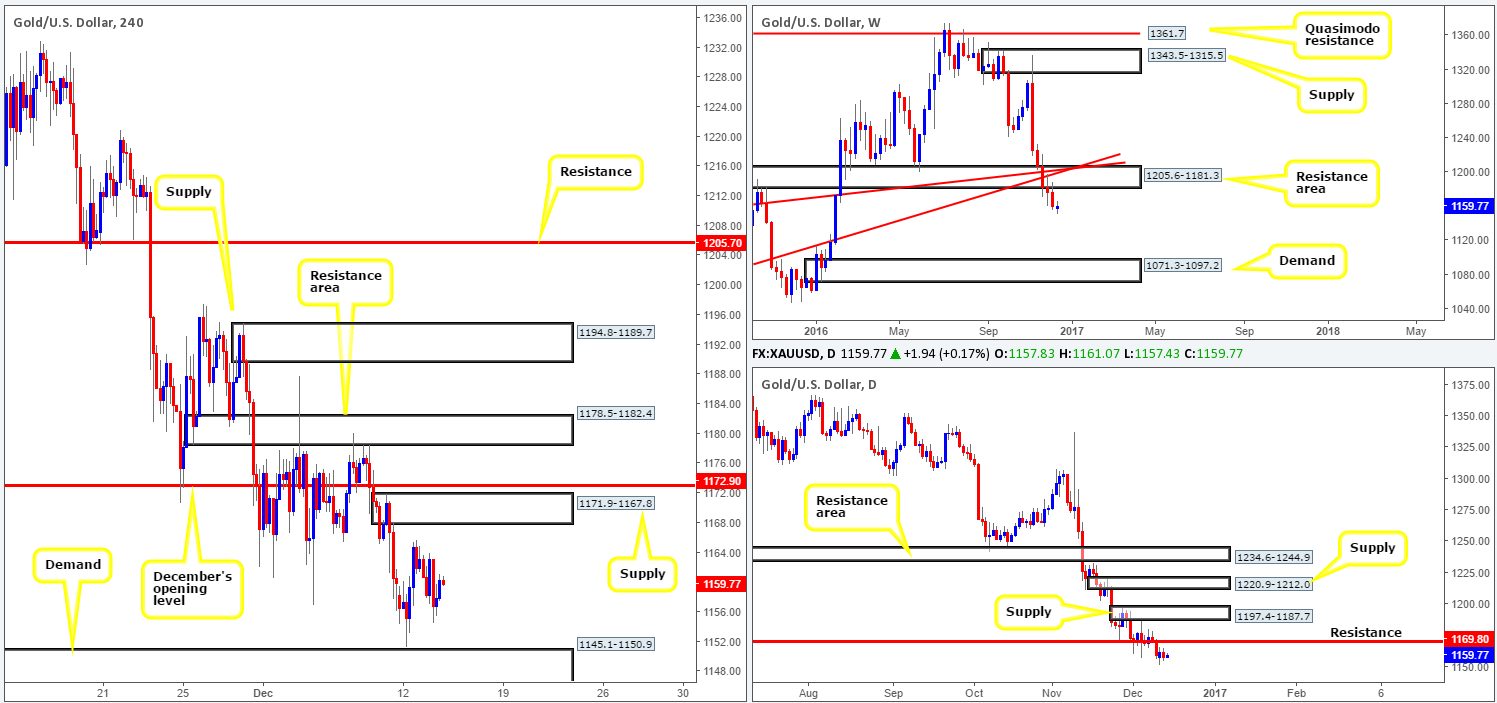
In recent sessions, we can see that the yellow metal loitered between the H4 supply zone at 1171.9-1167.8 and a H4 demand base coming in at 1145.1-1150.9. Over on the weekly chart, nonetheless, bullion continues to reflect a strong bearish stance. After price ran through bids at the weekly support area drawn from 1205.6-1181.3 (now acting resistance), the spotlight is now drawn to 1071.3-1097.2: a weekly demand area that claims strong bullish momentum from its base. Looking down to the daily candles, the unit continues to trade just below resistance seen at 1169.8, opening up the possibility for a run down to daily demand visible at 1108.2-1117.8.
Our suggestions: In that the current H4 supply area is reasonably fresh, and houses the daily resistance line at 1169.8 within, a short from here is tempting. Nevertheless, traders need to be prepared for the likelihood of a fakeout through this zone, since there are possibly a collection of unfilled orders lurking just above around December’s opening barrier at 1172.9. To trade short from the supply, our personal recommendation would be to wait for the bears to confirm interest. Usually, when there is adequate space for price to move, as there is here, our desk waits for a H4 confirming candle (in this case bearish) to form. Should this come to fruition, a short, given the above points on the higher-timeframe structures, is valid, targeting the aforementioned H4 demand area, and possibly even lower as the higher timeframes currently suggest.
Levels to watch/live orders:
- Buys: Flat (stop loss: N/A).
- Sells: 1171.9-1167.8 ([reasonably sized H4 bearish close required prior to pulling the trigger] stop loss: ideally beyond the trigger candle).


