
A note on lower timeframe confirming price action…
Waiting for lower timeframe confirmation is our main tool to confirm strength within higher timeframe zones, and has really been the key to our trading success. It takes a little time to understand the subtle nuances, however, as each trade is never the same, but once you master the rhythm so to speak, you will be saved from countless unnecessary losing trades. The following is a list of what we look for:
- A break/retest of supply or demand dependent on which way you’re trading.
- A trendline break/retest.
- Buying/selling tails/wicks – essentially we look for a cluster of very obvious spikes off of lower timeframe support and resistance levels within the higher timeframe zone.
- Candlestick patterns. We tend to only stick with pin bars and engulfing bars as these have proven to be the most effective.
We search for lower timeframe confirmation between the M15 the H1 timeframes, since most of our higher-timeframe areas begin with the H4. Stops are usually placed 5-10 pips beyond confirming structures.
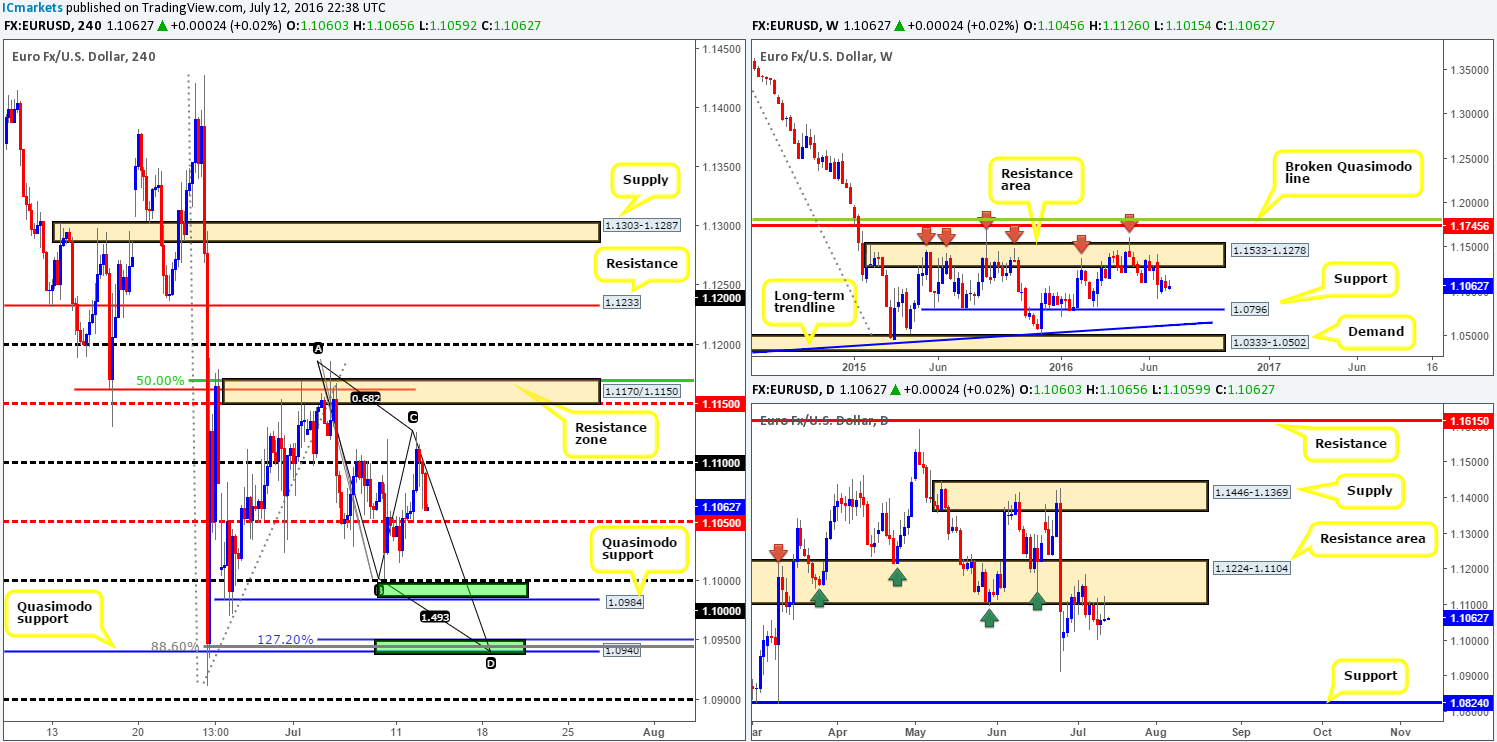
EUR/USD:
Despite improved risk sentiment during yesterday’s Asia session, the pair ended the day unchanged, settling just ahead of the H4 mid-way support barrier 1.1050. This, as you can see over on the daily chart, printed a nice-looking selling wick due to price rotating from the underside of a daily resistance area at 1.1224-1.1104. Apart from the referendum low at 1.0911, there’s little daily support stopping this market from reaching the daily support chalked in at 1.0824.
Although daily action shows potential to continue much lower, as well as the weekly chart also showing space to drop down to weekly support at 1.0796, there are two strong-looking barriers of support on the H4 where price is likely to bounce from (green zones):
- The minor H4 Quasimodo support at 1.0984 coupled with the key figure 1.10.
- The larger H4 Quasimodo support at 1.0940. Not only did the H4 candles bounce from this line during the ‘Brexit’ fallout (indicating strong support), it also fuses with a H4 AB=CD completion point taken from the high 1.1186, a H4127.2% Fib extension (1.0950) and a deep H4 88.6% Fib support at 1.0945.
Our suggestions: Keep an eye on both of the aforementioned H4 support barriers today for potential long positions. We are confident a bounce will be seen from these areas, but would still advise traders to trade cautiously since higher timeframe structure does not really favor these areas (see above).
Levels to watch/live orders:
- Buys: 1.0964/1.0984 [Tentative – confirmation required] (Stop loss: dependent on where one confirms this area). 1.0926/1.0940 [Tentative – confirmation required] (Stop loss: dependent on where one confirms this area).
- Sells: Flat (Stop loss: N/A).
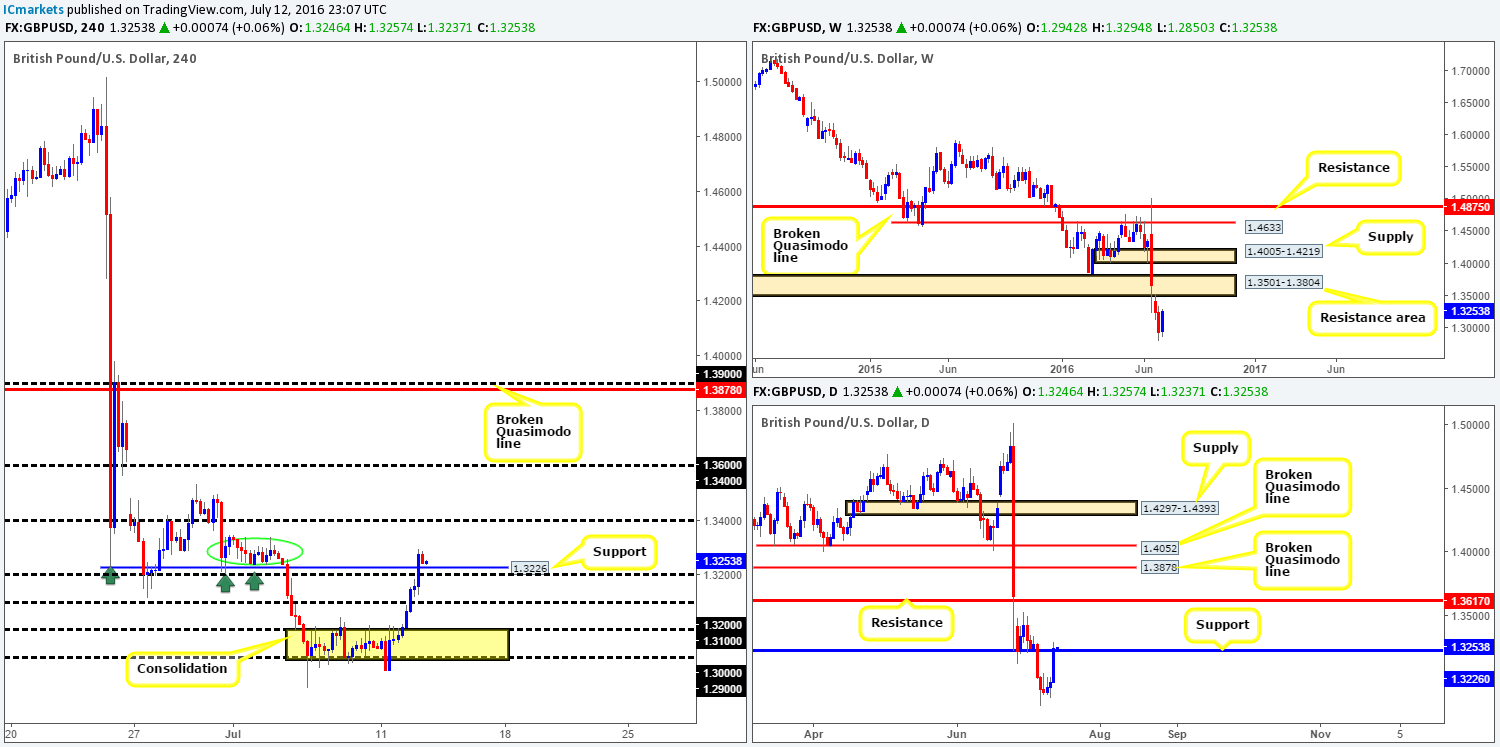
GBP/USD:
Based on recent H4 price action, we can see that strong buyers stepped in during yesterday’s sessions as the political situation seems to be easing in the UK, consequently driving the GBP over 260 pips higher (open/close). Three handles were wiped out amid this assault, ending with the market closing above a H4 resistance level at 1.3226, which should theoretically now act as support.
Despite cable slightly closing above daily resistance at 1.3253 (now acting support), along with some leeway seen on the weekly chart for prices to continue advancing up to the weekly resistance area at 1.3501-1.3804, buying this market may be a possibility.
Our suggestions: Watch for price to retest the 1.32 handle/H4 support at 1.3226 area for a possible long entry, targeting the 1.34 line. However, we would strongly recommend waiting for lower timeframe confirmation to form at this zone (see the top of this report), since to the left of current price there’s a lot of wood to chop through seen at 1.3349/1.3240 (green circle) before price can reach the 1.34 zone.
Levels to watch/live orders:
- Buys: 1.32/1.3226 [Tentative – confirmation required] (Stop loss: dependent on where one confirms this area).
- Sells: Flat (Stop loss: N/A).
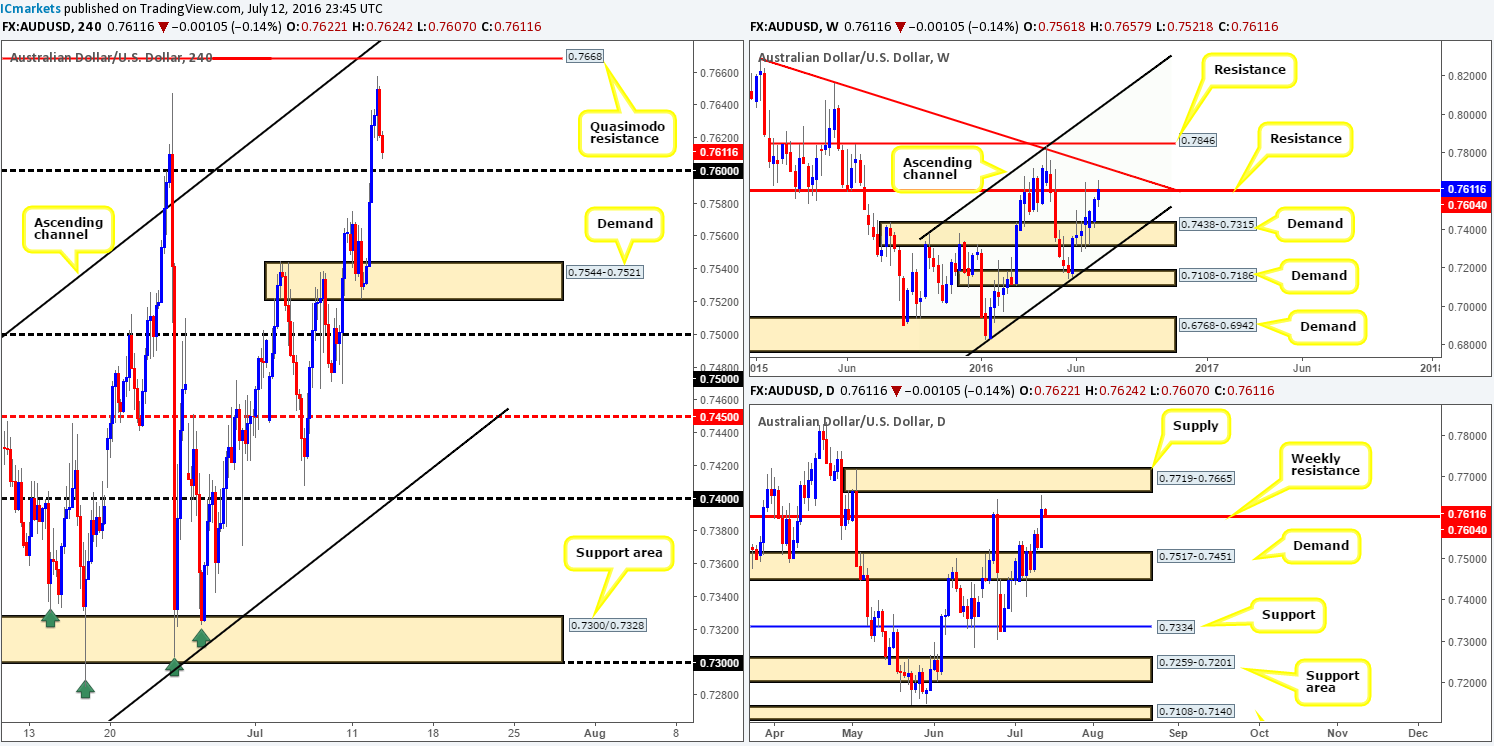
AUD/USD:
(Trade update: Stopped out at 0.7649 – see previous report for details)
The commodity currency managed to find its feet early on in the day, as the pair attracted fresh buyers from within H4 demand registered at 0.7544-0.7521. The psychological boundary 0.76 was absolutely obliterated going into the early hours of European trade, with price just missing the H4 Quasimodo resistance barrier at 0.7668 by a nat’s hair during US trade.
As price is now seen retreating from yesterday’s highs, how do things stand on the higher timeframes? Well, the buyers and sellers over on the weekly chart are now clashing around the weekly resistance level at 0.7604. Down on the daily chart, however, yesterday’s buying saw the Aussie surpass the aforementioned weekly resistance line and come within touching distance of connecting with a daily supply zone drawn from 0.7719-0.7665.
Our suggestions: To our way of seeing things, we have two potential trade setups here:
- In the event that the H4 closes below the 0.76 handle, this would confirm bearish strength from the above said weekly resistance line. With that being said, following a close lower, a retest of 0.76 would need to be seen coupled with a lower timeframe sell signal (see the top of this report). Only then would our team be permitted to short, targeting the H4 demand at 0.7544-0.7521, followed closely by the 0.75 handle.
- The other alternative is to wait and see if price continues to advance higher. Our team would then focus on looking to short the H4 Quasimodo resistance line mentioned above at 0.7668 as it converges nicely with the underside of daily supply at 0.7719-0.7665. Waiting for lower timeframe confirmation is recommended but given the higher timeframe convergence, a market order with a stop placed above the daily supply is also something to consider.
Levels to watch/live orders:
- Buys: Flat (Stop loss: N/A).
- Sells: Watch for price to consume the 0.76 handle and look to trade any retest seen thereafter (lower timeframe confirmation required). 0.7668 region [Market entry is possible as long as one is willing to place their stops above the daily supply area at 0.7719-0.7665] (Stop loss: 0.7723).
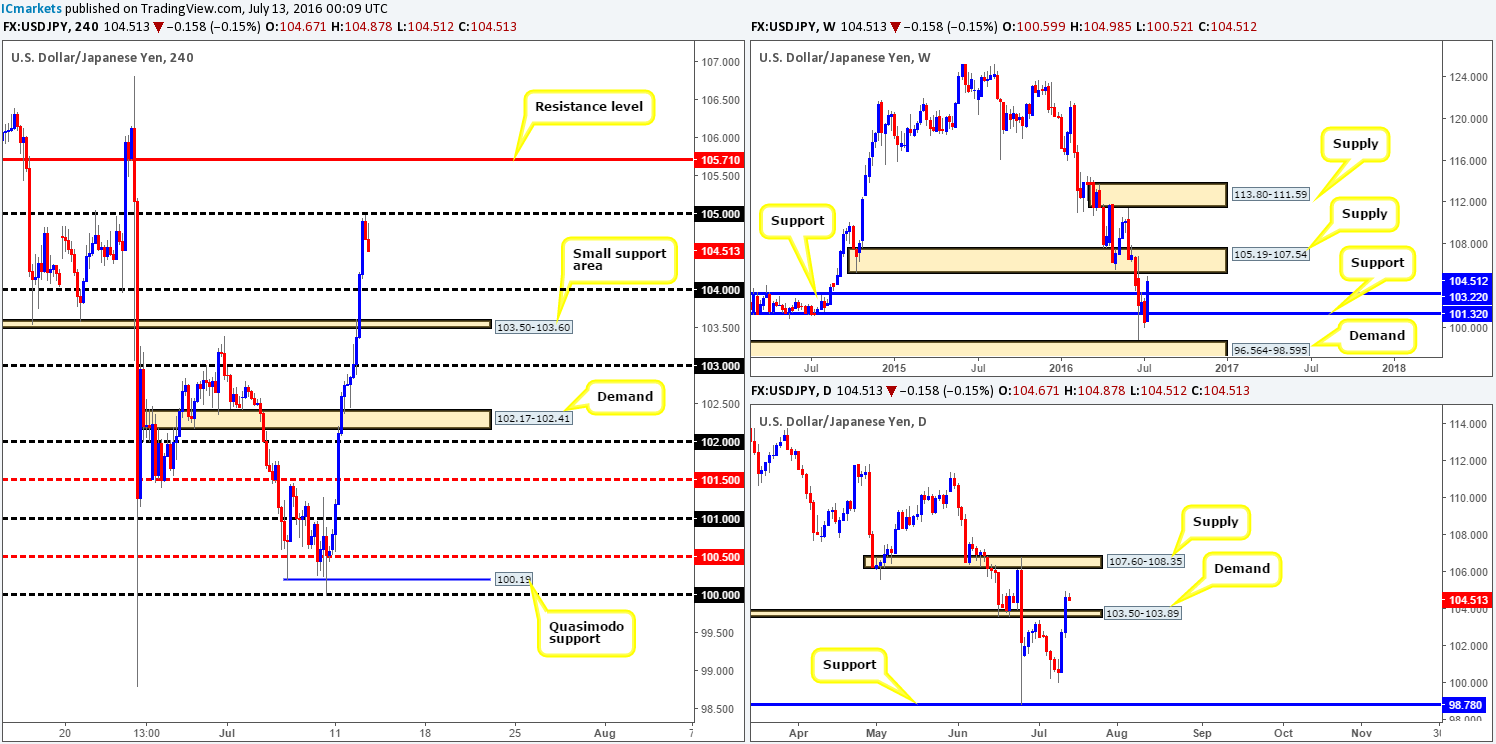
USD/JPY:
Given the clear risk-on environment at the moment and expectations of further stimulus by the Japanese government, the USD/JPY pair rallied around 200 pips for a second consecutive day yesterday! It was only once price came within two pips of connecting with the 105 handle going into the American afternoon session, did we see things begin to settle down.
Looking over to the weekly chart, we can see that there is room for price to rally twenty or so pips higher up to the underside of a weekly supply at 105.19-107.54. Daily action on the other hand, thanks to yesterday’s round of buying, shows that there’s room for further upside towards daily supply coming in at 107.60-108.35.
Our suggestions: In that there is room for this market to rally north on the higher timeframe charts, selling from 105 does not really tickle our fancy. A level we do have our eye on, however, is the H4 resistance line logged in at 105.17 since it is lodged within the boundaries of the above said weekly supply. Of course, it is down to the individual trader how he/she looks to trade these levels. We prefer to take the conservative route and wait for the lower timeframes to show a sign that the market is interested (see the top of this report), as this has saved us from countless losses in the past and continues to be the forefront of our trading plan.
Levels to watch/live orders:
- Buys: Flat (Stop loss: N/A).
- Sells: 105.71 region [Tentative – confirmation required] (Stop loss: dependent on where one confirms this area).
USD/CAD:
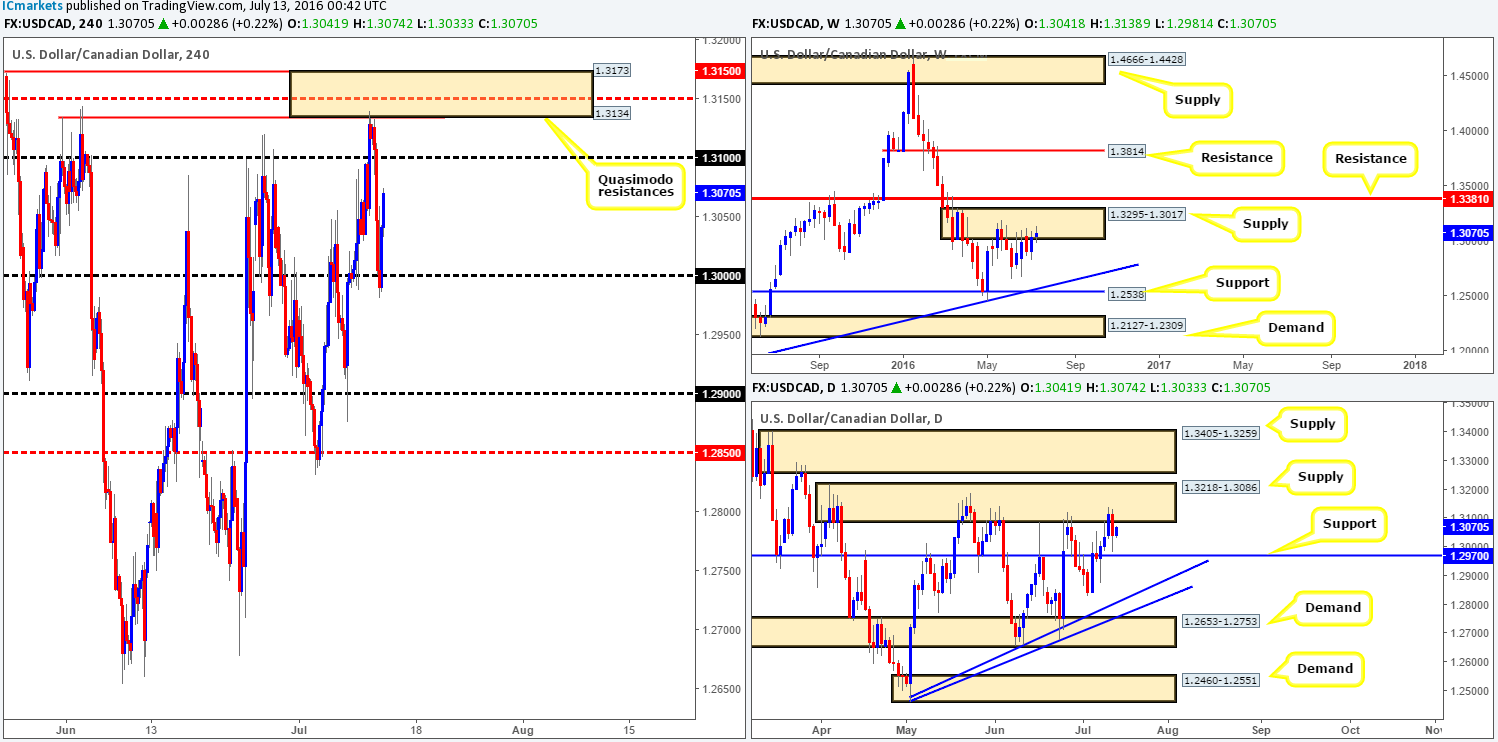
Starting from the top, the weekly chart shows that price has been seen clinging to the underside of a weekly supply base at 1.3295-1.3017 for the past four weeks. Although this is a relatively newly-formed area, it has managed to cap upside in this market since the 16th May. Before the weekly candles can slide lower, however, daily support at 1.2970 will need to be consumed. This would likely clear the path for a continuation move down to a daily trendline support taken from the low 1.2460.
Stepping across to the H4 chart, the key figure 1.30 did a sound job in providing this market support going into yesterday’s US trading session, which at the time of writing, has allowed traders to bid price up to the 1.3070 region.
Our suggestions: As far as we can see, one could look for shorts either around the 1.31 handle, or again between 1.3173/1.3134 (green zone) today. This zone is comprised of two H4 Quasimodo resistances, which also houses a H4 mid-way resistance line drawn from 1.3150. Each trader, of course, will have their own methods to validate levels. In our case, when unsure, we usually resort to waiting for lower timeframe confirmation (see the top of this report).
Levels to watch/live orders:
- Buys: Flat (Stop loss: N/A).
- Sells: 1.31 region [Tentative – confirmation required] (Stop loss: dependent on where one confirms this area). 1.3173/1.3134 [Tentative – confirmation required] (Stop loss: dependent on where one confirms this area).
USD/CHF:
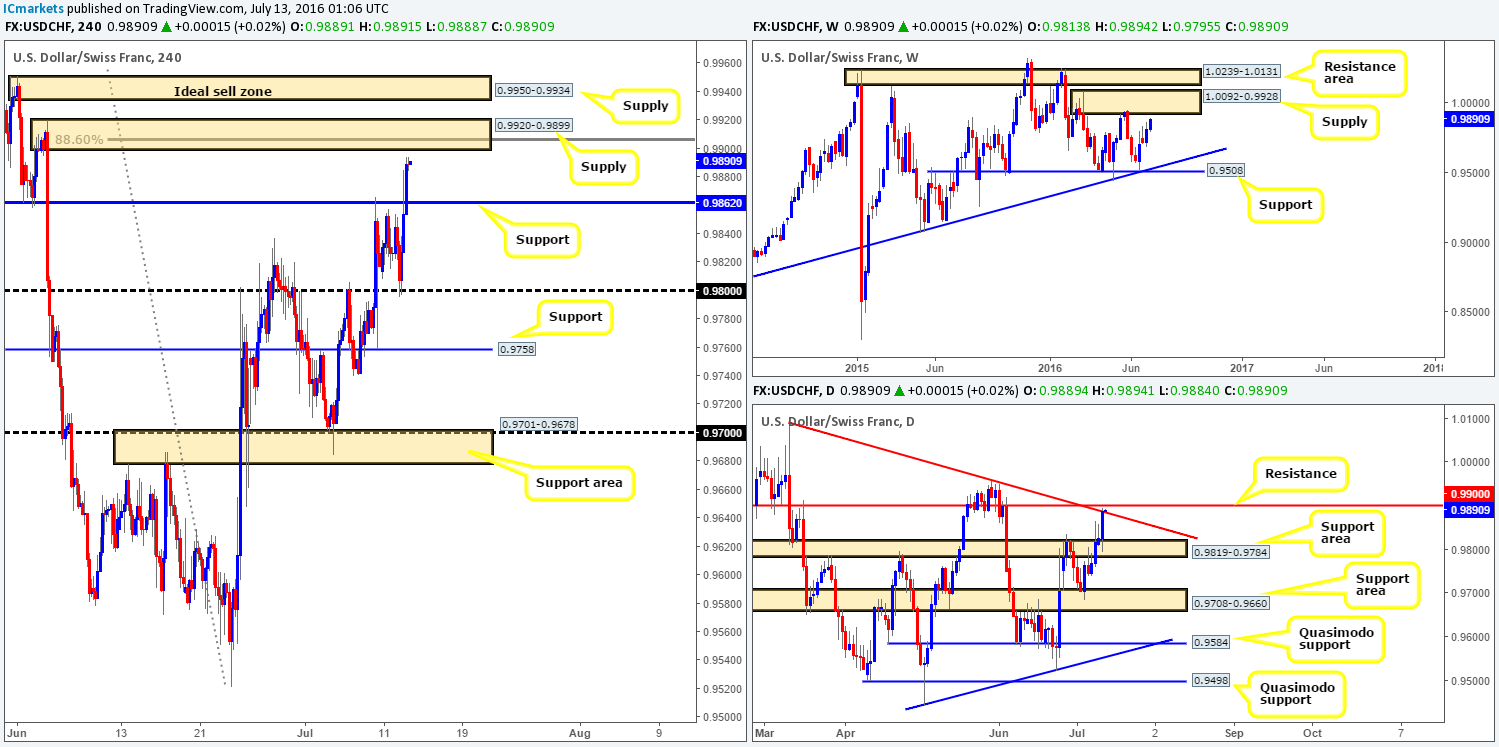
With the EUR/USD recently driving lower, it came as no surprise to see that the USD/CHF had rallied. The Swissy struck the 0.98 handle as London opened their doors for business yesterday, resulting in price taking out H4 resistance at 0.9862 (now acting support) and ending the day just ahead of a H4 supply base at 0.9920-0.9899.
Now, before we get into potential trade setups for today, let’s run over the higher timeframe picture so that we know where we stand in the overall scheme of things. Up on the weekly chart, the current candle is trading within shouting distance of a weekly supply area carved from 1.0092-0.9928. Meanwhile, down in the pits of the daily chart, the buyers and sellers are seen battling for position around a daily resistance level coming in at 0.9900, bolstered by a daily trendline resistance taken from the high 1.0092.
The two H4 supply areas marked at 0.9950-0.9934/ 0.9920-0.9899 remain a focal point for our team today. The upper zone is located within the aforementioned weekly supply area, whilst the lower area sits just beneath it. Nevertheless, the lower zone boasts a deep H4 88.6% Fib resistance level at 0.9906, a psychological number at 0.99 which let’s not forget also represents daily resistance (see above).
Our suggestions: The lower H4 supply area at 0.9920-0.9899 is attractive due to its converging structures and will very likely bounce price lower. Nevertheless, we feel the best area to look for shorts is the H4 supply seen just above it at 0.9950-0.9934, given its position on the weekly timeframe (see above). One can only imagine how many traders are looking to short the lower H4 supply due to its confluence. As such, there are likely to be a truckload of stops above this barrier ripe for the taking!
With that being said, our team has placed a pending order to sell just below the upper H4 supply at 0.9931 with our stop set just above the area at 0.9954. It will be interesting to see how this pans out!
Levels to watch/live orders:
- Buys: Flat (Stop loss: N/A).
- Sells: 0.9931 [Pending order] (Stop loss: 0.9957).
DOW 30:
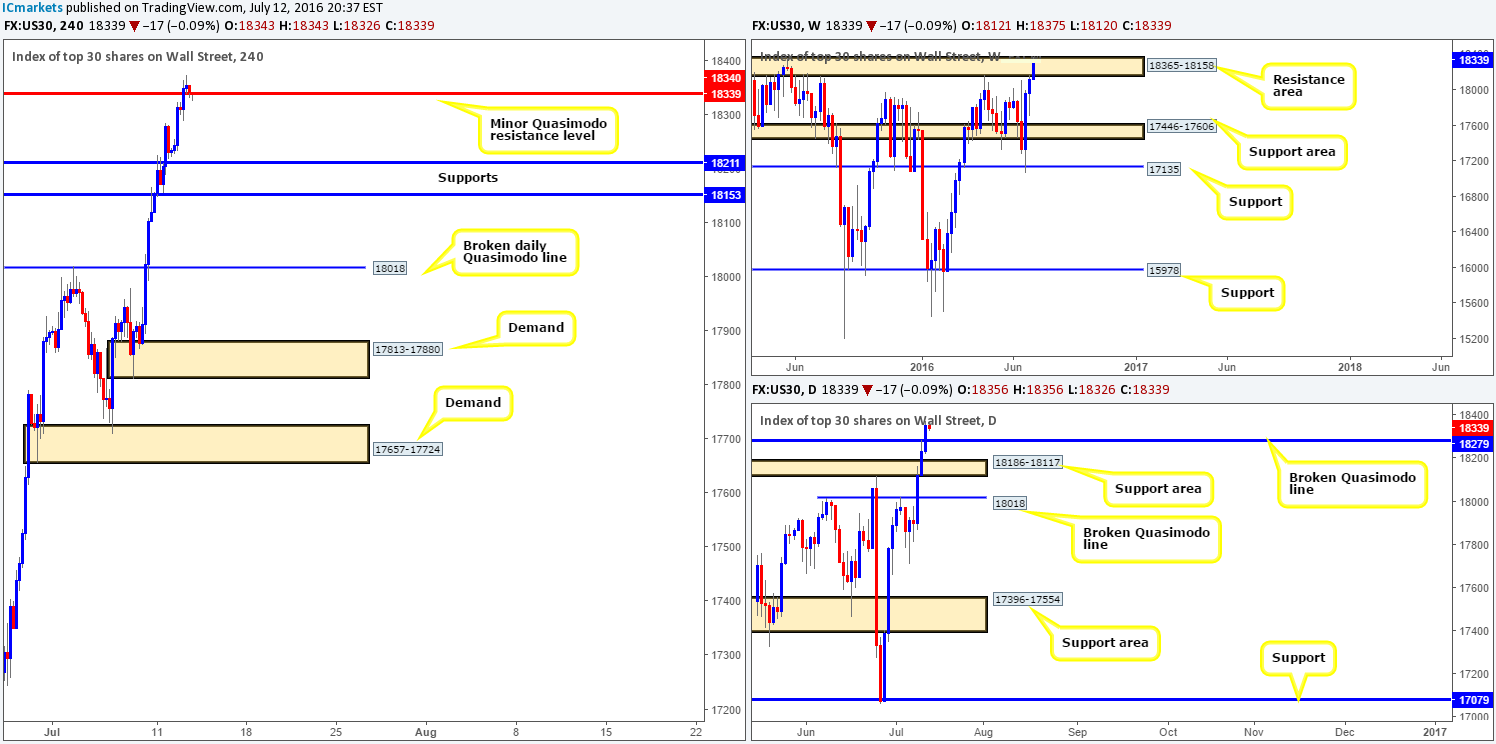
From the weekly chart, we can see that the bulls continue to dig in deep and push the DOW higher. As of this point, price is testing the upper edge of a weekly resistance area coming in at 18365-18158, which has held prices lower since February 2015! A weekly close above this zone could see the seven-year trend in this market begin posting higher highs once again. Yesterday’s round of buying saw offers wiped out from the daily Quasimodo resistance line at 18279, thus further confirming the possibility of further upside.
Turning our attention to the H4 chart, the minor H4 Quasimodo resistance level at 18340 looks to be holding firm at the moment, despite price spiking to highs of 18375! If price is able to reach H4 support at 18211 from here, then we believe the sellers still have a fighting chance to bring this market lower.
Our suggestions: With there being no clear direction as of yet, we feel trading this market would be as good as tossing a coin. As such, our team’s position will remain flat for now and we’ll reassess going into tomorrow’s action.
Levels to watch/live orders:
- Buys: Flat (Stop loss: N/A).
- Sells: Flat (Stop loss: N/A).
Gold:
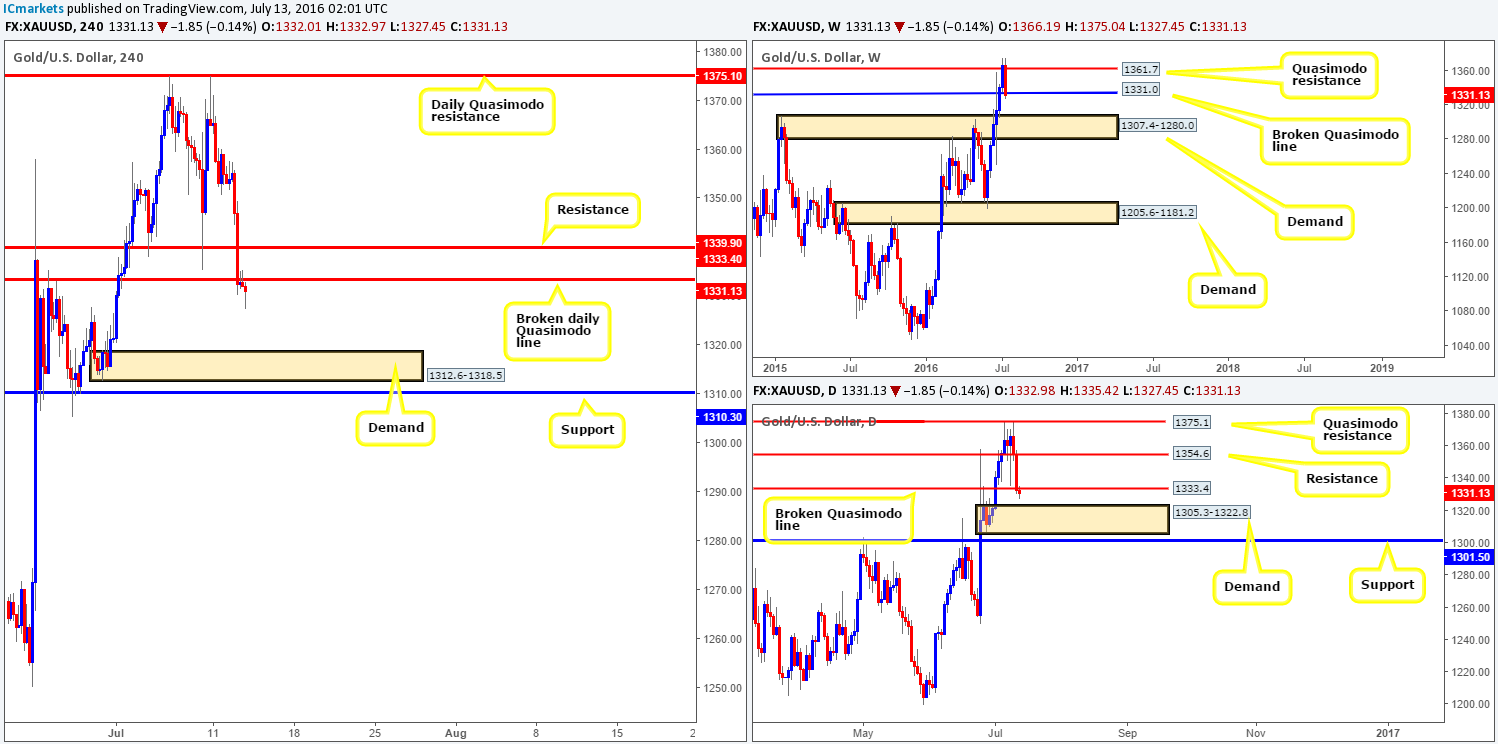
Investors continued to dump the safe-haven metal yesterday, as sentiment has shown a marked improvement. However, it was not until London opened its doors for business did we see gold dive lower. The selling continued throughout the London trading session, and only began showing signs of slowing as London closed for the day. H4 support at 1339.9 along with the broken daily Quasimodo line at 1333.4 were both taken out during this onslaught. Beyond these levels, the river south appears to be ripple free down to H4 demand at 1312.6-1318.5.
Our suggestions: Look for the yellow metal to retest the underside of the recently broken daily Quasimodo line at 1333.4. This – coupled with a lower timeframe sell signal (see the top of this report), is a high-probability trade in our book, with a target objective seen at the above said H4 demand, followed closely by the H4 support at 1310.3.
In addition to the above, the weekly chart shows that bids are struggling around the weekly broken Quasimodo line at 1331.0, thus price could potentially drive down to weekly demand at 1307.4-1280.0. What’s more, there is room for price to decline further on the daily chart down to daily demand at 1305.3-1322.8, which houses the aforementioned H4 demand base.
Levels to watch/live orders:
- Buys: Flat (Stop loss: N/A).
- Sells: 1333.4 region [Tentative – confirmation required] (Stop loss: dependent on where one confirms this area).


