
.A note on lower timeframe confirming price action…
Waiting for lower timeframe confirmation is our main tool to confirm strength within higher timeframe zones, and has really been the key to our trading success. It takes a little time to understand the subtle nuances, however, as each trade is never the same, but once you master the rhythm so to speak, you will be saved from countless unnecessary losing trades. The following is a list of what we look for:
- A break/retest of supply or demand dependent on which way you’re trading.
- A trendline break/retest.
- Buying/selling tails – essentially we look for a cluster of very obvious spikes off of lower timeframe support and resistance levels within the higher timeframe zone.
- Candlestick patterns. We tend to only stick with pin bars and engulfing bars as these have proven to be the most effective.
For us, lower timeframe confirmation starts on the M15 and finishes up on the H1, since most of our higher timeframe areas begin with the H4. Stops usually placed 5-10 pips beyond your confirming structures.
EUR/USD:
Despite the single currency breaking above H4 supply at 1.1451-1.1425 during the London open yesterday, price remains locked between this area and a broken H4 Quasimodo support line at 1.1338. Seeing as how this has been the case since the beginning of this month, our outlook for this pair remains the same…
Over on the weekly chart, we have price trading, or should we say ‘loitering’, within supply coming in at 1.1533-1.1278. Despite the lack of selling interest seen within this supply zone, this area has managed to hold price lower since May 2015 on five occasions, so the bulls still likely have their work cut out for them if they want to push higher.
Down on the daily chart, yet another indecision candle formed yesterday between demand seen at 1.1385-1.1332 and a Quasimodo resistance level coming in overhead at 1.1460. A break below this demand could prompt a move towards demand penciled in at 1.1143-1.1187, whilst a push above the Quasimodo likely suggests further weakness within the current weekly supply.
In light of this information here is what we have jotted down for today’s sessions:
- Trading either side of the current H4 consolidation is something traders may want to consider. Nevertheless, we would recommend only doing so with lower timeframe confirmation since fakeouts are common within ranging environments such as this.
- An alternative method to trading this market would be to wait to see if the H4 candles can close below the current H4 range demand, and the 1.1300 line. This would place one in a favorable position to look for shorts on any retest seen to the underside of 1.1300, targeting H4 demand at 1.1168-1.1190 (see black arrows), which sits on top of daily demand mentioned above at 1.1143-1.1187.
Alongside this, let’s also keep in mind that by shorting the underside of 1.1300, we’d be trading in-line with weekly flow (see above). Furthermore, a close below 1.1300 would very likely force daily action to close beneath the current daily demand, thus, as we’ve already mentioned above, opening the path south towards daily demand at 1.1143-1.1187.
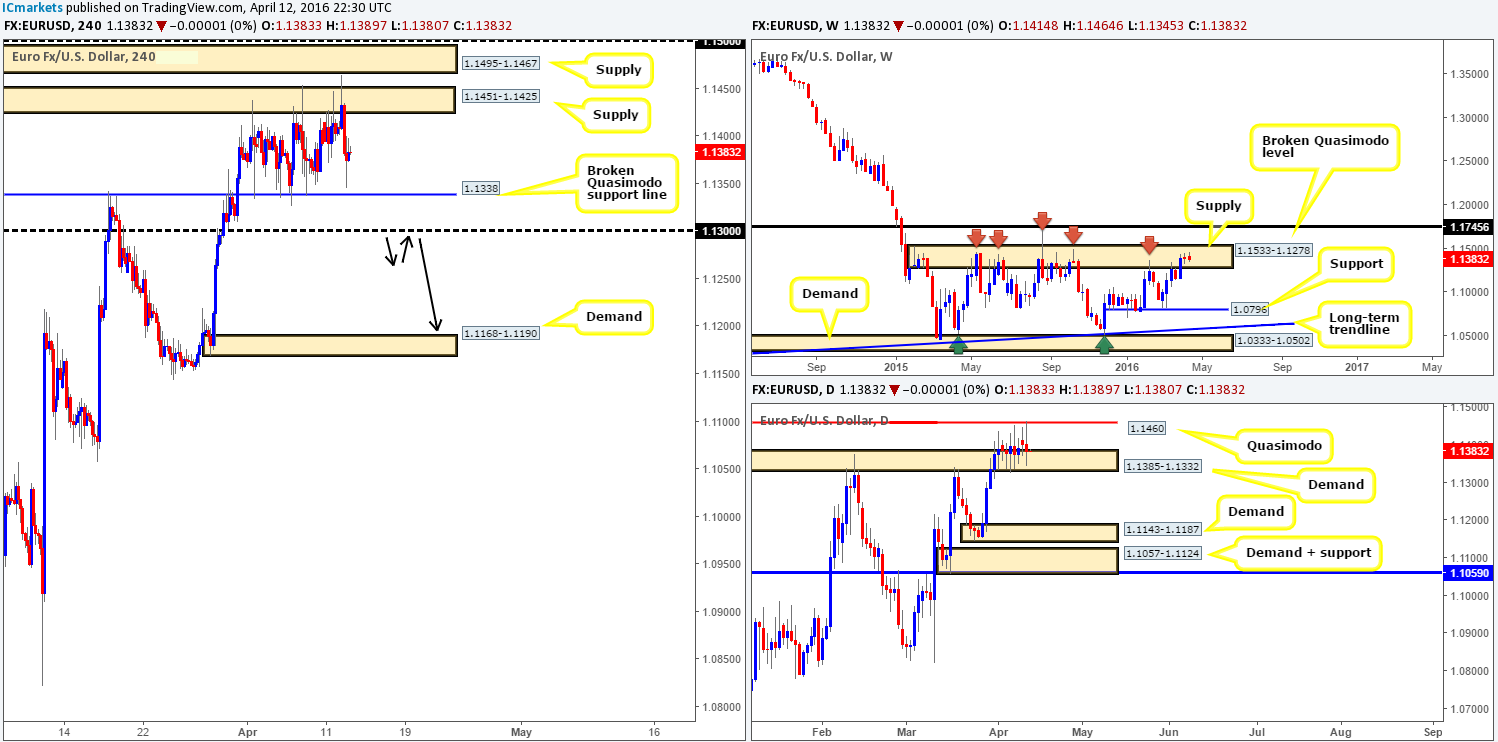
Levels to watch/live orders:
- Buys: 1.1338 [Tentative – confirmation required] (Stop loss: dependent on where one confirms this level).
- Sells: 1.1451-1.1425 [Tentative – confirmation required] (Stop loss: dependent on where one confirms this area). Watch for price to consume 1.1300 and look to trade any retest seen thereafter (lower timeframe confirmation required).
GBP/USD:
Using a top-down approach this morning, we can see that weekly bids remain relatively strong from the broken Quasimodo support line at 1.4051. From this angle, we see upside potential towards a broken Quasimodo resistance level coming in at 1.4633. By contrast, daily action appears to be closing in on supply formed from a reaction to previous supply (1.4578-1.4467) at 1.4459-1.4380.
Sliding down to the H4 chart, yesterday’s London open saw this pair aggressively cut through offers at 1.4300. This, as you can see, just missed connecting with the mid-level hurdle 1.4350 before collapsing south to test the 1.4200 barrier at the U.S open, which naturally saw price change tracks reaching highs of 1.4275 by the close.
At this moment, there is very little that jumps out to us with ‘trade me’ written on it. The H4 supply at 1.4426-1.4384 is interesting, however, due to it being lodged within daily supply mentioned above at 1.4459-1.4380. In addition to this, the H4 support coming in at 1.4163 looks attractive as it ties in with a 61.8% Fibonacci support at 1.4156. Both of these barriers, at least for us, would still require lower timeframe confirmation (for confirmation techniques see the top of this report) since shorting from supply would place you against weekly flow (see above), and entering long from a fixed support opens the door to a possible fakeout.
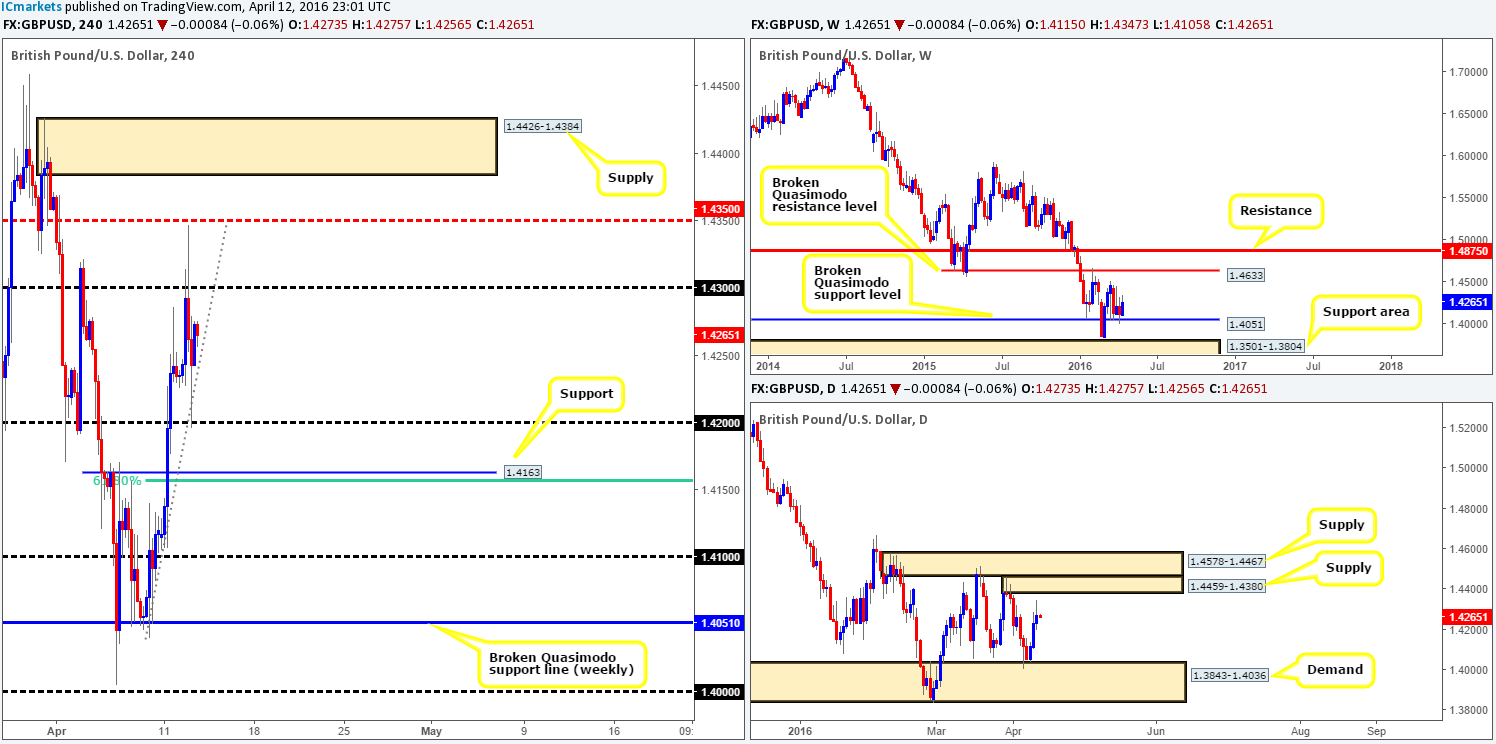
Levels to watch/live orders:
- Buys: 1.4163 [Tentative – confirmation required] (Stop loss: dependent on where one confirms this level).
- Sells: 1.4426-1.4384 [Tentative – confirmation required] (Stop loss: dependent on where one confirms this area).
AUD/USD:
The weekly resistance 0.7604 and the 61.8% Fibonacci level at 0.7646 are once again under attack! In the event that these barriers finally give way, all eyes will be on the 0.7846 line – a relatively nice-looking resistance. Casting our lines down into the daily chart, nevertheless, supply at 0.7738-0.7678 was brought into play during the course of yesterday’s session, as price extended higher following a bounce from demand at 0.7477-0.7537.This recent buying saw the H4 break above a resistance area at 0.7644-0.7630 and shortly after retest it as support. Consequent to this, price rallied to highs of 0.7689 by the day’s end.
In view of the above structure, our team is now eyeing the 0.7700 line (housed within the current daily supply) for a possible short trade today. We would highly recommend waiting for the lower timeframes to confirm this number before risking capital since a fakeout is likely going to be seen (for confirmation techniques see the top of this report). Should we manage to pin down a sell trade from here, we’ll look to take partial profits around the H4 support area at 0.7644-0.7630.
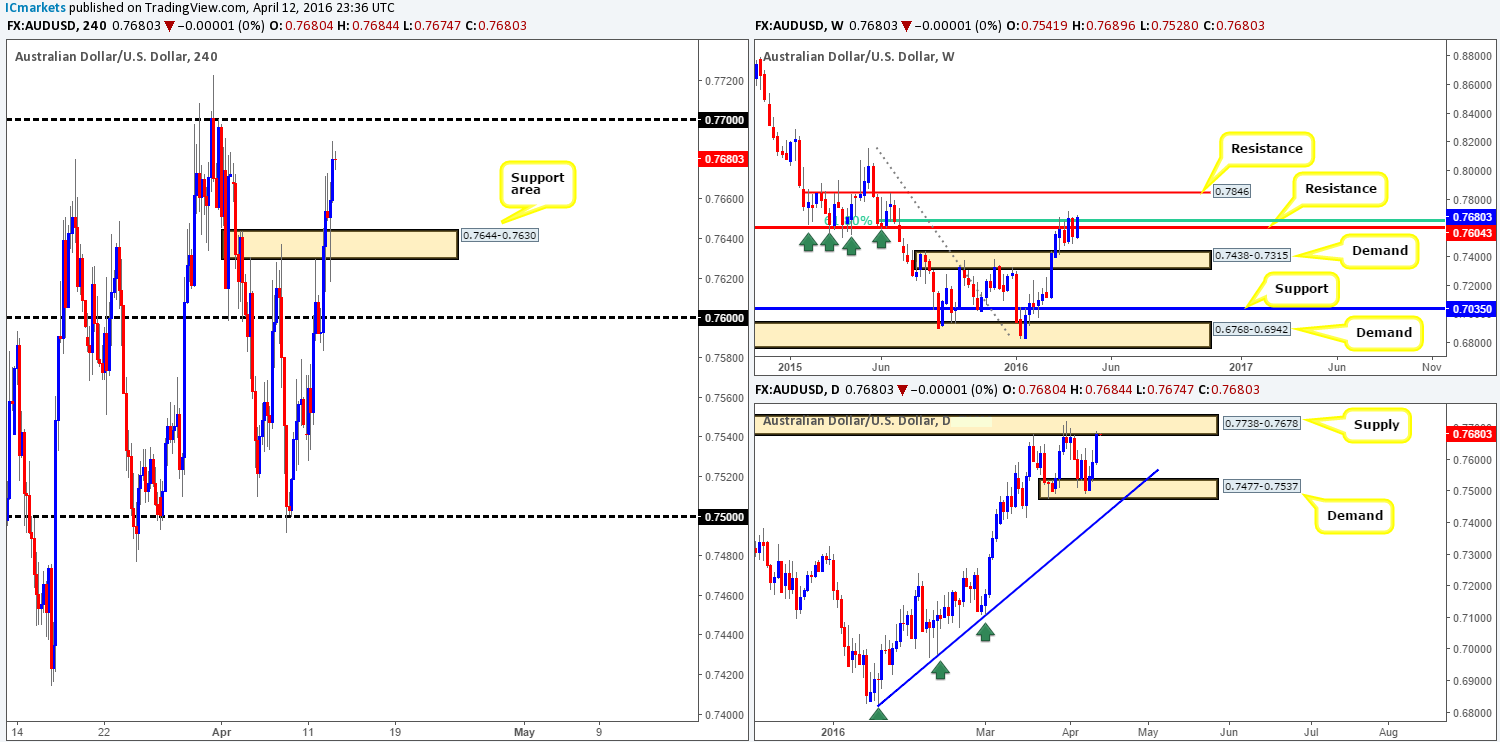
Levels to watch/live orders:
- Buys: Flat (Stop loss: N/A).
- Sells: 0.7700 [Tentative – confirmation required] (Stop loss: dependent on where one confirms this level).
USD/JPY:
In recent trading, we can see that a little bit of life is beginning to emerge from weekly demand at 105.19-107.54. Assuming that the bulls continue nudging this market higher from here, the next port of call will likely be weekly resistance chalked up at 110.09. Turning our attention to the daily chart, demand at 107.60-108.35, which sits only a few pips above the aforementioned weekly demand, is holding firm. The next daily target from here sits at 110.96 – a little above weekly resistance at 110.09.
Over the past few days, we have been speaking about buying from the 107.50/108.00 H4 area (the green zone). Unfortunately, we were not able to pin down a lower timeframe setup from here and even if we had, we would have likely passed due to already being long the USD/CHF. Well done to any of our readers who managed to board this train as target one, the H4 supply at 109.09-108.77, has been hit. Ultimately, we expect this supply to eventually cave in and for price to continue grinding higher owing to higher-timeframe buyers likely coming into the market now (see above). Supposing that we were long this pair, we’d look to trail our position behind H4 supports as we’d be aiming to take final profits around the 110.00 region – essentially the weekly resistance at 110.09.
For traders who missed the long from the 107.50/108.00 region, it would be relatively difficult to join in the run since there’s a tight cluster of troublesome areas lurking above the current supply (H4 supply at 109.90-109.54, psychological resistance 110.00 and H4 supply at 110.63-110.31), thus making an entry, at least form a risk/reward perspective, challenging.
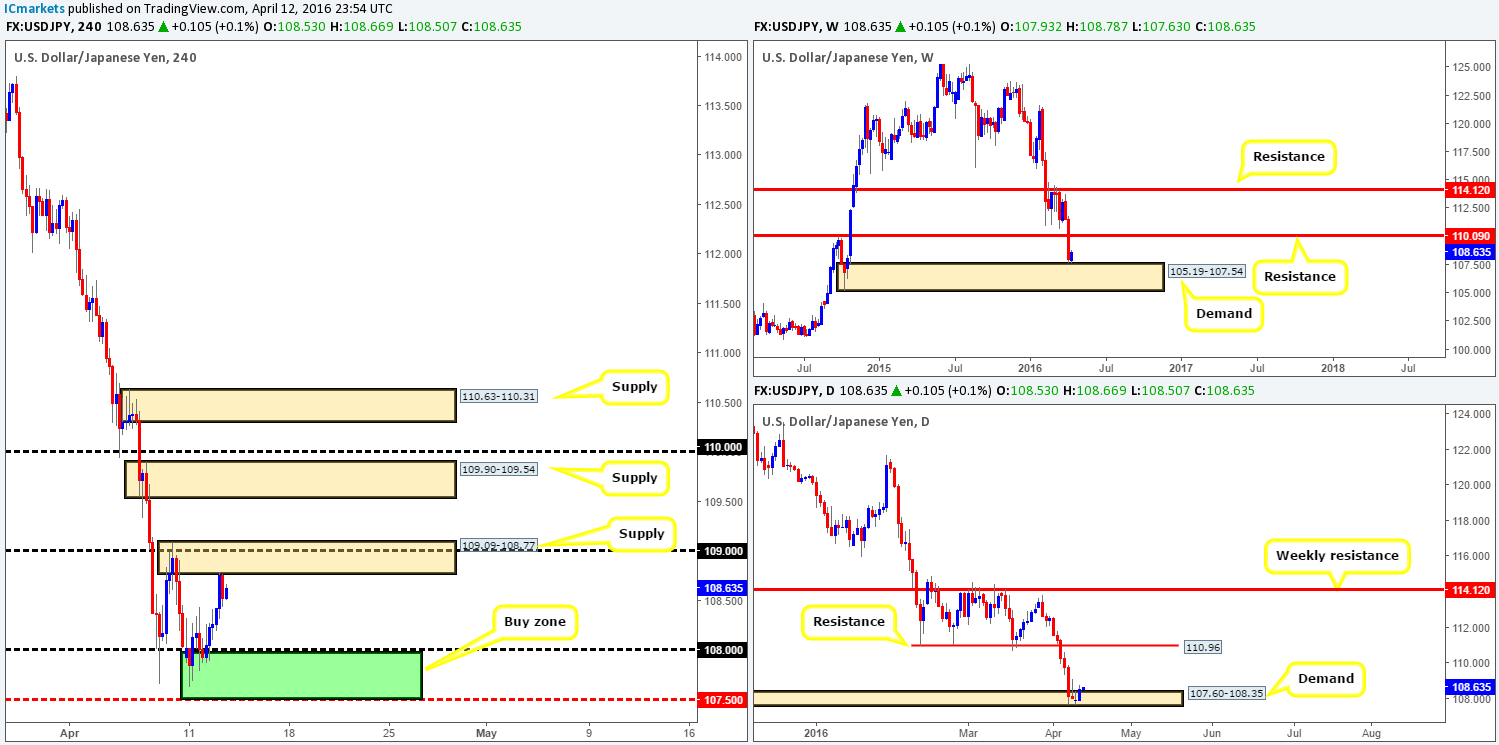
Levels to watch/live orders:
- Buys: Flat (Stop loss: N/A).
- Sells: Flat (Stop loss: N/A).
USD/CAD:
This morning’s analysis will begin with a look at the weekly chart, which shows price recently edged below support at 1.2833. On the occasion that price closes beyond this line, this could set the stage for a continuation move south towards demand coming in at 1.2127-1.2309. Over on the other side of the field, however, daily action is now seen nibbling at the top-side of demand chalked up at 1.2653-1.2753. Should bids hold firm here we could see price rally north to retest the recently broken Quasimodo line at 1.2900. Stepping across to the H4 chart shows that price retested the 1.2900 level beautifully going into yesterday’s U.S open, which subsequently sent the USD/CAD screaming lower! The 1.2800 handle was engulfed, allowing price to test H4 demand found at 1.2717-1.2754 by the close.
With the overall picture in mind, we feel longs from the current H4 demand may be the way to go today. Be that as it may, there is a possibility that price could fake beyond this area into its supporting daily demand (see above). Therefore, to play this one safely we would advise only entering long from the H4 demand base alongside lower timeframe confirmation (for confirmation techniques see the top of this report). Following a satisfactory lower timeframe entry, the first take-profit zone would be 1.2800, followed by the H4 supply at 1.2903-1.2870.
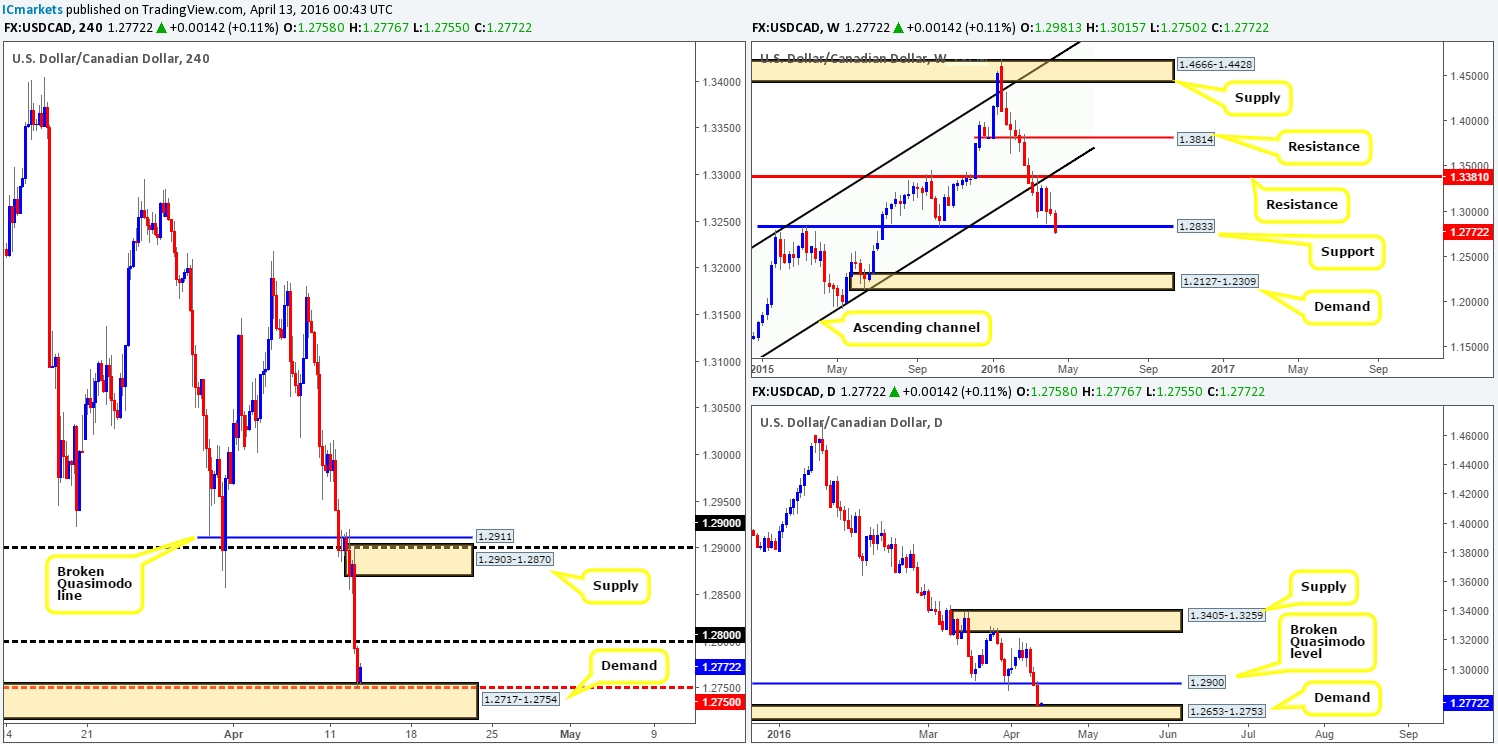
Levels to watch/live orders:
- Buys: 1.2717-1.2754 [Tentative – confirmation required] (Stop loss: dependent on where one confirms this area).
- Sells: Flat (Stop loss: N/A).
USD/CHF:
For those who have been following our recent analysis on the Swissy (see link below) you may recall that we are now long this pair from 0.9519. Consequent to price reaching highs of 0.9593 at yesterday’s U.S. open, we have now moved our stop to breakeven plus five. Since we missed the move to 0.9593, we have taken 50% of our position off the table at 0.9559, and are now looking for price to connect with 0.9600 later on today to liquidate a further 25%.
Given that price is trading from a weekly Quasimodo support at 0.9526 (wrapped within weekly demand at 0.9476-0.9608 and supported by a converging daily AB=CD bullish pattern), our expectation for this trade is to reach at least the daily resistance drawn from 0.9660, which is where we plan to close out the remaining 25% of our long trade. Traders who missed the long from the current H4 demand may have a chance to join in this run should price break above and retest 0.9600 today. We would, dependent on how the lower timeframe action behaves, look to add to our current long position for an intraday bounce up to 0.9660.
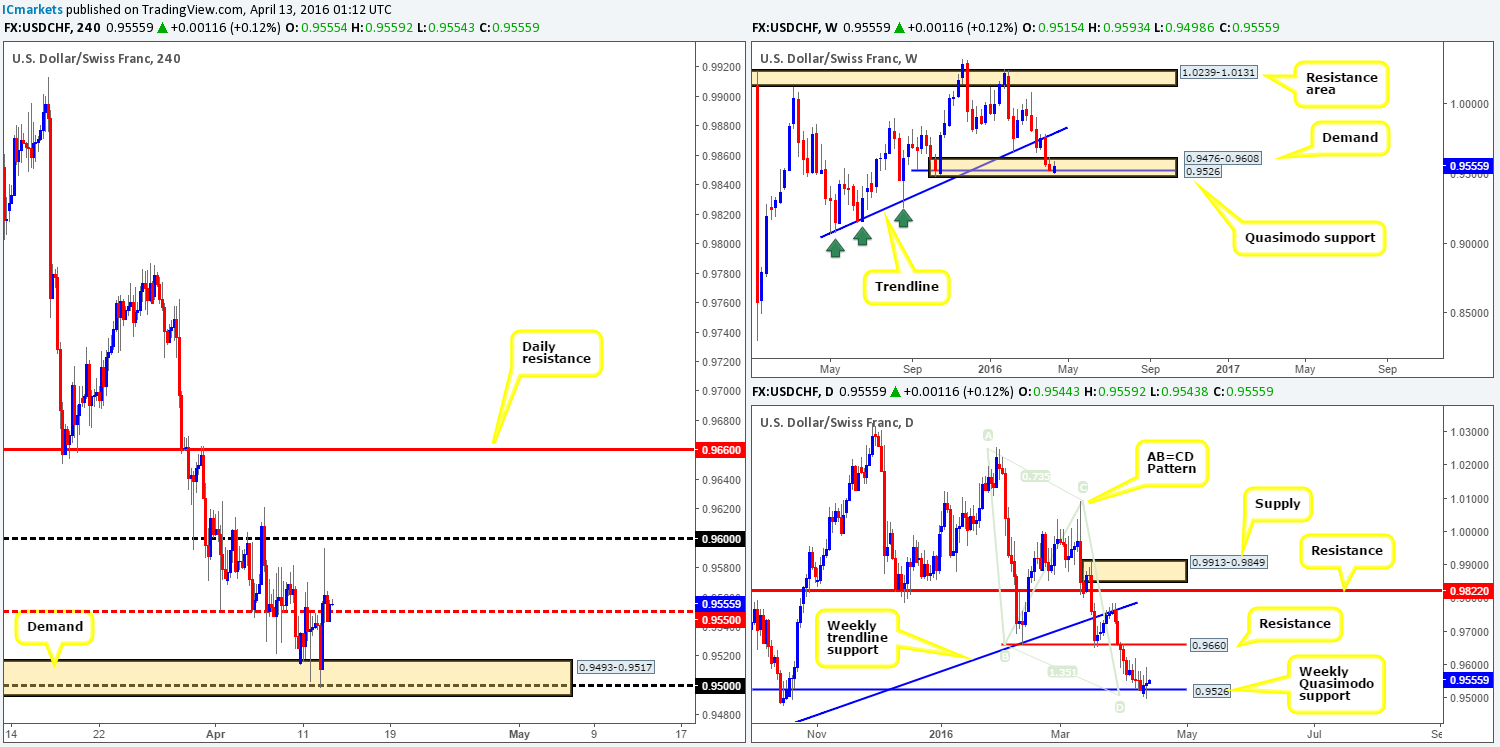
Levels to watch/live orders:
- Buys: 0.9519 [LIVE] (Stop loss: Breakeven).
- Sells: Flat (Stop loss: N/A).
DOW 30:
Coming in from the weekly timeframe this morning, the buyers and sellers remain battling for position around an area of resistance (pink circle) at 17898. A violation of this zone likely opens the path north for prices to challenge resistance fixed at 18253, whilst the next downside target from here comes in at 17135 – a relatively long-term support. From the daily scale, however, price is now loitering mid-range between demand seen at 17396-17554 and a resistance area coming in from 17977-17811.
Over on the H4 chart, traders can see that the downside channel formation (17730/17586) suffered a break going into the American session yesterday, consequently forcing price to highs of 17741 on the day. To the upside, the next area to keep an eye on today falls in at supply drawn from 17880-17812 due to it converging nicely with the above said higher-timeframe areas (see above). At the time of writing, it’s difficult to pin point a first take-profit target since the approach has yet to be completed, however the trendline support taken from the low 17396 looks to be a relatively attractive line at the moment (as per the black arrows).
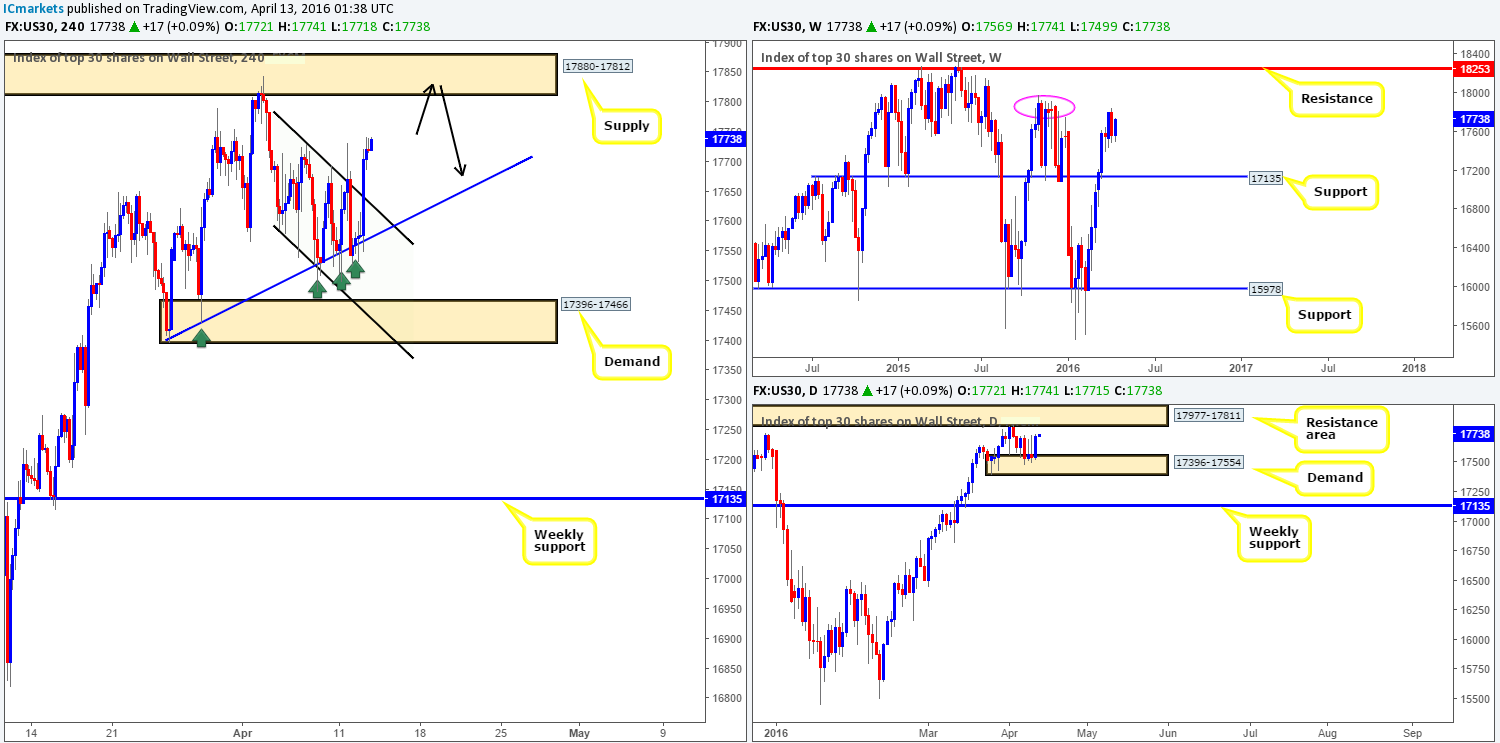
Levels to watch/live orders:
- Buys: Flat (Stop loss: N/A).
- Sells: 17880-17812 [Tentative – confirmation required] (Stop loss: dependent on where one confirms this area).
XAU/USD:
Kicking-off this morning’s analysis from the daily chart, we can see that price peeked above supply at 1260.1-1243.4 during the course of yesterday’s session. The day ended with the market forming an indecision candle, with a slight edge seen going to the bears. This – coupled with the weekly chart showing some active supply around the 1270.8-1250.3 region (see green arrow) ahead of the major supply area above at 1307.4-1280.0, we feel the yellow metal may tumble from here.
From the H4 chart, freshly painted candle action also reveals some clues as to the possible direction Gold may take today. Have a look at yesterday’s low 1251.0; check out how it stabbed into the top-side of demand seen marked with a green arrow at 1251.1 (likely removing some bids from this area). On top of this, the most recent H4 candle has a very bearish tone after bouncing from the underside of resistance coming in at 1256.2. In the event that this candle closes on or very near its lows, we feel this unit will head lower to shake hands with demand chalked up at 1237.2-1243.9.
We do not usually like to have more than one position open at a time, but seeing as we only have 50% remaining on the USD/CHF long right now with our stop at breakeven, we may look to take a small short position on the close of the current candle with a stop placed at 1257.14.
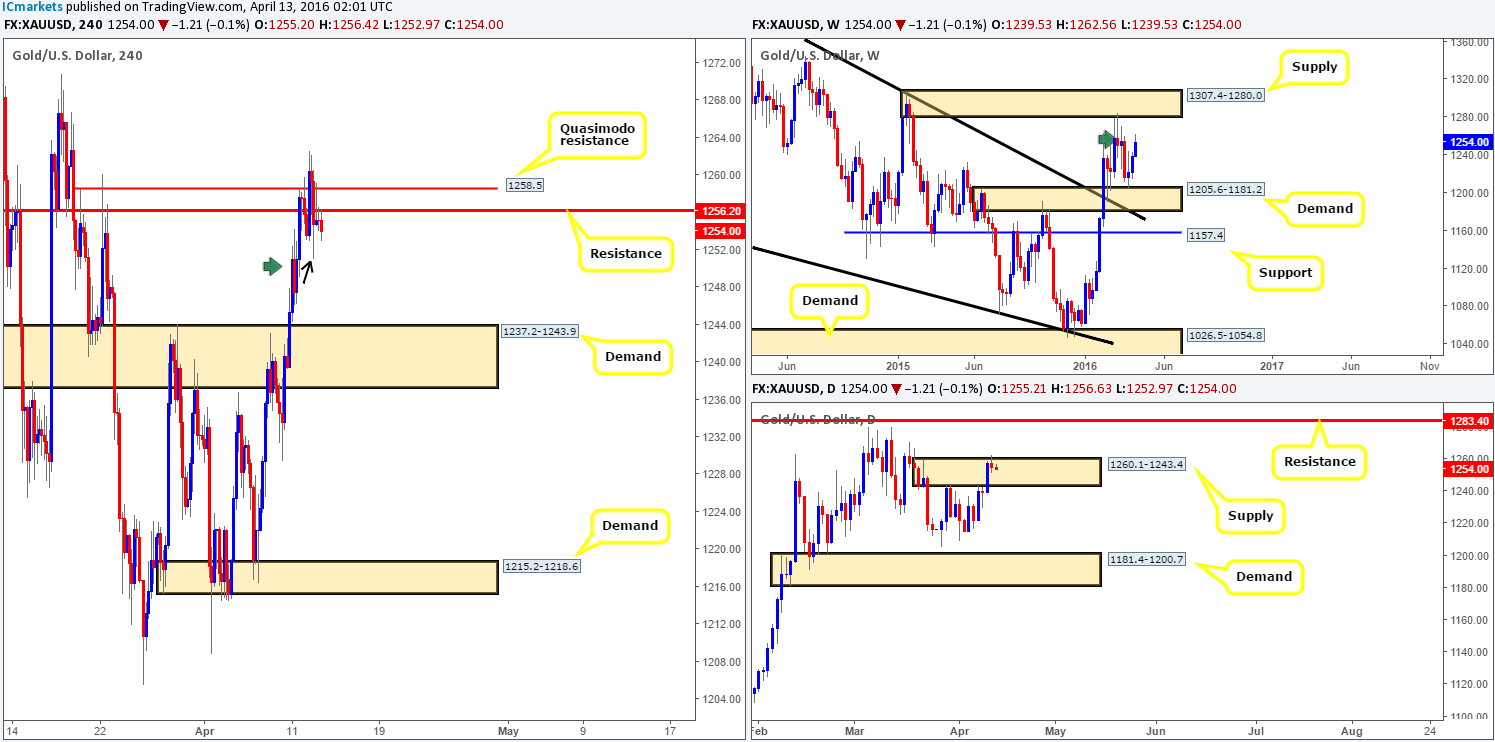
Levels to watch/live orders:
- Buys: Flat (Stop loss: N/A).
- Sells: Depending on how the current candle closes we may look to short down to H4 demand at 1237.2-1243.9 with a stop placed at 1257.14.


