
EUR/USD:
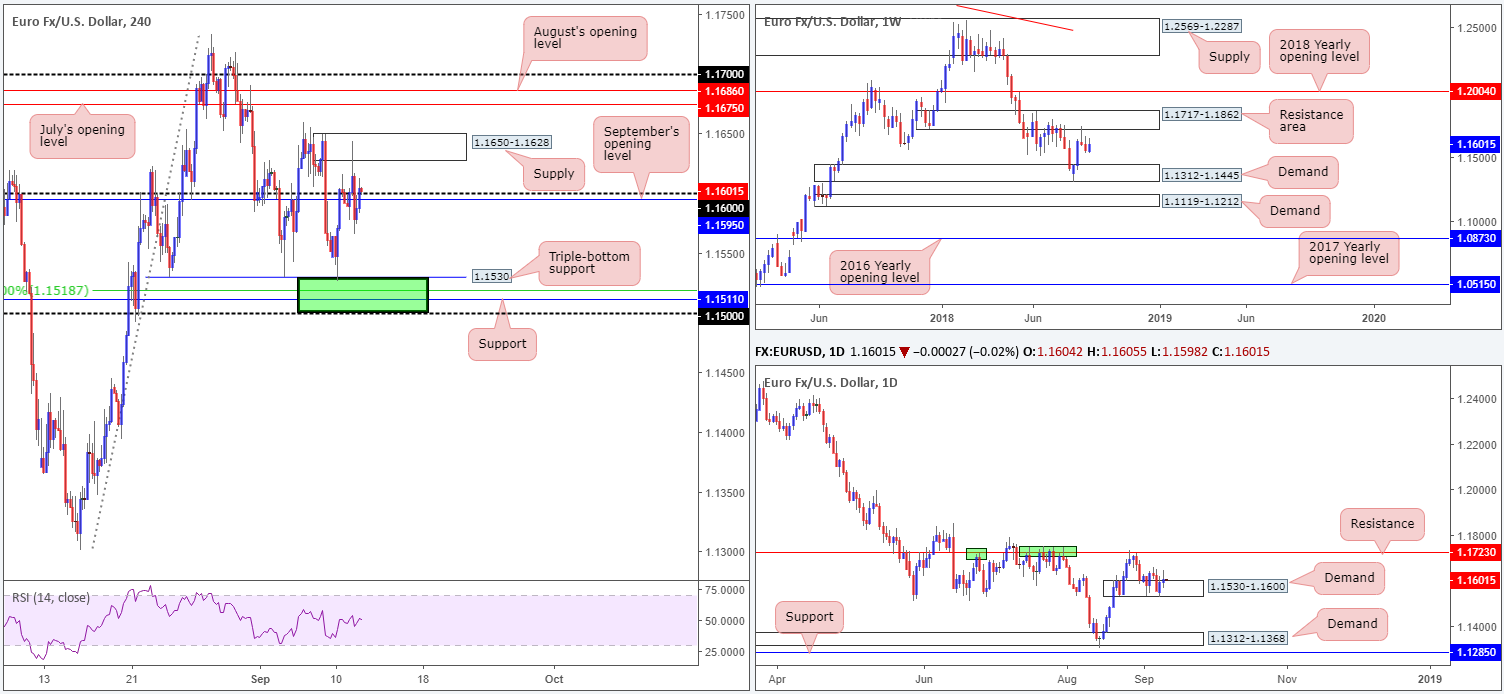
As London unbolted its doors for business on Tuesday, demand for the euro diminished within the upper range of a H4 supply zone at 1.1650-1.1628 amid headlines China is set to ask the World Trade Organization for permission to impose sanctions on the US. As you can see, although this led to the H4 candles pressing beneath the 1.16 handle to lows of 1.1565, the unit pared losses during US trade and finished the day in positive territory back above 1.16.
In terms of where we are on the bigger picture, little has changed since the beginning of the week. Daily demand at 1.1530-1.1600 remains in the fold, though price did pierce the lower edge of its base on Monday by a couple of pips. To the upside, daily resistance at 1.1723 is likely the next base on the hit list, whereas a break to the downside has the daily demand area penciled in at 1.1312-1.1368 to target. For those who follow the weekly timeframe, technicals show a resistance area at 1.1717-1.1862 (the current daily resistance is seen within the lower limits of this base) and a demand zone coming in at 1.1312-1.1445 (also holds the current daily demand area within its lower boundaries).
Areas of consideration:
With respect to weekly and daily movement, both timeframes show room to stretch as far north as the 1.17s at the moment.
Intraday, however, buyers certainly have their work cut out for them! Aside from the current H4 supply mentioned above at 1.1650-1.1628, there’s July’s opening level at 1.1675, August’s opening level at 1.1686 and the 1.17 handle to contend with. Beneath 1.16, on the other hand, the pair exhibits room for an approach towards an area of support marked in green at 1.15/1.1530 (comprised of a round number at 1.15, a H4 support barrier with reasonably strong history at 1.1511, a 50.0% H4 support value at 1.1518 and a triple-bottom H4 support at 1.1530). Not only is this base the next downside target, it’s also a zone worthy of consideration for longs again. With that being said, however, traders are urged to wait and see how H4 price action responds out of this green zone before making a trading decision, since this area has been tested once already this week (a bullish candlestick signal printed from within the base would be ideal, targeting 1.16).
Today’s data points: US PPI m/m; FOMC member Brainard speaks.
GBP/USD:
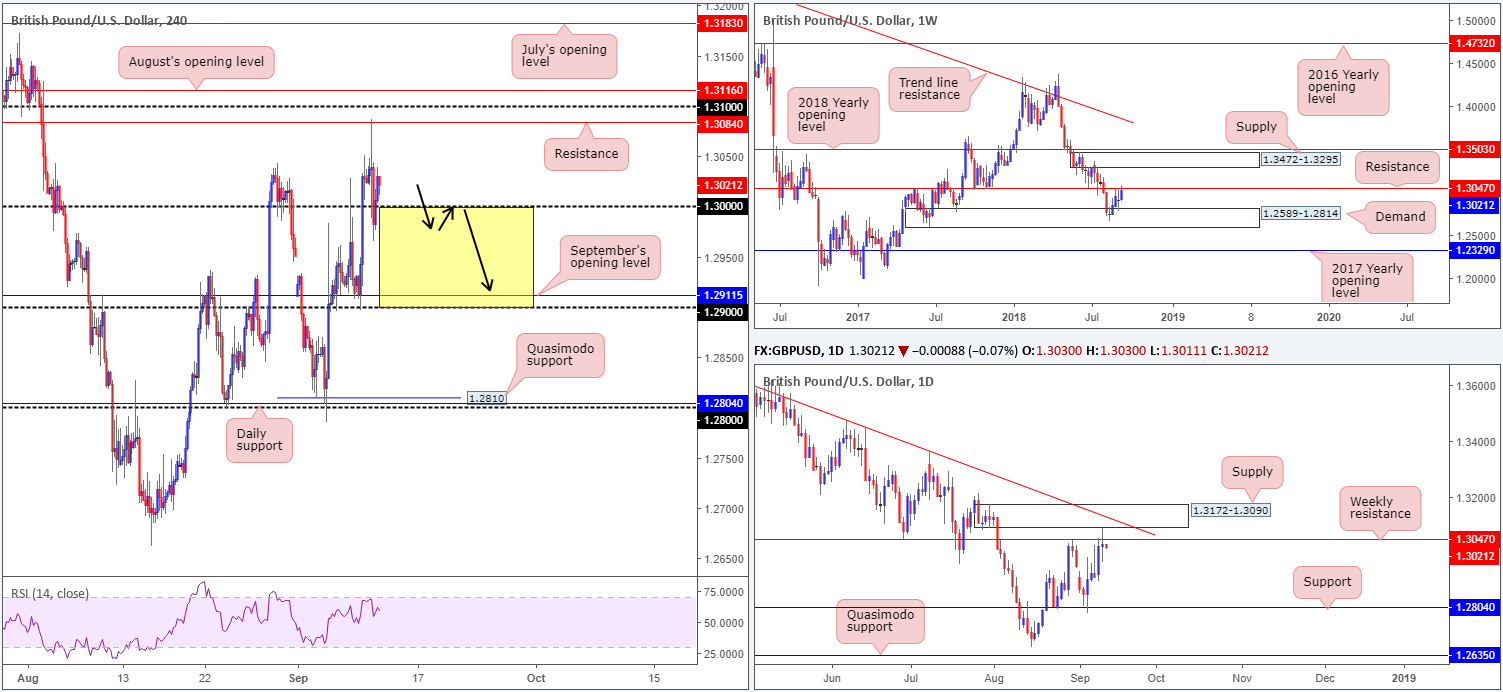
The British pound collided with highs of 1.3087 amid early London hours on Tuesday, consequently shaking hands with H4 resistance plotted at 1.3084. UK employment figures reported a mixed tone, sending the pair briefly higher, though it was not really anything to get excited about as shortly after the pound fell sharply on headlines China is set to ask the WTO for permission to impose sanctions on the US. This brought the H4 candles beneath the key figure 1.30 to lows of 1.2965 (likely tripping a number of stops). Despite this, price failed to generate much follow-through selling thereafter and wrapped up the day in positive terrain back above 1.30.
Yesterday’s action, as is evident from the daily timeframe, chalked up a clear-cut indecision candle that pierced through weekly resistance at 1.3047 and came within a few pips of testing the underside of daily supply priced in at 1.3172-1.3090. Technically speaking, with such huge areas in play right now we feel the GBP may struggle to climb much higher this week.
Areas of consideration:
Should our higher-timeframe analysis prove accurate and H4 price reclaims the 1.30 band, shorts beneath this number on a retest (in the shape of a bearish candlestick formation) is certainly be something to consider, targeting September’s opening level at 1.2911, followed by the 1.29 handle.
Today’s data points: US PPI m/m; FOMC member Brainard speaks.
AUD/USD:
(Outlook remains unchanged)
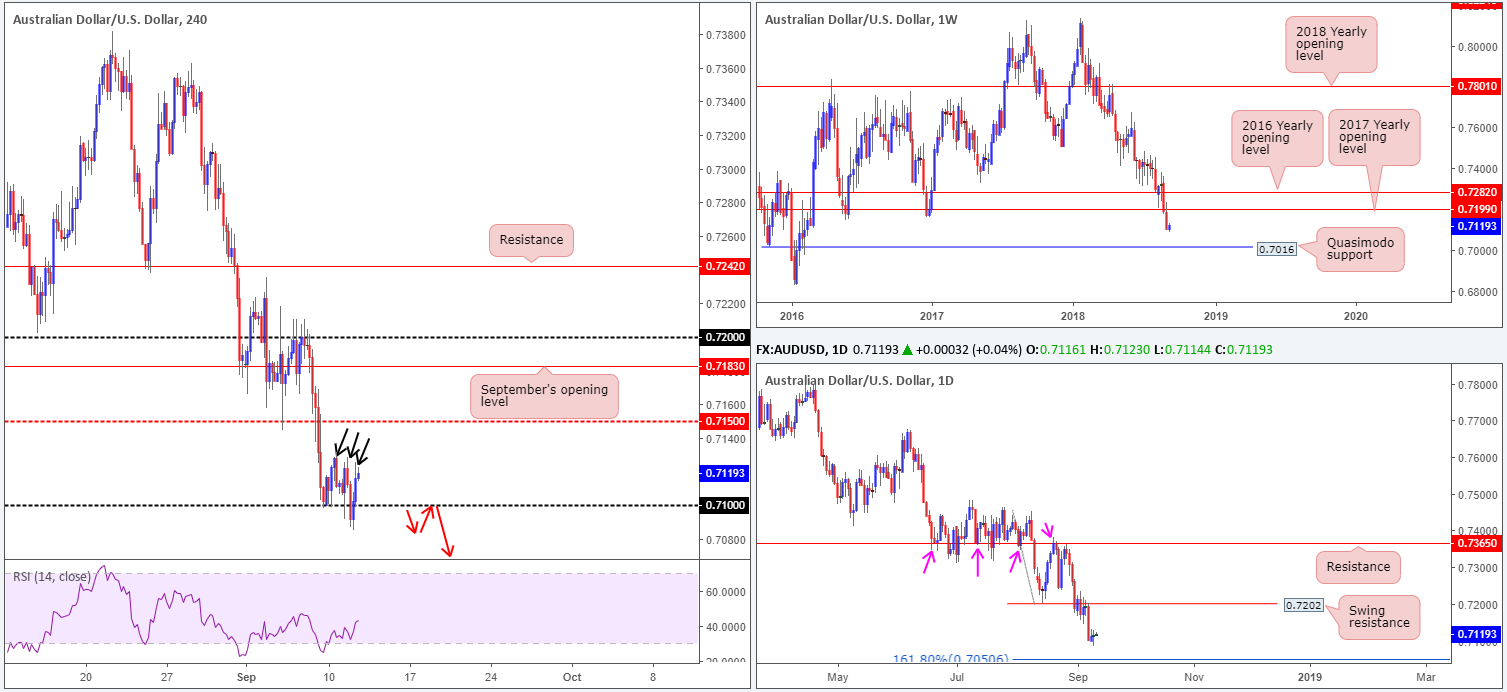
Chinese headlines reporting the country is set to ask the WTO for permission to impose sanctions on the US sent the Australian dollar lower on Tuesday, refreshing its lowest levels since 2016 at 0.7085. Although H4 action has refused to give up on 0.71, traders may have noticed each time 0.71 is tested, price fails to print a higher high, indicating potential weakness (see black arrows).
The AUD/USD, which has been entrenched within an established downtrend for some time now, could still be in for further selling, according to the higher-timeframe picture:
- The Australian dollar sustained additional losses last week, ending the session producing a near-full-bodied weekly bearish candle. The selloff seen from the underside of the 2017 yearly opening level at 0.7199 has yet to reach notable support, with the next obvious barrier not coming into view until around 0.7016: a weekly Quasimodo support.
- Daily swing resistance at 0.7202 did a superb job in capping upside last week. To the left of current price, active demand is also limited (it appears the areas were consumed as price rallied higher in February 2016) until we reach possible daily support at 0.7050: a 161.8% Fib ext. point (taken from the high 0.7453), followed closely by the weekly Quasimodo support mentioned above at 0.7016.
Areas of consideration:
Having seen limited support visible on the higher timeframes until reaching the 0.7050 point, entering long from 0.71 is still not considered a high-probability play.
In light of this, should a H4 close form beneath 0.71, along with a retest to the underside of this number as resistance molded in the shape of a bearish candlestick formation (stop-loss placement governed by the pattern for those looking to sell), this would, technically speaking, likely draw in additional sellers to push towards 0.7050: the daily 161.8% Fib ext. support.
Today’s data points: US PPI m/m; FOMC member Brainard speaks.
USD/JPY:
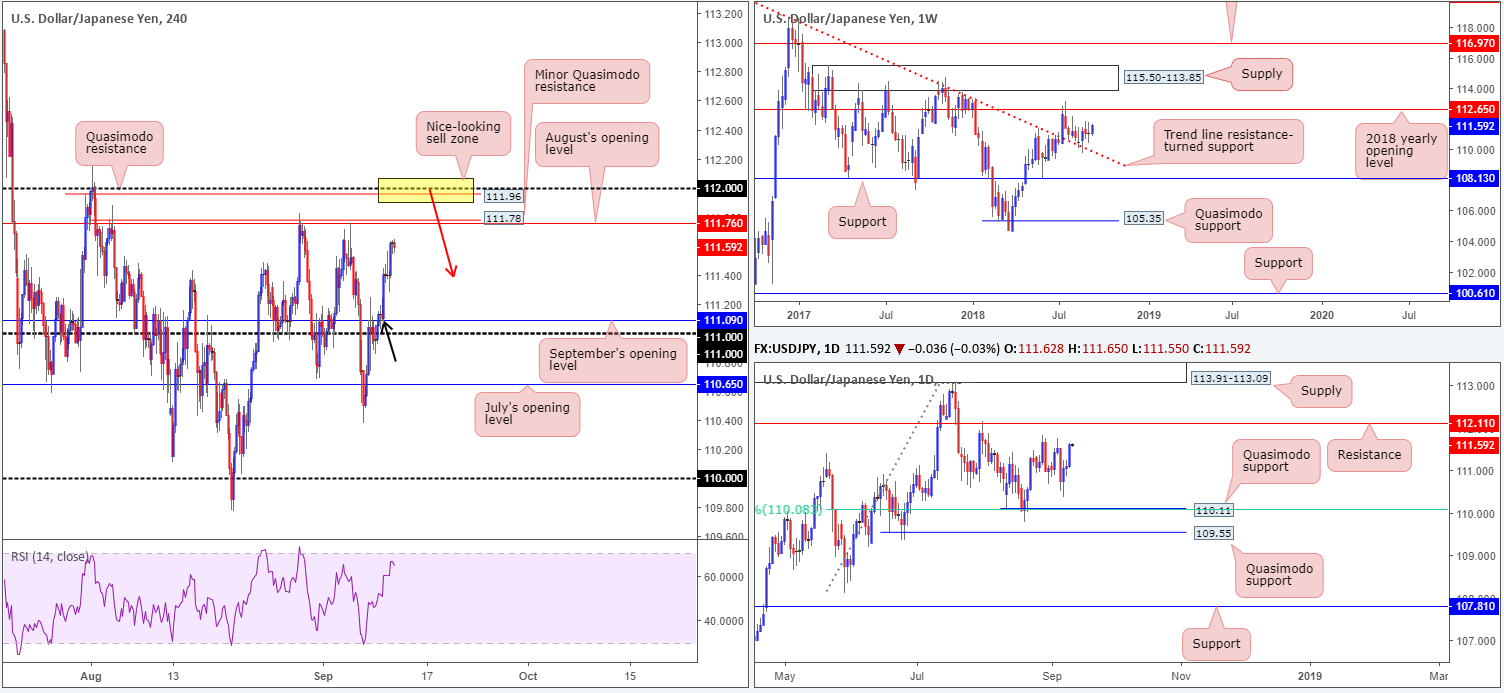
USD/JPY bulls maintained a strong bid-tone over the course of yesterday’s sessions. Advancing alongside US equities and rising US Treasury yields, the USD/JPY is now seen fast approaching August’s opening level priced in at 111.76 on the H4 timeframe. As highlighted in previous reports, traders’ crosshairs are likely fixed on August’s opening level as it fuses with a minor Quasimodo resistance at 111.78. What’s also attractive is the Quasimodo resistance seen at 111.96. Aside from this level merging closely with the 112 handle, the apex (112.15) of the Quasimodo formation is strengthened by a daily resistance level seen at 112.11.
As for the weekly timeframe, the pair shows the unit strongly retested a trend line resistance-turned support (taken from the high 123.57) a few weeks back, though has so far failed to generate much upside presence. Having seen this line hold firm as resistance on a number of occasions in the past, however, it’s likely to remain a defensive barrier going forward. Further buying from current price has the 2018 yearly opening level at 112.65 to target.
Areas of consideration:
For those who read Tuesday’s briefing you may recall the team highlighting a possible buy on the retest of September’s opening level at 111.09. It was also emphasized to consider waiting to see if H4 price formed a bullish candlestick formation, since not only would this inform traders that buyer intent exists here, it also provides an entry and a location to position stop-loss orders. As denoted by a black arrow, you can see price action printed an inverted H4 pin-bar formation off of this level before rallying higher yesterday – well done to any of our readers who managed to catch this move!
The H4 Quasimodo resistance level mentioned above at 111.96 also remains a worthy contender for possible shorts going forward. Having seen daily resistance at 112.11 reinforcing the top edge of this Quasimodo formation, placing stop-loss orders above the Quasimodo apex at around 112.17ish is an option.
Today’s data points: US PPI m/m; FOMC member Brainard speaks.
USD/CAD:
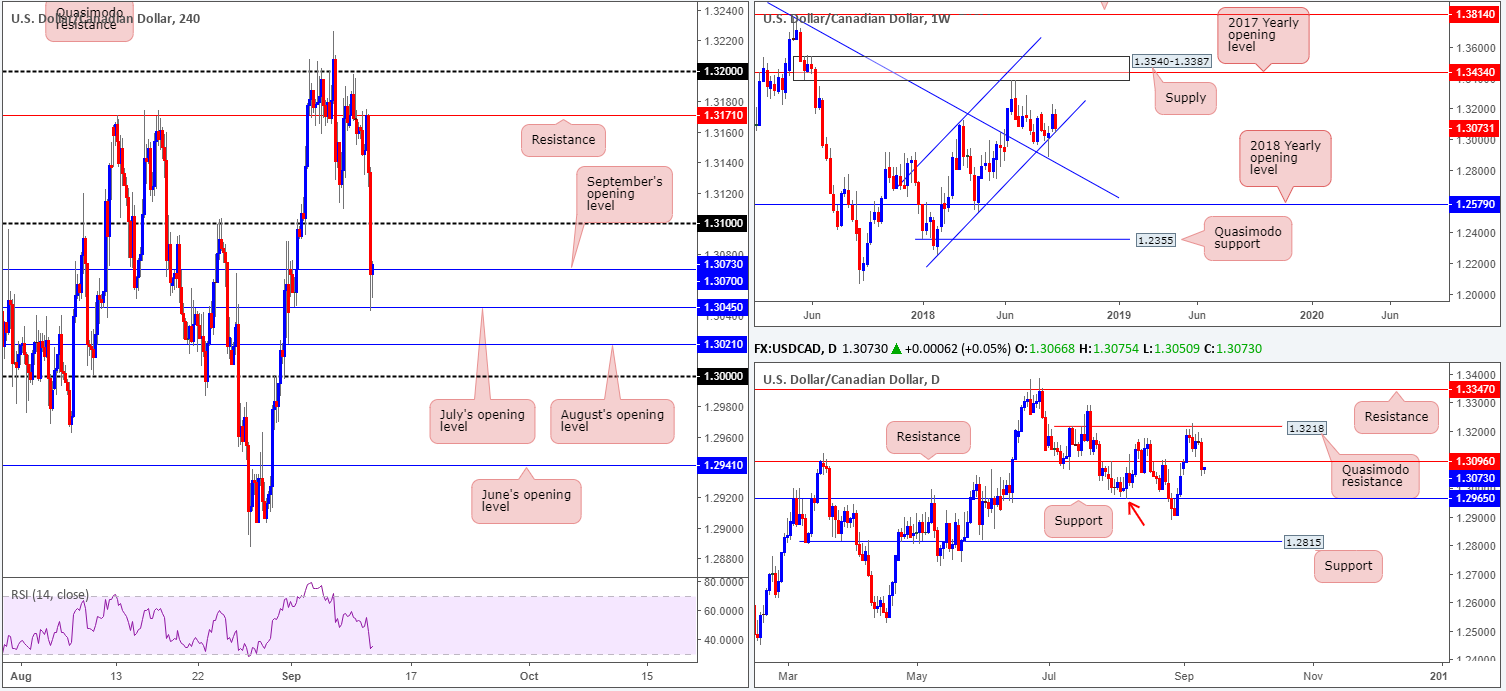
Bolstered by rising energy prices, along with Canada’s Foreign minister expressing optimism with regards to reaching a NAFTA deal, the USD/CAD fell sharply amid US hours on Tuesday.
Shortly after retesting H4 resistance at 1.3171 the pair chalked up a precipitous decline, pressuring the H4 candles through the 1.31 band, as well as September’s opening level at 1.3070. It was only once the unit touched gloves with July’s opening level at 1.3045 did price begin mildly paring losses into the close. Likely supporting this bounce is the weekly channel support (etched from the low 1.2247) recently brought back into the fight. Note this market has been compressing within a weekly ascending channel formation (1.2247/1.3098) since the beginning of the year, so there’s a chance we may witness a recovery play today/this week.
Contrary to weekly price, however, daily movement engulfed a notable support at 1.3096 (now acting resistance) and has perhaps cleared the pathway south towards support coming in at 1.2965 (happens to also represent a Quasimodo left shoulder support – red arrow).
Areas of consideration:
For folks considering a long in this market, do remain cognizant to the fact you would be trading alongside possible weekly buying from its channel support highlighted above. On the other side of the coin, however, you’d also be buying into a potential retest play off daily resistance at 1.3096, and H4 sellers off 1.31.
As you can see, irrespective of the direction one selects today, opposing structure is clearly evident, so trade with caution!
Today’s data points: US PPI m/m; FOMC member Brainard speaks; Crude oil inventories.
USD/CHF:
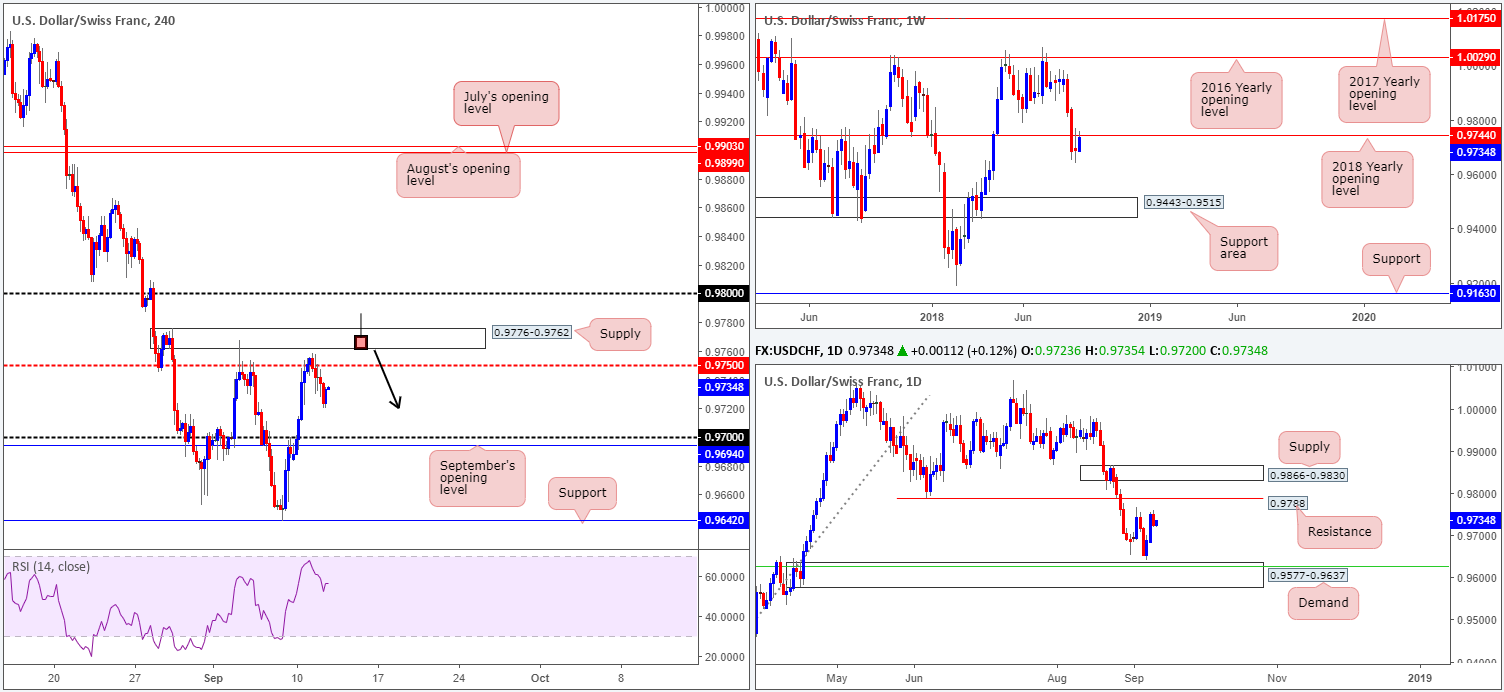
As is evident from the H4 timeframe this morning, movement was somewhat subdued on Tuesday relative to Friday and Monday’s sessions. The candles eclipsed the mid-level resistance at 0.9750, though failed to unite with the lower edge of a nearby supply zone coming in at 0.9776-0.9762 before pushing for lower levels. While we believe further selling is a strong possibility in this market at the moment, owing to the fact weekly resistance at 0.9744 (the 2018 yearly opening level) was brought into the fold, there’s still a chance the pair may observe a pop higher to bring in sellers from the daily swing resistance at 0.9788.
Areas of consideration:
With the above taken into consideration, the current H4 supply at 0.9776-0.9762, although a solid area, could suffer a break to the upside. We say this simply because daily resistance at 0.9788 is positioned just above the zone! For that reason, traders who are considering shorts from this base may want to contemplate waiting for additional candle confirmation to form before pulling the trigger here. An ideal setup to keep eyes on is a H4 bearish pin-bar formation that pierces through the top edge of the current H4 supply and taps the daily swing resistance level at 0.9788 (see the chart for a visual representation), targeting 0.97 as the initial take-profit level. Not only will this move take out stop-loss orders above supply (providing bigger players liquidity to sell), it’ll also bring daily sellers into the equation.
In the event price fails to reach this high, however, shorts from the underside of 0.9750 are also an option. Nevertheless, waiting for H4 price to print a bearish candlestick formation prior to pulling the trigger is advised, due to the possibility of daily price attempting to press higher.
Today’s data points: US PPI m/m; FOMC member Brainard speaks.
Dow Jones Industrial Average:
(Outlook remains unchanged)
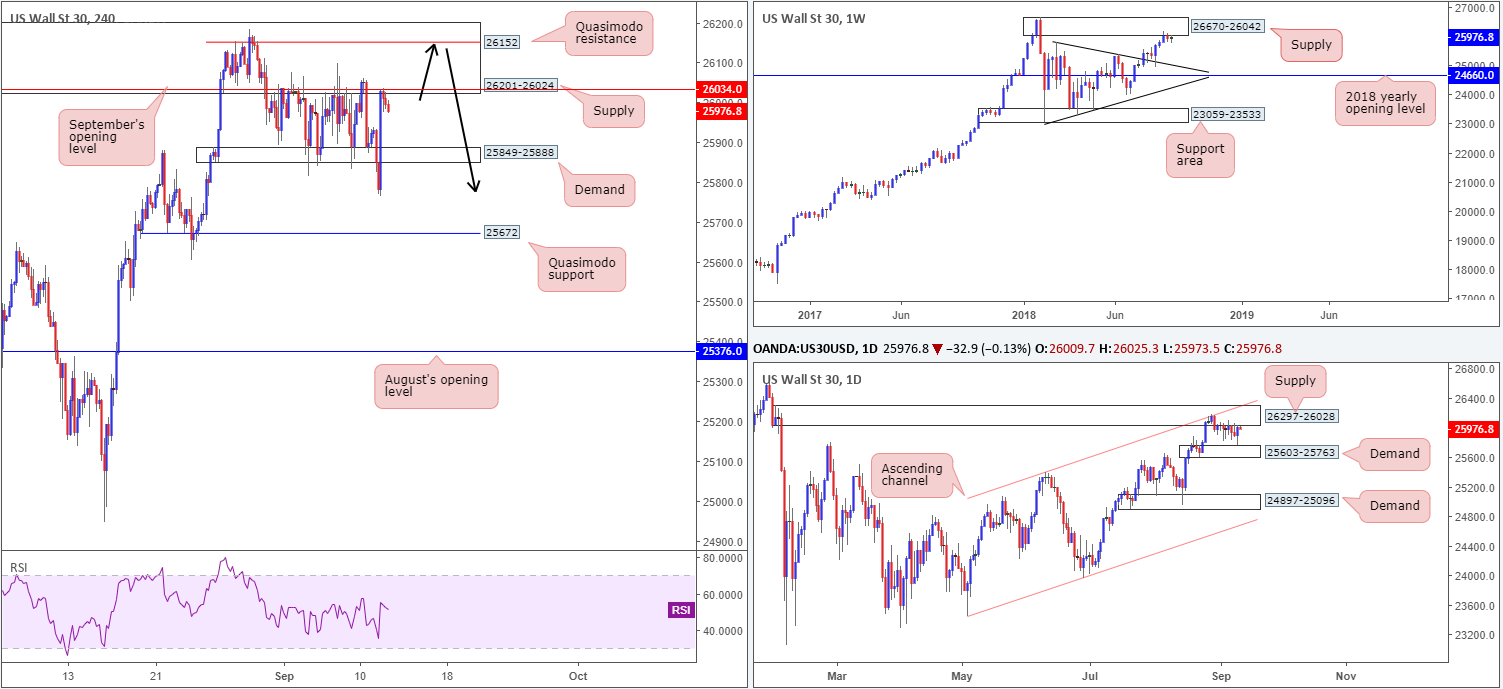
Over the past week and a half US equities have entered into a lull, confined between the lower edge of a H4 supply at 26201-26024 (and September’s opening level at 26034) and a H4 demand base coming in at 25849-25888. Also worth noting is the current demand is showing signs of weakness, given the number of times its lower edge has been penetrated, potentially clearing the path south towards the H4 Quasimodo support level at 25672.
In terms of the bigger picture, the index ended last week mildly breaking a three-week bullish phase after price engaged with the lower edge of a weekly supply at 26670-26042, following a strong retest off a trend line resistance-turned support (etched from the high 25807) a few weeks back. On the daily timeframe, strong supply at 26297-26028 remains in the fold. What gives this area credibility comes down to the following:
- Downside momentum drawn from the base is incredibly strong.
- The zone intersects with a nearby daily channel resistance (taken from the high 25399).
- Glued to the underside of the aforesaid weekly supply area.
Areas of consideration:
As the current H4 supply at 26201-26024 is enormous, entering short from the H4 Quasimodo resistance level seen within the upper limits of the area at 26152 is still the main focus this week (see black arrows), as this level offers favourable risk/reward conditions. This also gives traders the option of positioning stops above the H4 supply, targeting the H4 demand area mentioned above at 25849-25888 as the initial take-profit zone, followed then by the top edge of daily demand at 25603-25763 (next downside target on the daily scale) and then the H4 Quasimodo support level at 25672.
Today’s data points: Limited.
XAU/USD (Gold)
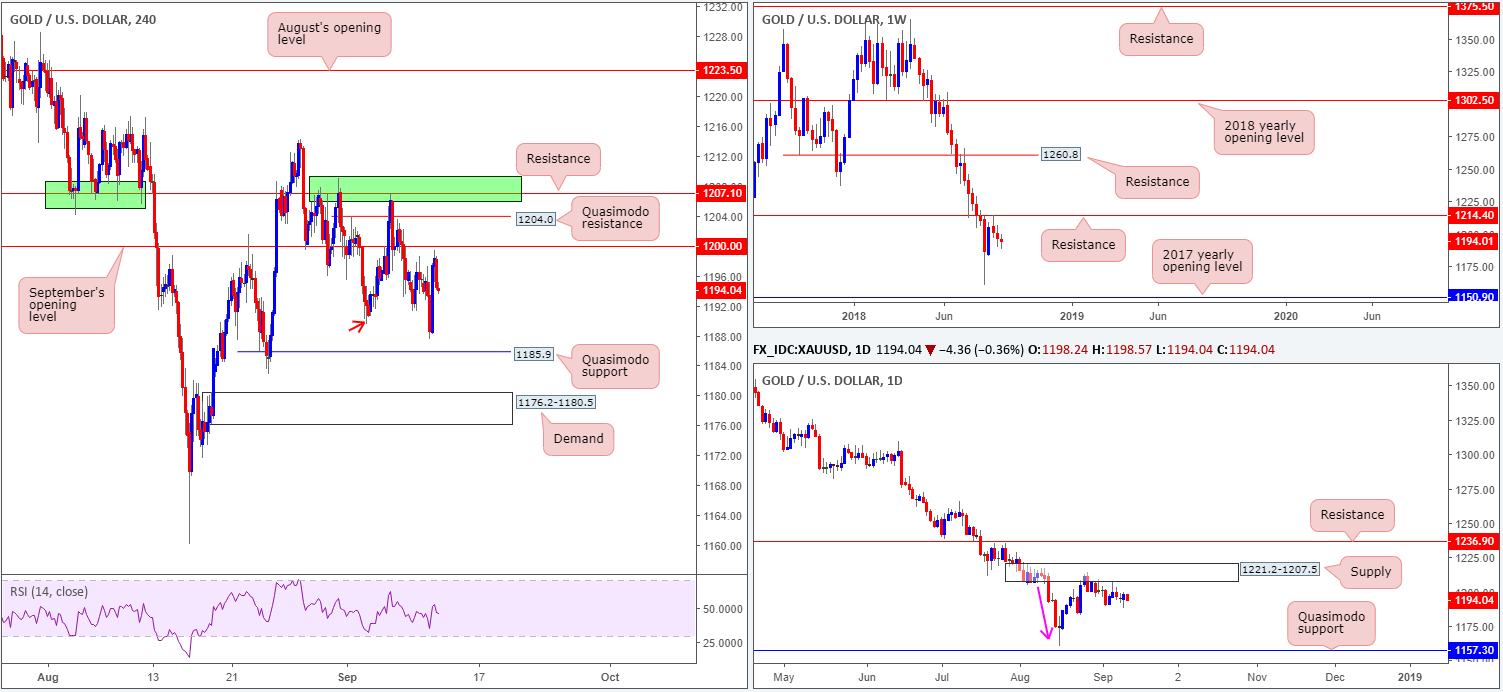
According to the higher-timeframe picture, this market is currently reflecting a negative bias at the moment. Weekly price registered its second consecutive weekly loss last week as the yellow metal remains in negative territory beneath resistance marked at 1214.4. Further downside from this point could eventually stretch as far south as the 2017 yearly opening level at 1150.9. In conjunction with weekly flow, daily movement is seen checking in with a nice-looking supply zone at 1221.2-1207.5. Aside from this zone displaying attractive downside momentum from its base (see pink arrow), it could also be considered the ‘decision point’ to print 2018 yearly lows of 1160.3. Couple this with the fact we are also coming off weekly resistance, we potentially have ourselves some strong sellers in the mix.
Tuesday’s intraday action, however, witnessed a break of the September 4 low at 1189.4 (red arrow), and a subsequent pullback to highs of 1199.4 (essentially topping just south of September’s opening level at 1200.0). September’s opening level, along with the H4 Quasimodo resistance at 1204.4 and the H4 resistance level at 1207.1 are all possible sell zones today. To the downside, traders’ crosshairs are likely fixed on a H4 Quasimodo support at 1185.9, followed closely by a H4 demand area penciled in at 1176.2-1180.5.
Areas of consideration:
A H4 bearish candlestick formation printed off of either one of the above noted H4 resistances underlined in bold can be considered a high-probability shorting opportunity (stop-loss orders should be positioned in line with the candle pattern seen), when taking into account the overall technical picture. As for intraday take-profit targets, the H4 supports highlighted above in bold are an option.
The use of the site is agreement that the site is for informational and educational purposes only and does not constitute advice in any form in the furtherance of any trade or trading decisions.
The accuracy, completeness and timeliness of the information contained on this site cannot be guaranteed. IC Markets does not warranty, guarantee or make any representations, or assume any liability with regard to financial results based on the use of the information in the site.
News, views, opinions, recommendations and other information obtained from sources outside of www.icmarkets.com.au, used in this site are believed to be reliable, but we cannot guarantee their accuracy or completeness. All such information is subject to change at any time without notice. IC Markets assumes no responsibility for the content of any linked site. The fact that such links may exist does not indicate approval or endorsement of any material contained on any linked site.
IC Markets is not liable for any harm caused by the transmission, through accessing the services or information on this site, of a computer virus, or other computer code or programming device that might be used to access, delete, damage, disable, disrupt or otherwise impede in any manner, the operation of the site or of any user’s software, hardware, data or property.


