
A note on lower timeframe confirming price action…
Waiting for lower timeframe confirmation is our main tool to confirm strength within higher timeframe zones, andhas really been the key to our trading success. It takes a little time to understand the subtle nuances, however, as each trade is never the same, but once you master the rhythm so to speak, you will be saved from countless unnecessary losing trades. The following is a list of what we look for:
- A break/retest of supply or demand dependent on which way you’re trading.
- A trendline break/retest.
- Buying/selling tails – essentially we look for a cluster of very obvious spikes within the higher timeframe zone.
- Candlestick patterns. We tend to only stick with pin bars and engulfing bars as these have proven to be the most effective.
EUR/USD:
For those who read our previous report on the EUR, you may recall us mentioning to watch for potential buying opportunities on a retest of eitherthe large psychological round number 1.1000 or the 4hr swap (support) area at1.0986-1.0968. We took a small loss on this trade as we tried to enter on a small 5 minute Quasimodo support level at 1.0970. Price stopped us out and then frustratingly rallied to our target zone – the 4hr Quasimodo resistance base 1.1082.
From a higher timeframe technical standpoint, we still see little reason why the EUR currency will not continue to appreciate in the near term. The weekly chart shows a relatively clear path north until weekly supply at 1.1532-1.1278, while the daily chart’s next resistance (for us anyway) is located around the daily swap (resistance) level at 1.1148.
However, what looks like supply consumption wicks on the daily timeframe (red arrows: 1.1128/1.1113) is actually part of what makes up the current 4hr resistances – the 4hr Quasimodo resistance level at 1.1082 and the 4hr Quasimodo resistance barrier at 1.1112. In consequence, here is our view on the most likely scenario today…The large round number 1.1000 was, as you can see, faked lower during yesterday’s sessions meaning there could still very well be unfilled buy orders lurking around this number, since it takes an incredible amount of money to fake below a level of this magnitude. As such, we’re expecting price to return to collect these orders today, which could present us with a buying opportunity (lower timeframe confirmation required since a fakeout spike below this number could be seen again), targeting 1.1100 since offers around 1.1082 are likely weak now.

Levels to watch/live orders:
- Buys:1.1000 [Tentative – confirmation required] (Stop loss: dependent on where one confirms this level).
- Sells: Flat (Stop loss: N/A).
GBP/USD:
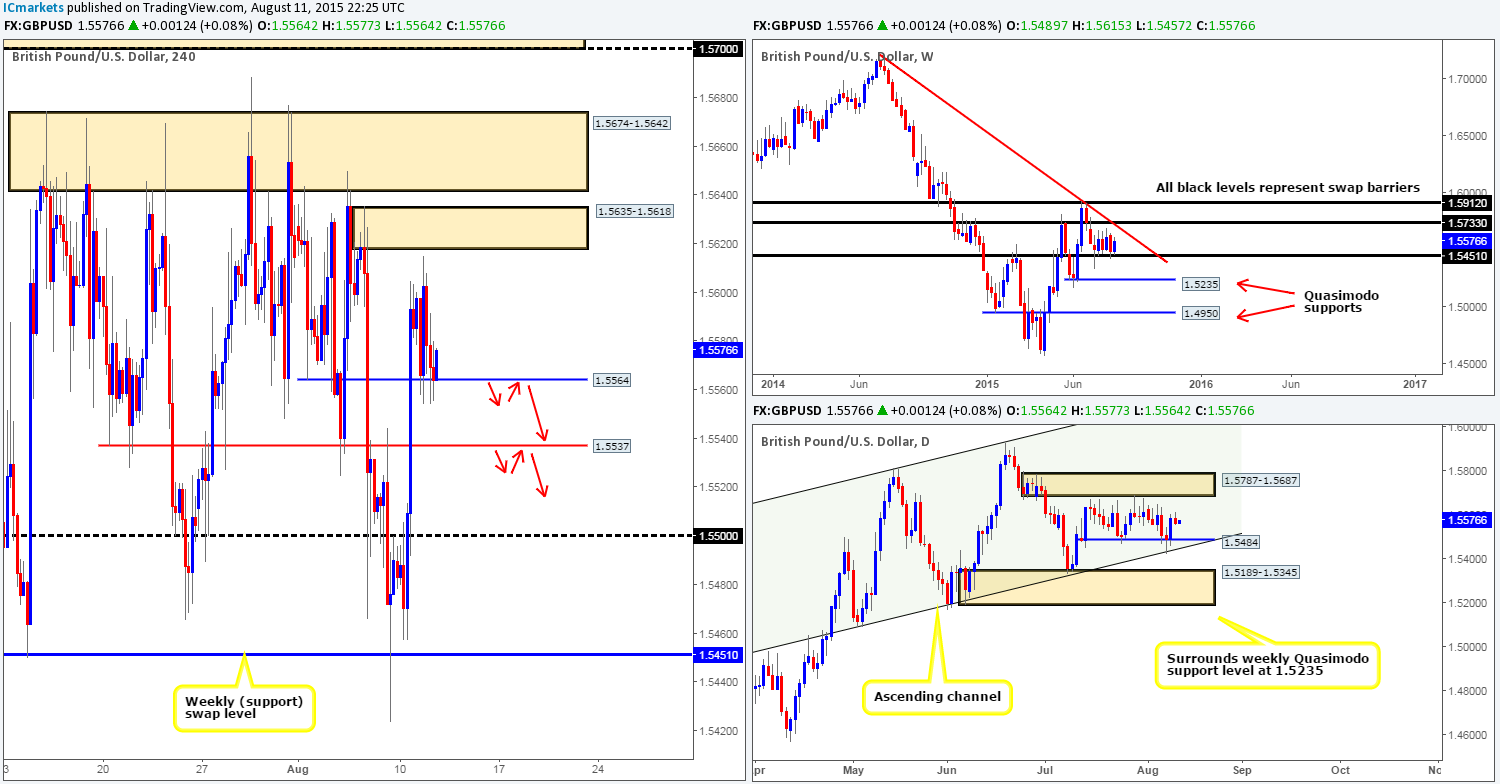
Following on from yesterday’s report, we can see that price retested 1.5564 beautifully and came within touching distance of hitting our final take-profit target at the 4hr supply zone 1.5635-1.5618from the long trade we took from 1.55009 at 13.20pm GMT on Monday. For the sake of around ten or so pips though, we closed our full position at 1.56040, as lower timeframe sellers appeared to be gaining strength at that time.
As of writing, bids are holding this market up lovely at 1.5564. Should this continue to be seen, there could be, like yesterday, an intraday long opportunity(confirmation required) targeting the aforementioned 4hr supply zone. Supporting this, there appears to be room for a further push north on both the weekly and daily timeframes at the moment. Next upside resistance on the weekly falls in at 1.5680 (the underside of the weekly downtrend line taken from the high 1.7166), while the daily shows nearby resistance coming in around supply seen at 1.5787-1.5687.
In the event that 1.5564 fails to hold, however, we’ll likely see a sharp drop down towards 1.5537, or even 1.5500 given enough time. This could, as long as a confirmed retest of the violated zone is seen beforehand (see red arrows), permit us to sell this market short term. However, you would, at that point, likely be going against higher timeframe opposition so constant monitoring of your position(s) is advised.
Levels to watch/ live orders:
- Buys: 1.5564 [Tentative – confirmation required] (Stop loss: dependent on where one confirms this level).
- Sells: Watch for 1.5564/1.5537 to be consumed and then look to enter on a retest of this number (confirmation required).
AUD/USD:
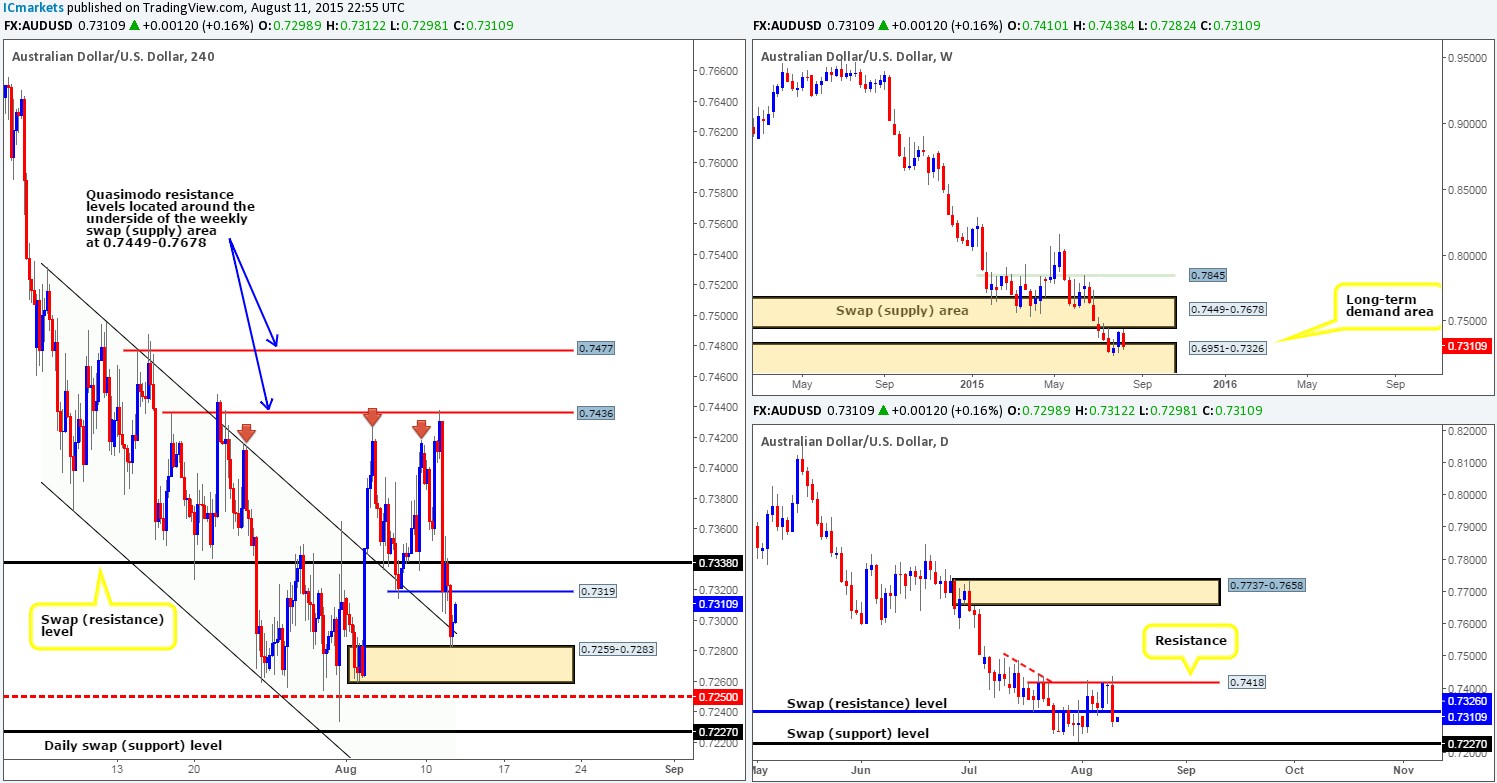
Going into the early hours of yesterday’s trade, a strong wave of offers came into this market following a near to-the-pip touch of the 4hr Quasimodo resistance level at 0.7436 (a level that was highlighted to watch for potential sells in our previous report). The move from here, as you can see, clearly set the tone for the day. Price smashed through bids sitting around the 4hr swap (support) level at 0.7338, which shortly after responded with a counter-attack retest of this number and continued on down to 4hr demand at 0.7259-0.7283 (unites beautifully with the upside support of the recently broken 4hr descending channel [0.7531/0.7371]), which is, at the time of writing, holding firm.
This move should not really come as much of a surprise since price is not only currently entrenched in, what seems to be a never-ending downtrend, but also was at the time, trading around both a minor daily resistance level at 0.7418, and also just below a weekly swap (supply) area at 0.7449-0.7678.
With price now back sitting within the long-term weekly demand area at 0.6951-0.7326, is it a good time to be thinking about buying some Aussie dollars? Technically speaking, we think not. In addition to the above in bold, price has recently closed below a daily swap (support – now resistance) level at 0.7326, which has potentially cleared the path south towards a daily swap (support) barrier at 0.7227. So you see, other than the reaction from the 4hr demand area at 0.7259-0.7283, which may only reach 0.7319, and the already weak-looking long-term weekly demand zone at 0.6951-0.7326, there is not really much tempting us to buy at this time.
With regards to selling this market, there is of course 0.7319 and the 4hr swap (resistance) level just above it at 0.7338 where one could look to short from today. However, for us, the risk/reward space from these barriers is not enough to convince us to commit capital to this idea. That being the case, we have opted to keep our position flat on this pair today.
Levels to watch/ live orders:
- Buys: Flat (Stop loss: N/A).
- Sells: Flat (Stop loss: N/A).
USD/JPY:
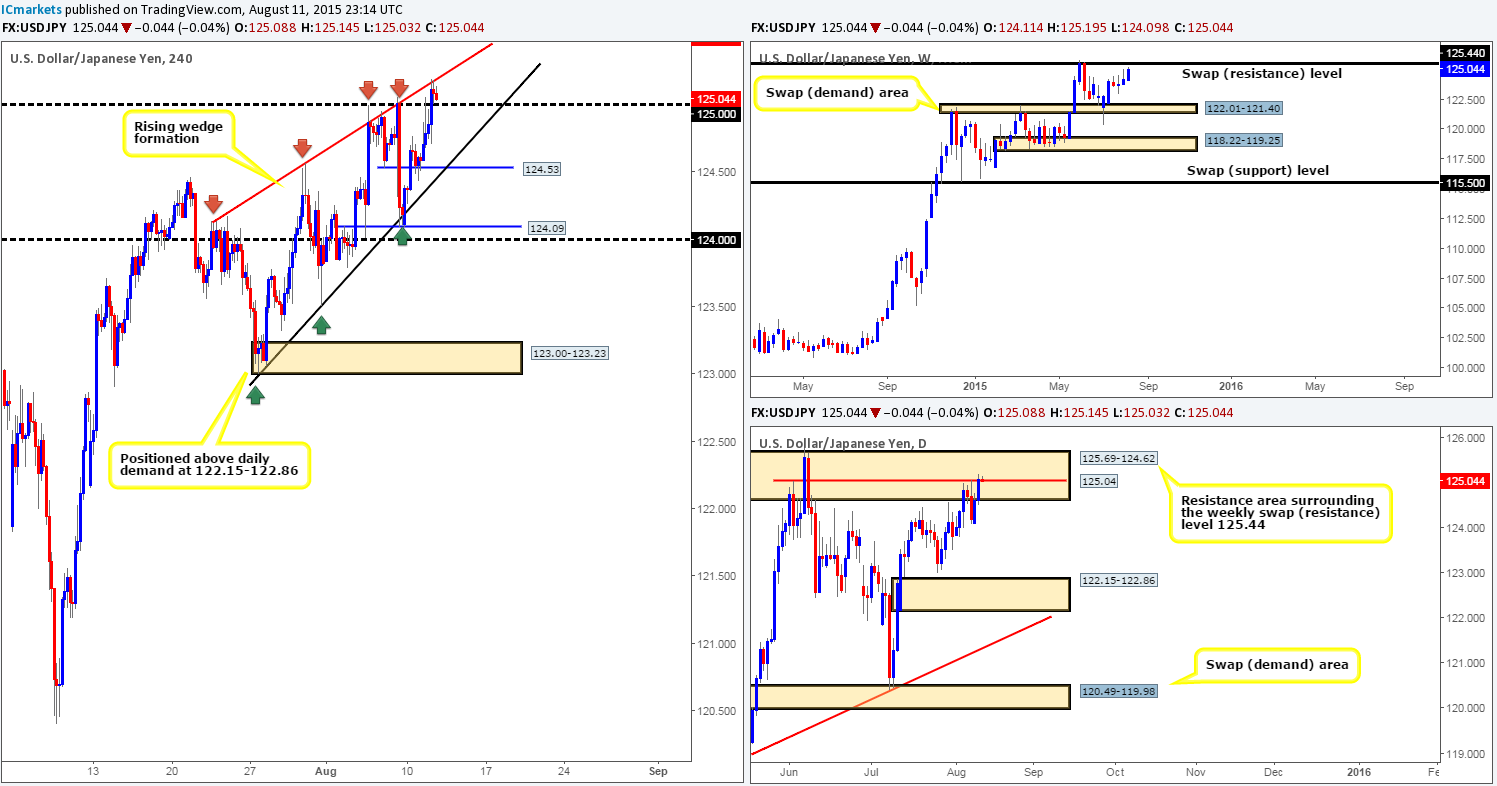
Upon retesting the 124.53 level as support late on Monday, a conservative wave of bids piled into the U.S. dollar in the early hours of yesterday’s trade forcing the USD/JPY to hit and extend past the 125.00 handle going into close 125.08.
In the event that the buyers can hold out above 125.00 today, this could likely see this pair appreciate further within the confines of its current 4hr rising wedge formation (123.00/124.14). Usually, we’d try and fade 125.00 as long as the lower timeframes were also agreeable, but in this case, we have our beady little eye on something much bigger! Take a look over to the weekly and daily charts. See how price is now within shouting distance of the weekly swap (resistance) level at 125.44 and also lodged deep within a daily resistance area at 125.69-124.62. Assuming that price remains confined within our 4hr rising wedge formation up to the weekly resistance hurdle, there could be potential for a very tasty short trade.
If the above does come to fruition, we’re relatively confident that a bounce lower will be seen from here. As such, 50% of our position has been allocated in the form a pending sell order set at 125.47 (just below the mid-level hurdle 125.50) with a stop placed just above the aforementioned daily resistance area at 125.80. The remaining 50% will be entered into the market if/when price action confirms this level’s strength.
Levels to watch/ live orders:
- Buys: Flat (Stop loss: N/A).
- Sells: 125.47 [50% of our usual position] (Stop loss: 125.80). The remaining 50% will be entered into the marker if/when price action confirms this level.
USD/CAD:
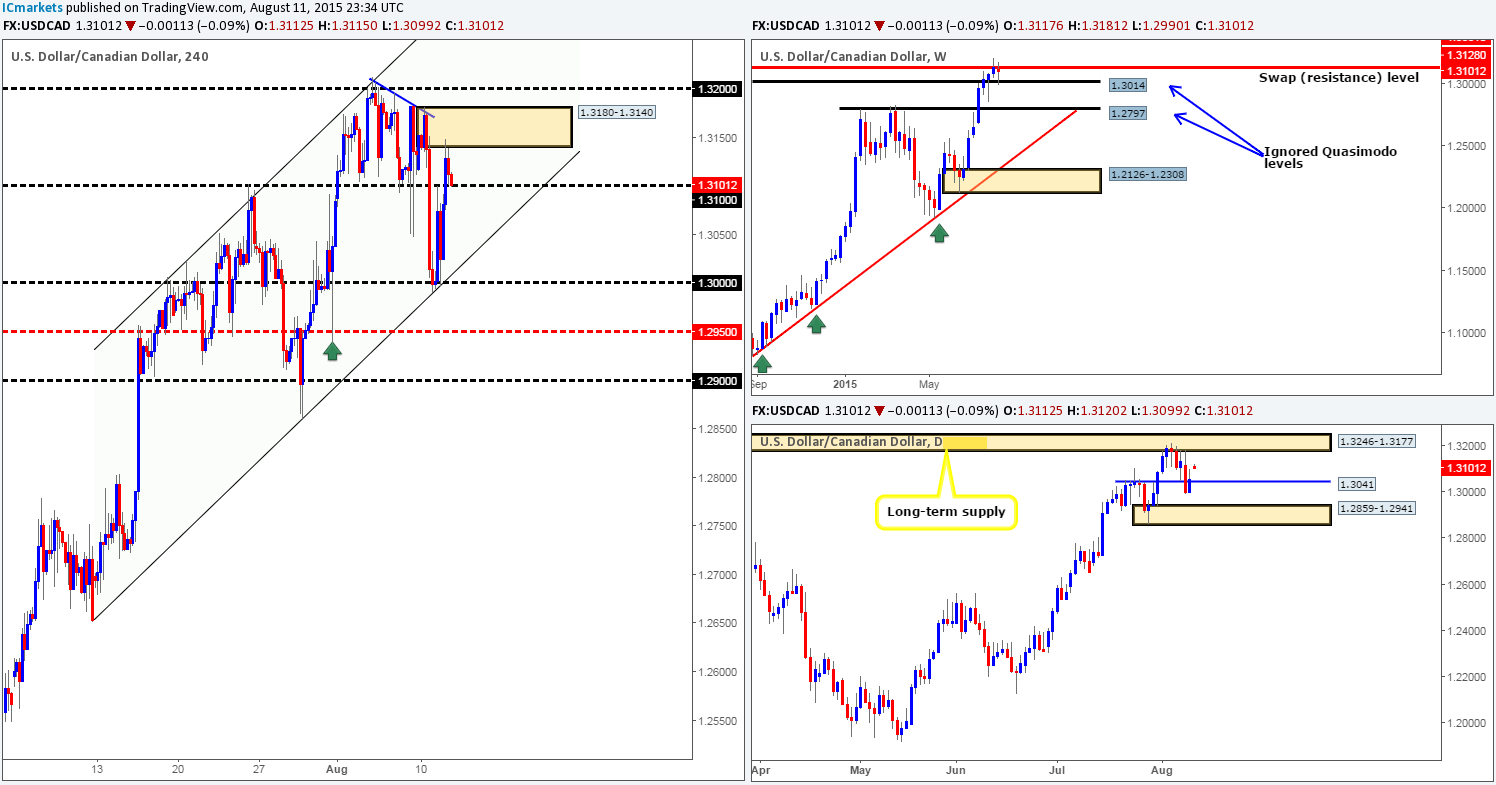
After price shook hands with 1.3000 and its merging 4hr ascending channel support (1.2652/1.3023) late Monday, a heavy surge of buying was seen coming into the marketin the early hours of yesterday’s trade forcing price to connect with and eventually break above the 1.3100 handle. 1.3000 was actually a highlighted area to watch for potential buys in yesterday’s report – well done to any of our readers who managed to lock in some green pips from this move! Following the break above 1.3100, offers around 4hr supply at 1.3180-1.3140 quickly shoved price back down to retest this number as support.
Buying at 1.3100 today would be considered a risky trade in our book due to not only near-term 4hr supply lurking just above, but also the fact that despite price has seen a reaction off of the weekly ignored Quasimodo level at 1.3014; the market is still trading around the underside of a weekly swap (resistance) level at 1.3128. As such, a more conservative approach might be to wait and see if prices can close above the 1.3200 handle before looking to join in this seemingly never-ending up trend.
With regards to selling this market, nonetheless, one could, if price breaks below 1.3100, look to trade any confirmed retest seen at this number. Your stop loss would need to be relatively tight here though in order to achieve favorable risk/reward down to the lower limit of the current 4hr ascending channel taken from the low 1.2652.
Levels to watch/ live orders:
- Buys: Watch for 1.3200 to be consumed and then look to enter on a retest of this number (confirmation required).
- Sells:Watch for 1.3100 to be consumed and then look to enter on a retest of this number (confirmation required).
USD/CHF:
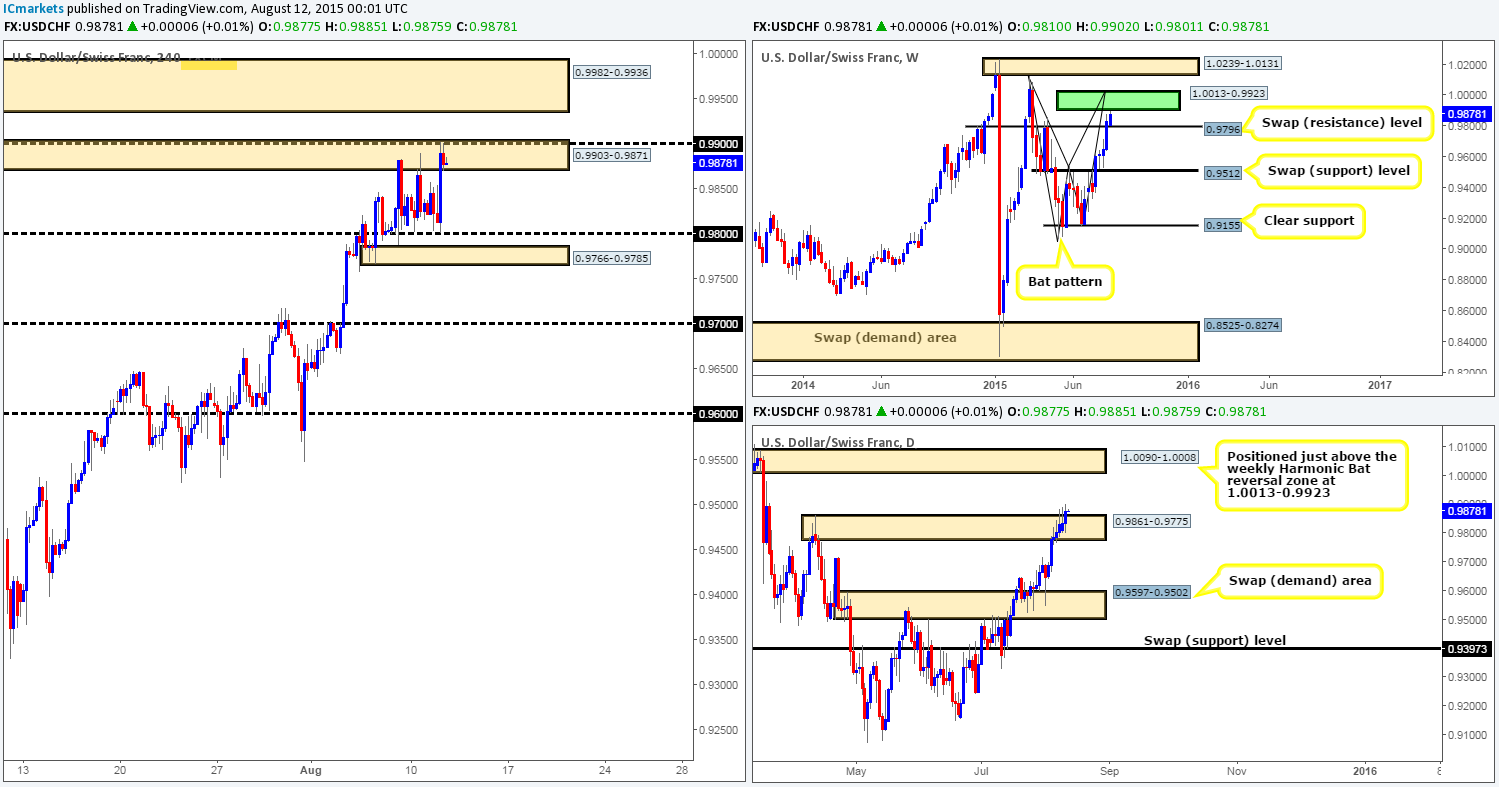
Although this pair did see some volatility during the course of yesterday’s sessions, price still remains consolidating (albeit within the upper limits now)between 4hr supply coming in at 0.9903-0.9871 and round-number support at 0.9800.
We currently have no interest in trading within this 4hr range. Instead, we have our eye on something a little bigger. Check out the daily timeframe; see how price recently engulfed the daily supply zone at 0.9861-0.9775, which could mean price is now free to its next target – the daily supply area at 1.0090-1.0008. Before we all go thinking ‘long this market’, take a peek at the weekly timeframe. Can you see how close price is to connecting with the lower limits of a weekly Harmonic Bat completion zone at 1.0013-0.9923? It is SUPER close! For this reason, our plan of attack today, and possibly for the remainder of the week, will consist of looking for lower timeframe confirmed sell trades within either the 4hr supply area located just above the current at 0.9982-0.9936, or an area of 4hr supply positioned much higher up on the curve at 1.0068-1.0046.
Notice that the closest 4hr supply zone is located nicely within our weekly Harmonic resistance area, while the other is positioned just above it within the daily supply zone mentioned above at 1.0090-1.0008. These two 4hr areas of supply are what we’d consider high-probability turning points in the market.
Levels to watch/ live orders:
- Buys: Flat (Stop loss: N/A).
- Sells: 0.9982-0.9936 [Tentative – confirmation required] (Stop loss: dependent on where one confirms this area since a fakeout could be seen above to parity) 1.0068-1.0046 [Tentative – confirmation required] (Stop loss: 1.0077).
DOW 30:
Throughout the course of yesterday’s trade, the DOW index declined in value from a base of 4hr resistance coming in at 17659-17606, and only really saw any attempt to stabilize once price reached a 4hr Quasimodo support level at 17359 late in the U.S. session.
Given what we have seen, where do we stand in the bigger picture? Well, the weekly timeframe shows price is now retesting both the underside of the weekly range lower limit 17547and its converging weekly ascending channel support – turned resistance taken from the low 10402, which, as you can see, shows room for prices to continue south towards a weekly swap (support) level at 17135. Meanwhile, on the daily timeframe, price is still seen hovering around the top-side of daily demand at 17033-17355. However, going long from the support of this area is not really something we’d consider high probability, seeing as we may not only be going up against potentially strong weekly sellers here, butalso, against offers sitting at the 4hr swap (resistance) level at 17447.
On account of the above, here is what we have logged so far:
- If price breaks above and retests 17447 as support, we may consider an intraday long position as long as the lower timeframe price action is also agreeable, targeting the aforementioned 4hr resistance base. Our rationale behind this trade, even though theoretically we’d be going up against weekly sellers, is that there is clear space between these two 4hr levels for prices to move.
- With regards to selling this market, our team has come to a general consensus that until both the 4hr Quasimodo support level at 17359 and the 4hr demand area at 17285-17331 are taken out, we’ll not be selling this market. Below these two barriers is room for prices to move down to a distinct 4hr Quasimodo support level sitting at 17131, four points below the aforementioned weekly swap (support) barrier!

Levels to watch/ live orders:
- Buys: Watch for 17447 to be consumed and then look to enter on a retest of this number (confirmation required).
- Sells:Watch for the 17285-17331 to be consumed and then look to enter on a retest of this area (confirmation required).
XAU/USD: (Gold)
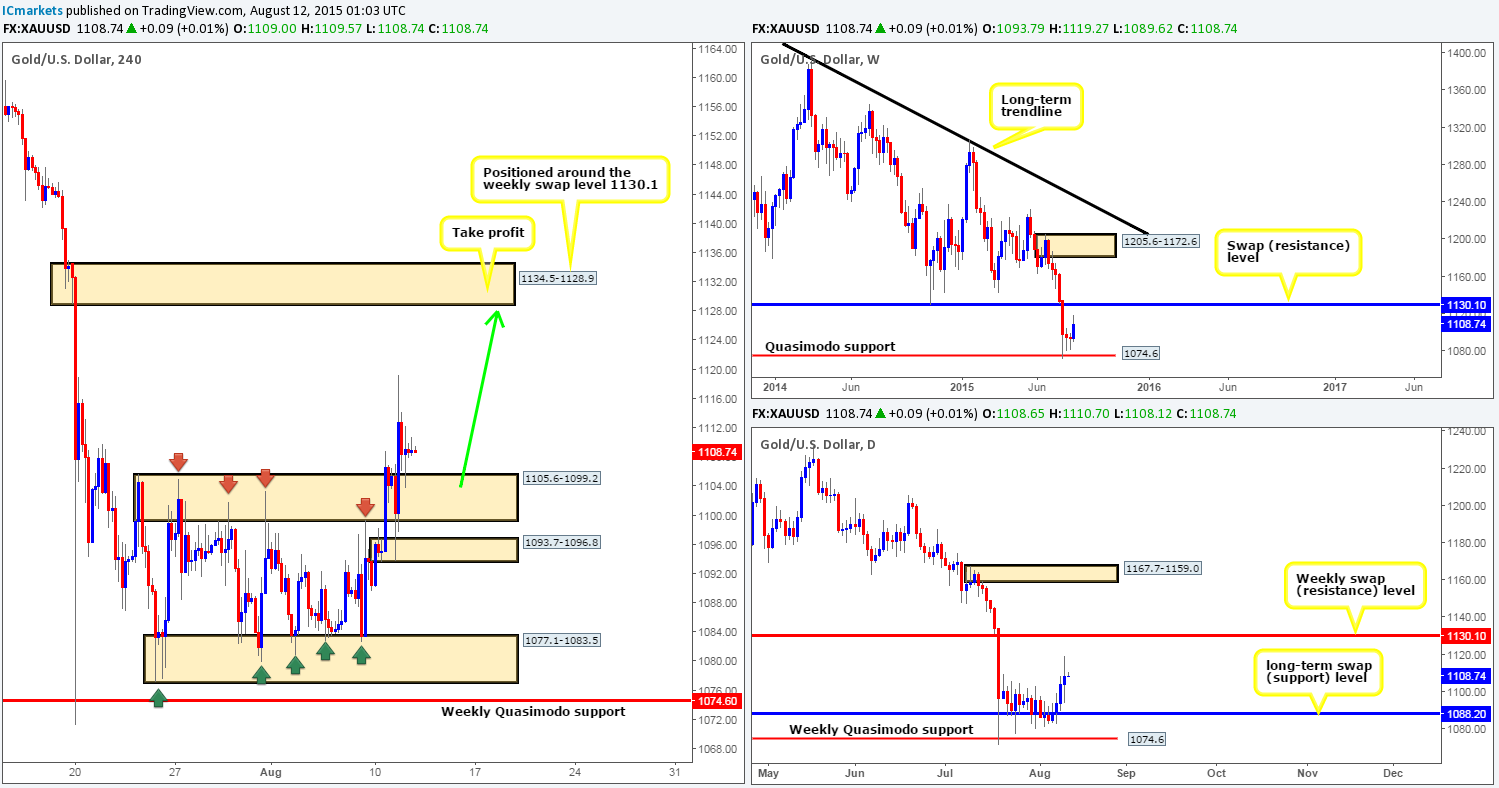
Recent action in the Gold market shows that the buyers have so far managed to hold price above the recently broken 4hr range top supply (now demand) at 1105.6-1099.2. However, a fakeout lower to a small 4hr demand base at 1093.7-1096.8 was indeed seen before further bids entered onto the scene – this is why we emphasize so much on waiting for the lower timeframes to confirm the majority ofour areas before jumping in!
With the retest of the demand at 1105.6-1099.2 appearing strong right now, there may be a long opportunity boiling up here with a single take-profit target in mind around the 4hr supply zone at 1134.5-1128.9. As we explained in yesterday’s report, our rationale behind looking for confirmed longs off of this area is as follows:
- Weekly and daily buyers may still be in the market from both the weekly Quasimodo support level at 1074.6 and the daily swap (support) level at 1088.2. Room is also being seen on both charts for prices to appreciate up to at least the weekly swap (resistance) level at 1130.1.
- Clear space is seen above the current 4hr range up to 4hr supply area just mentioned at 1134.5-1128.9, which, as you can see, is conveniently positioned around the aforementioned weekly swap (resistance) level.
Levels to watch/ live orders:
- Buys: 1105.6-1099.2 [Tentative – confirmation required] (Stop loss: dependent on where one finds confirmation in this area).
- Sells: Flat (Stop loss: N/A).


