EUR/USD:
Weekly Timeframe: The weekly timeframe shows that further downside has been seen, thereupon forcing the Euro into a weekly demand area formed back in early 2003 at 1.0499-1.0740.
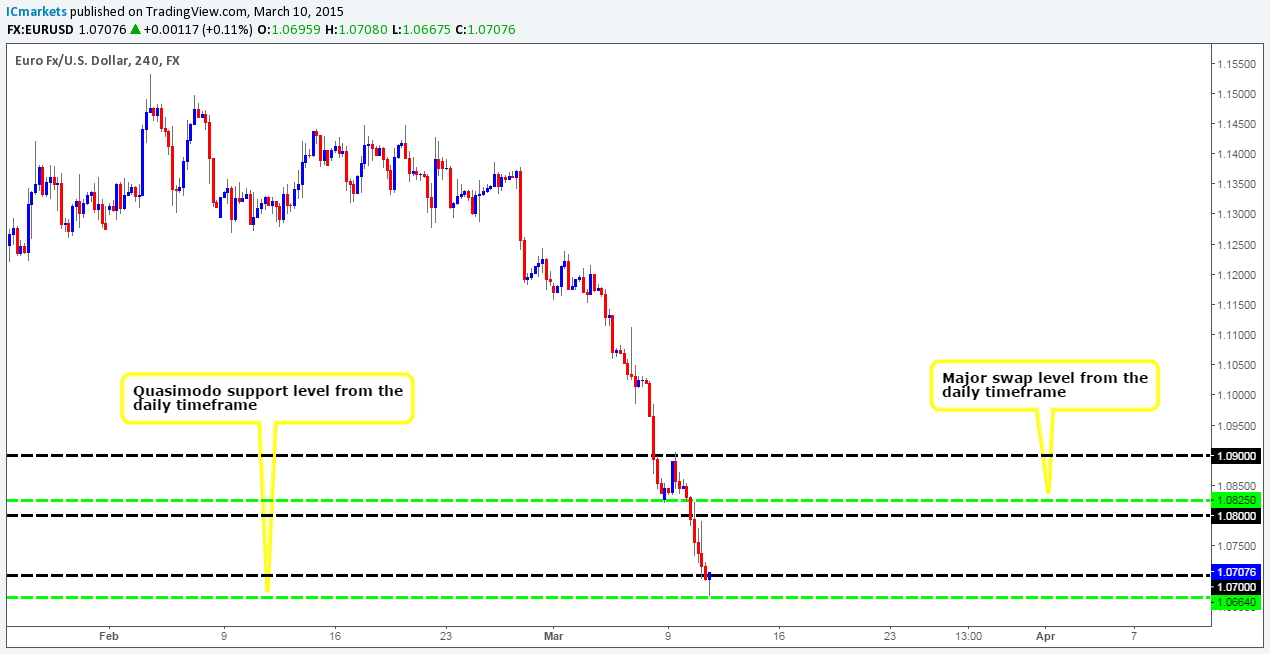
Daily Timeframe: From the daily timeframe, we can see that yesterday’s daily candle took out a major daily demand area coming in at 1.0760-1.0872 (encapsulates major daily swap level at 1.0825), and hit the daily Quasimodo support level coming in at 1.0664.
4hr Timeframe: The EUR/USD pair, as you can see, took out the 1.0800 barrier with relative ease, and dropped further south consequently faking below the 1.0700 number into the aforementioned daily Quasimodo support level.
We remain cautious about buying around the 1.0700 region considering the monster downtrend the Euro is in right now. Nevertheless, we cannot ignore the fact that this pair is, from a technical standpoint, in oversold territory (see above). Therefore, if we were to buy from here, we would need attractive confirmation from the lower timeframes.
In the event that further selling is seen today, and price manages to close below the aforementioned daily Quasimodo support level, this would, in effect, be our cue to begin watching for price to retest this line as resistance. However, any sells taken from here would (for us) require lower timeframe confirmation from the 30 minute timeframe and above, since let’s not forget that we would essentially be selling into weekly demand (1.0499-1.0740) at that point.

Current buy/sell orders:
- Buy orders: watching the 1.0700 region for lower timeframe confirmation (Predicative stop-loss orders seen at: dependent on where one confirms this level).
- Sell orders: Flat (Predicative stop-loss orders seen at: N/A).
GBP/USD:
Weekly Timeframe: At the time of writing, the weekly timeframe shows price hovering just above a weekly Quasimodo support level coming in at 1.5007.
Daily Timeframe: Yesterday’s daily candle wiped out Monday’s gains as the sellers drove price back down into the daily demand area seen at 1.4987-1.5061 (sits on top of the aforementioned weekly Quasimodo support level).
4hr Timeframe: From the 4hr timeframe, we can see that buying interest has recently been seen around a small 4hr demand area visible at 1.5020-1.5058. That being said though, the 1.5100 handle seen just above is proving to be a troublesome resistance barrier for longs to consume.
Therefore, given the points made above (specifically in bold), we have very little interest in shorting this market at the moment. If price closes above and successfully retests 1.5100 today however, we’d then begin looking for confirmed buys on the lower timeframes, targeting the 4hr swap area at 1.5163-1.5188.

Current buy/sell orders:
- Buy orders: Flat (Predicative stop-loss orders are seen at: N/A).
- Sell orders: Flat (Predicative stop-loss orders are seen at: N/A).
AUD/USD:
Weekly Timeframe: For the past five weeks, price has been trading around the upper limits of a weekly demand area seen at 0.7449-0.7678, which, as you may be able to see, converges beautifully with a long-term weekly trendline extended from the low 0.4775 (2001). Should a rally be seen here, weekly resistance (as far as we can see) is not expected to come into the market until around the 0.8064 region.
Daily Timeframe: Yesterday’s trading action shows that price closed below a daily swap level seen at 0.7691, and as a result, is now trading only a few pips from a major daily demand area coming in at 0.7449-0.7598 (located deep within the aforementioned weekly demand area).
4hr Timeframe: Recent events on the AUD/USD pair has capped price between the 0.7600 handle and a minor 4hr swap level seen at 0.7682.
A break above 0.7682 would likely clear the path north for further upside towards a small, yet extremely fresh 4hr supply area at 0.7738-0.7714. Because of how fresh this area is, we believe a bounce from here is highly likely, so much so that we’d be relatively comfortable (even though price is trading above higher-timeframe demand at the moment) trading a small position short from here at 0.7712. A break above this area however would give us the green light so to speak to being looking for longs up to 0.7802.
On the flip side, if price pushes below 0.7600 today, shorting on the retest could be a possibility due to the prevailing downtrend. However, one MUST remain fully aware that they would effectively be shorting into higher-timeframe demand (see above) at that point, so trade carefully.

Current buy/sell orders:
- Buy orders: Flat (Predicative stop-loss orders seen at: N/A).
- Sell orders: 0.7712 (half the usual position) (Predicative stop-loss orders seen at: 0.7741).
USD/JPY:
Weekly Timeframe: Recent events on the weekly timeframe show that price came within 17 pips to hitting the weekly Quasimodo resistance level seen at 122.18 before selling off.
Daily Timeframe: Yesterday saw the USD/JPY market form a nice-looking bearish pin bar candle around the lower limits of a daily supply area coming in at 122.61-121.54 (encapsulates the aforementioned weekly Quasimodo resistance level). Assuming that further selling is seen from here today, price will very likely visit the daily swap level positioned below at 120.45.
4hr Timeframe: From the 4hr timeframe, we can see that price cleanly faked above a 4hr supply area seen at 121.83-121.52, and sold off down towards the 121.00 hurdle where a little buying interest is currently being shown. The 121.00 mark is a significant level for us simply because if buying interest comes into the market here, this could suggest that higher-timeframe supply (see above) is weak. However, if price convincingly closes below this number, we’re confident that a sell off will be seen down to the aforementioned daily swap level coming in at 120.45.
Under the above circumstances, our team has no interest in buying this market at the moment for the reasons stated above in bold. We are, however, interested in shorting (with lower timeframe confirmation) if price closes below and retests 121.00 as resistance. Partial profits (if a trade is executed) will be taken at 120.45, where at which point, our stop will then be moved to breakeven.

Current buy/sell orders:
- Buy orders: Flat (Predicative stop-loss orders seen at: N/A).
- Sell orders: Flat (Predicative stop-loss orders seen at: N/A).
USD/CAD:
Weekly Timeframe: Overall, price action on the weekly timeframe remains relatively unchanged. The USD/CAD pair is still seen capped to the upside by a weekly Quasimodo resistance level visible at 1.2765.
Daily Timeframe: Yesterday’s daily candle saw price close above the 1.2662 high, which, as we mentioned yesterday, would likely clear the path north for the market to rally higher and test the aforementioned weekly Quasimodo resistance level once again.
4hr Timeframe: From the 4hr timeframe, we can see that price has closed above 4hr supply at 1.2662-1.2616, and is now trading a stone’s throw away from the 1.2700 handle.
As mentioned in the previous analysis, we were not looking to buy the break up to 1.2700, or even sell at this round number. Instead, we were (and still are) looking to sell any fakeout above 1.2700 into 4hr supply at 1.2771-1.2736 (located just below the weekly Quasimodo resistance level at 1.2765).
Taking all of the above into account, our team has set a pending sell order at 1.2727 (just below the aforementioned 4hr supply area) in an attempt to try and catch price at its extreme (if a fakeout occurs that is).

Current buy/sell orders:
- Buy orders: Flat (Predicative stop-loss orders seen at: N/A).
- Sell orders: 1.2727 (Predicative stop-loss orders seen at: 1.2775).
USD/CHF:
Weekly Timeframe: The current situation on the weekly timeframe shows price trading at the underside of a weekly Quasimodo resistance level coming in at 0.9970.
Daily Timeframe: Yesterday saw the market print a full-bodied bullish candle, which absolutely obliterated the daily swap area at 0.9866-0.9918. On top of that, the buyers, as you can probably see, were able to close price above the aforementioned weekly Quasimodo resistance level.
4hr Timeframe: Taking all of the above into account, where does this leave us on the 4hr timeframe? Well, looking for confirmed shorts around parity 1.0000 is definitely an option; however, we’re a little concerned about the daily close seen yesterday above the weekly Quasimodo resistance level (see above).
With that being said, our team has come to a general consensus that both shorts and longs are possibilities today… If price closes above 1.0000, this will effectively be our cue to begin watching for price to retest this level as support. Any buy trades taken from here will need lower timeframe confirmation, and the first-take profit target for us will be set at 1.0065 (another weekly Quasimodo resistance level). Conversely, if a sell signal is seen on the lower timeframes around 1.0000, we’ll look to ride price down to 1.9900.

Current buy/sell orders:
- Buy orders: Flat (Predicative stop-loss orders seen at: N/A).
- Sell orders: 1.0000 [Tentative – confirmation required] (Predicative stop-loss orders seen at: dependent on where one confirms price).
DOW 30:
Weekly Timeframe: The weekly timeframe shows that further downside is currently being seen on the DOW at the moment. Provided that the sellers can continue with this tempo, we might, just might, see price retest the ignored weekly Quasimodo level at 17135 again.
Daily Timeframe: The recent selling has forced the market to trade within a few points of daily demand seen at 17561-17655. This area, in our opinion, is a key obstacle to a move south towards the ignored weekly Quasimodo level mentioned above.
4hr Timeframe: From the 4hr timeframe; we can see that the buyers and sellers are now battling for position around the low 17680. This low, although very prominent, will likely give way during the more volatile sessions today, simply because there is a fresh 4hr demand area lurking just below with ‘trade me long’ written all over it at 17561-17617. What is more, if you look back to the daily chart, you’ll notice that this 4hr demand is located within the extremes of the aforementioned daily demand area.
Given the points made above, and the current location of price, our team has no interest in selling this index at the moment. With regards to buying however, the aforementioned 4hr demand area is certainly attractive to us, so much so that we are placing a pending buy order just above it at 17625.

Current buy/sell orders:
- Buy orders: 17625 (Predicative stop-loss orders seen at: 17553).
- Sell orders: Flat (Predicative stop-loss orders seen at: N/A).
XAU/USD (Gold):
Weekly Timeframe: The weekly timeframe shows that price is currently trading just below a weekly demand area coming in at 1166.8-1195.0. Assuming that the sellers can hold out below this zone, we feel there’s a good chance that further downside will be seen towards the weekly decision-point demand level coming in at 1136.3.
Daily Timeframe: From the pits of the daily timeframe, we can see price is holding below the recently broken daily Quasimodo support level at 1170.5. Further selling from here is very likely since (as far as we can see) there is very little active demand to the left until price reaches the aforementioned weekly decision-point demand level.
4hr Timeframe: The latest coming in from the 4hr timeframe shows that the buyers and sellers are pulling for position between the descending channel support line extended from the low 1228.1, and the aforementioned daily Quasimodo support (now resistance) level.
Although on the higher timeframes there is very little obvious support seen down until the weekly decision-point demand level, the 4hr timeframe on the other hand shows that in order for price to drop thus far, the sellers would need to take out the 4hr demand area seen below at 1142.6-1152.1.
Given the points made above, we would not really feel comfortable buying this market at the moment. We would however, be interested in shorting any further retests (with confirmation) of the daily Quasimodo swap level (as per the red arrows). Assuming we find an entry here today, we’d try to ride price down to 1153.4 before moving our stop to breakeven, as our ultimate target would be 1138.0.

Current buy/sell orders:
- Buy orders: Flat (Predicative stop-loss orders seen at: N/A).
- Sell orders: 1170.5 [Tentative – confirmation required] (Predicative stop-loss orders seen at: N/A).


