
A note on lower timeframe confirming price action…
Waiting for lower timeframe confirmation is our main tool to confirm strength within higher timeframe zones, and has really been the key to our trading success. It takes a little time to understand the subtle nuances, however, as each trade is never the same, but once you master the rhythm so to speak, you will be saved from countless unnecessary losing trades. The following is a list of what we look for:
- A break/retest of supply or demand dependent on which way you’re trading.
- A trendline break/retest.
- Buying/selling tails/wicks – essentially we look for a cluster of very obvious spikes off of lower timeframe support and resistance levels within the higher timeframe zone.
- Candlestick patterns. We tend to only stick with pin bars and engulfing bars as these have proven to be the most effective.
We search for lower timeframe confirmation between the M15 and H1 timeframes, since most of our higher-timeframe areas begin with the H4. Stops are usually placed 5-10 pips beyond confirming structures.
EUR/USD:
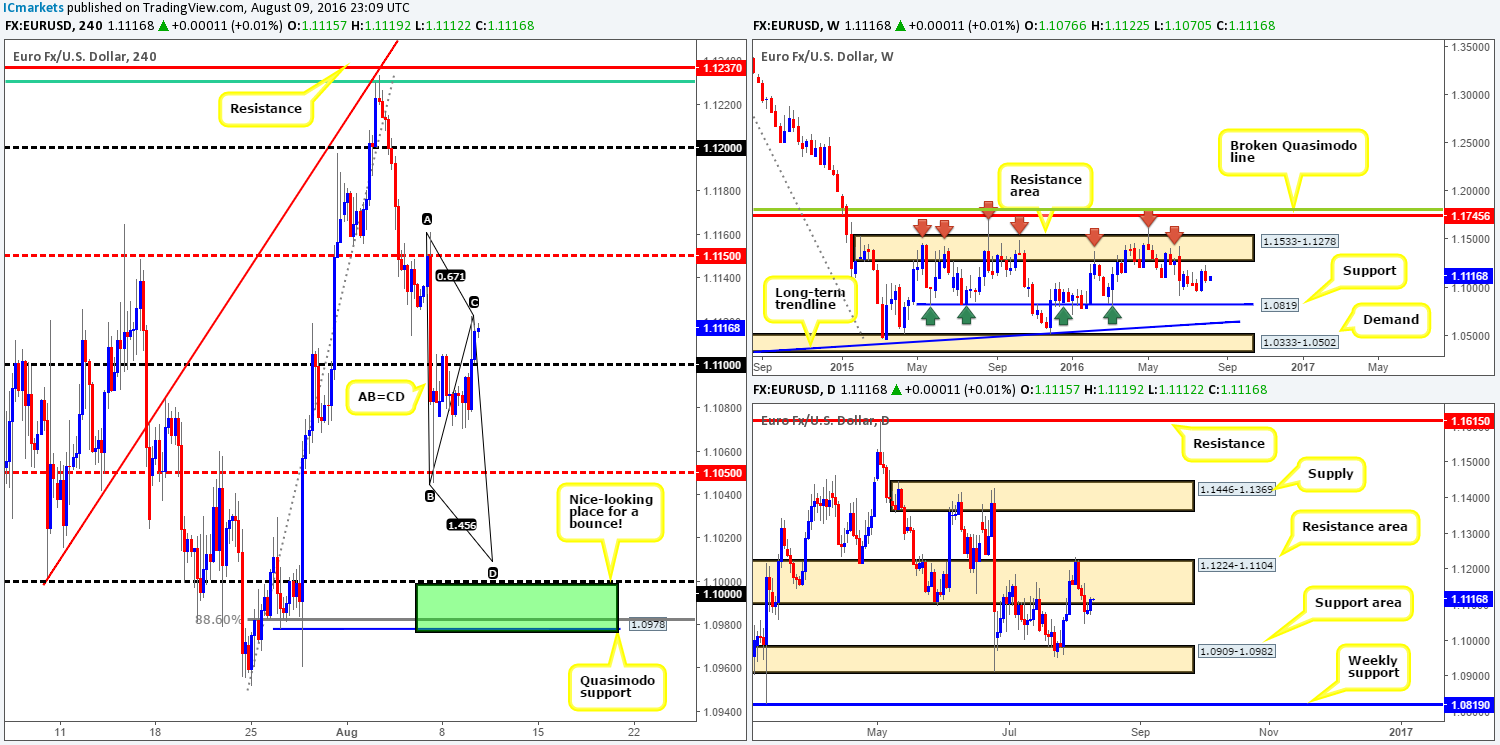
With the USDX seen plunging lower from H4 resistance at 96.50 yesterday, this, as can be seen from the chart, lifted the EUR pair above the 1.11 handle to highs of 1.1125 on the day. Despite this recent recovery, our team still favors further downside. Here’s why:
- Possible H4 three-drive formation is now seen in the works taken from the high 1.1233. In the event that this pattern does complete, there’s also, as we hope is demonstrated on the chart, a potential H4 AB=CD bullish pattern completing just ahead of the key figure 1.10.
- Daily is now seen flirting with the lower edge of a daily resistance area at 1.1224-1.1104.
Our suggestions: In light of the points made above, here’s what we have logged going forward:
Watch for the EUR to close below the 1.11 mark. A close below here followed by a retest and a lower timeframe sell signal is a valid trigger to short, targeting the H4 mid-way support 1.1050 and the 1.10 handle. What we mean by a lower timeframe sell signal is either a break of demand followed by a retest, a trendline break/retest or simply a collection of well-defined selling wicks around 1.11. This is, for lack of a better word, the icing on the cake if you will!
Should price reach 1.10, our team will look to switch from short mode and begin hunting for longs. 1.10 coupled with its nearby H4 Quasimodo support level at 1.0978, a supporting 88.6% H4 Fib level at 1.0983 (green zone) and the possible H4 AB=CD bull pattern we discussed above is a beautiful place to look for a bounce north this week. In addition to this, this buy zone sits around the top edge of a daily support area seen at 1.0909-1.0982 (the next downside target on the daily timeframe). Should price reach the 1.10 figure, our team would, dependent on the time of day, look to take a long position from this zone with our stops planted below the H4 Quasimodo low (1.0960) at 1.0958.
Levels to watch/live orders:
- Buys: 1.0978/1.10 [Dependent on the time of day and approach to the zone, a market order from here is a possibility] (Stop loss: 1.0958).
- Sells: Watch for price to close below the 1.11 handle and look to trade any retest seen thereafter (lower timeframe confirmation required).
GBP/USD:
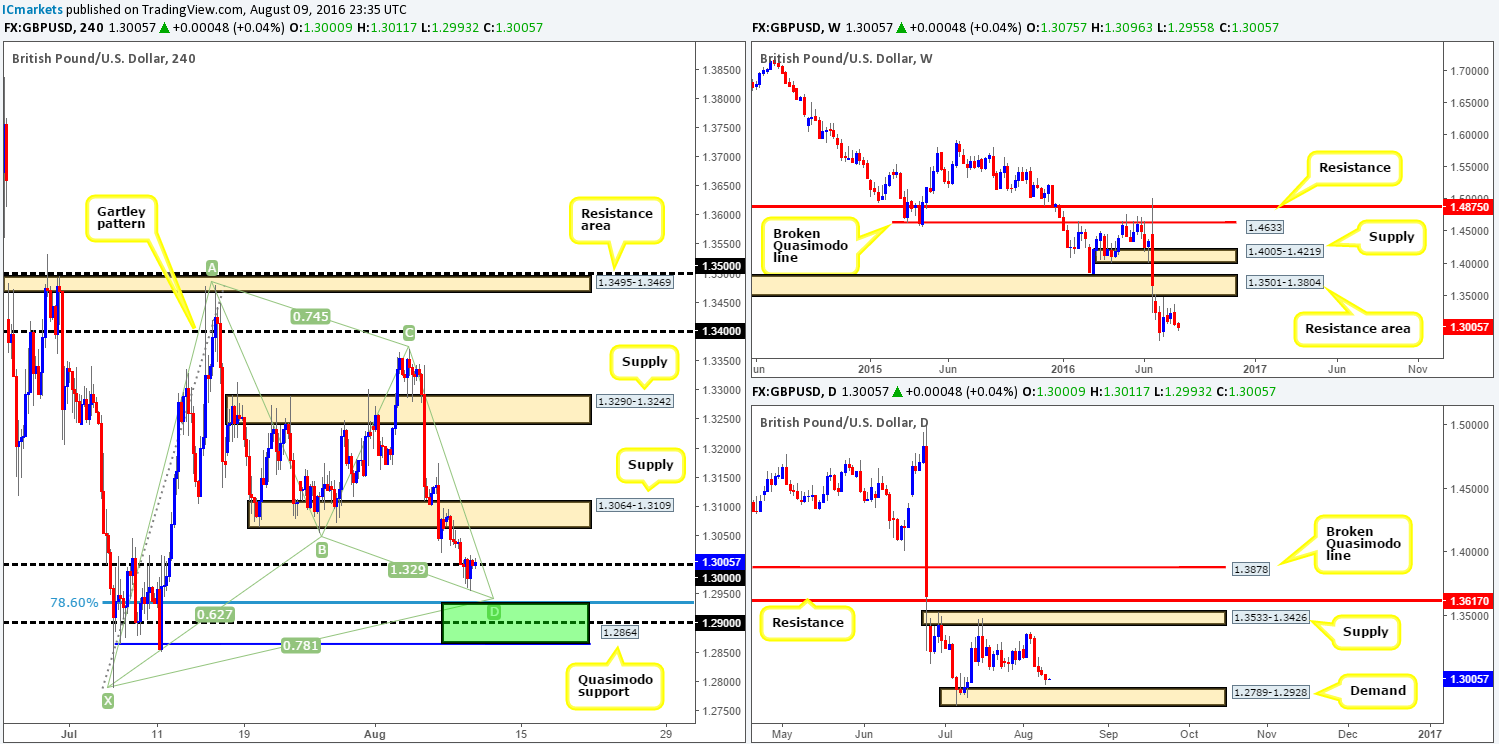
In recent trading, cable extended its bounce lower from the H4 supply zone coming in at 1.3064-1.3109. This move, as can be seen from the chart, saw price chomp through bids at the key figure 1.10 and push down to lows of 1.2956, before ending the day retesting 1.30 as resistance.
In view of daily action trading within striking distance of a daily demand base at 1.2789-1.2928 right now, what we’re hoping to see is the bears push lower from the 1.30 region today to connect with a H4 harmonic Gartley reversal zone fixed between 1.2864/1.2934. This green buy zone comprises of a H4 Quasimodo support, the 1.29 handle and a H4 78.6% Fib support. This barrier is also planted beautifully on top of the daily demand zone mentioned, thus highly likely to produce a bounce to the upside. As we mentioned in our previous reports, aggressive traders may look to place stops around the 1.2844 region, while more conservative traders might look to place their stops below the X point of the harmonic formation at 1.2778.
Our suggestions: Since this bullish pattern has formed within a bearish downtrend (easily seen on the weekly timeframe), we’d highly recommend waiting for lower timeframe confirmation to form before placing capital on the line. This could be in the form of an engulf of supply followed by a retest, a trendline/break retest or simply a collection of well-defined buying tails seen around the harmonic reversal zone. This, in our opinion, will likely get you in at a better price and potentially avoid unnecessary drawdown.
Levels to watch/live orders:
- Buys: 1.2864/1.2934 [Tentative – confirmation required] (Stop loss: dependent on where one confirms this area).
- Sells: Flat (Stop loss: N/A).
AUD/USD:
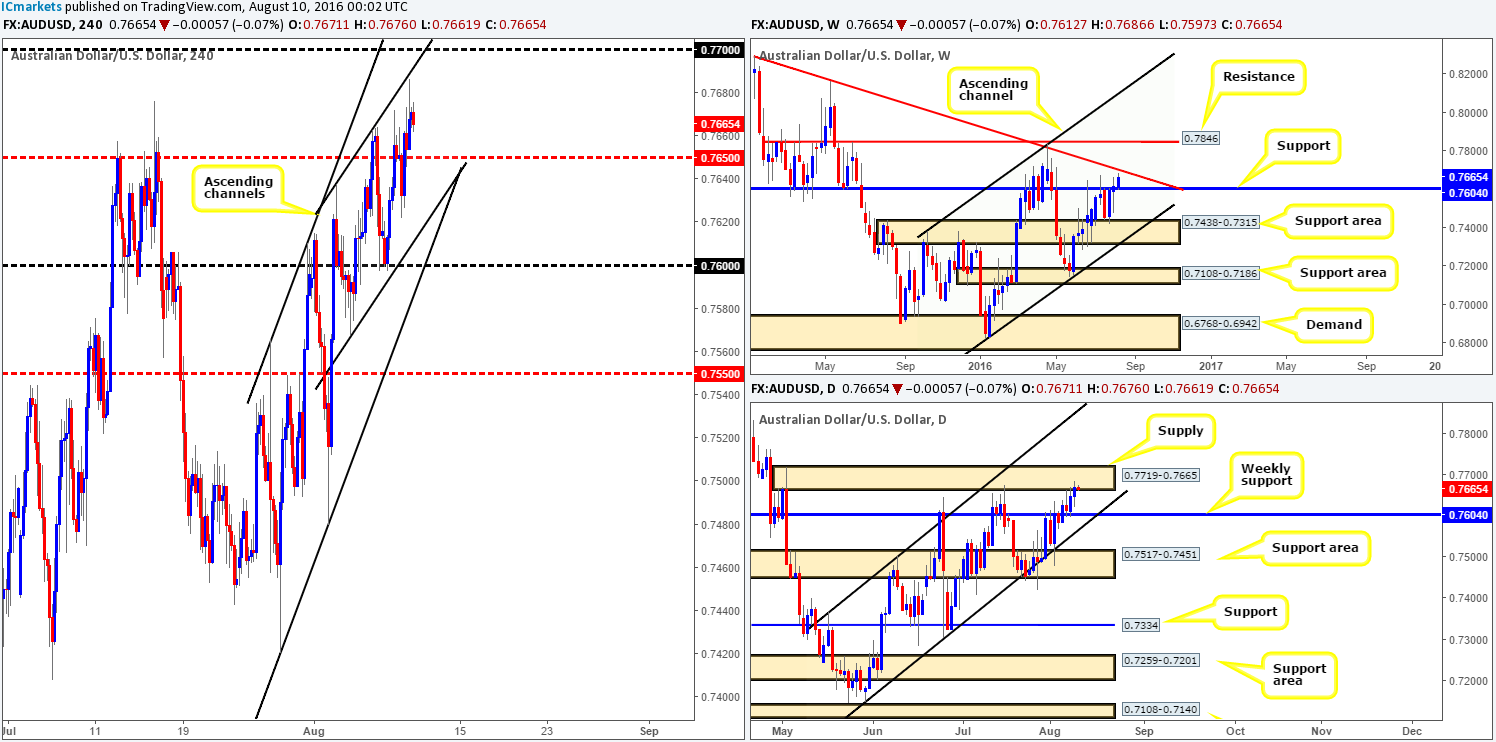
Using a top-down approach this morning, the weekly chart shows price is now trading within touching distance of a weekly trendline resistance extended from the high 0.8895, which has managed to hold the Aussie lower on two previous occasions. Turning our attention to the daily chart, the candles remain flirting with the lower edge of a daily supply area at 0.7719-0.7665 that merges nicely with the above said weekly trendline resistance. Obviously when two higher-timeframe resistance structures collide this, in our opinion, increases the chances of a bearish turnaround being seen from this region.
Jumping over to the H4 chart, price advanced north yesterday, breaking through the H4 mid-way resistance level at 0.7650 and managed to reach highs of 0.7686 by the day’s end. Although the commodity currency is selling off at the moment, we would need price to connect with the 0.77 handle before our team would look to become sellers in this seemingly overbought market. The reason being is that this number looks as though it fuses nicely with the weekly trendline resistance and sits within the extremes of the daily supply area as well as blends with a minor H4 channel resistance extended from the high 0.7637.
Our suggestions: Dependent on the time of day and H4 approach, our team would consider taking short positions from 0.77 at market, as we would then have the luxury of placing our stops above the current daily supply zone!
Levels to watch/live orders:
- Buys: Flat (Stop loss: N/A).
- Sells: 0.77 region [Dependent on the time of day and H4 approach] (Stop loss: 0.7725).
USD/JPY:
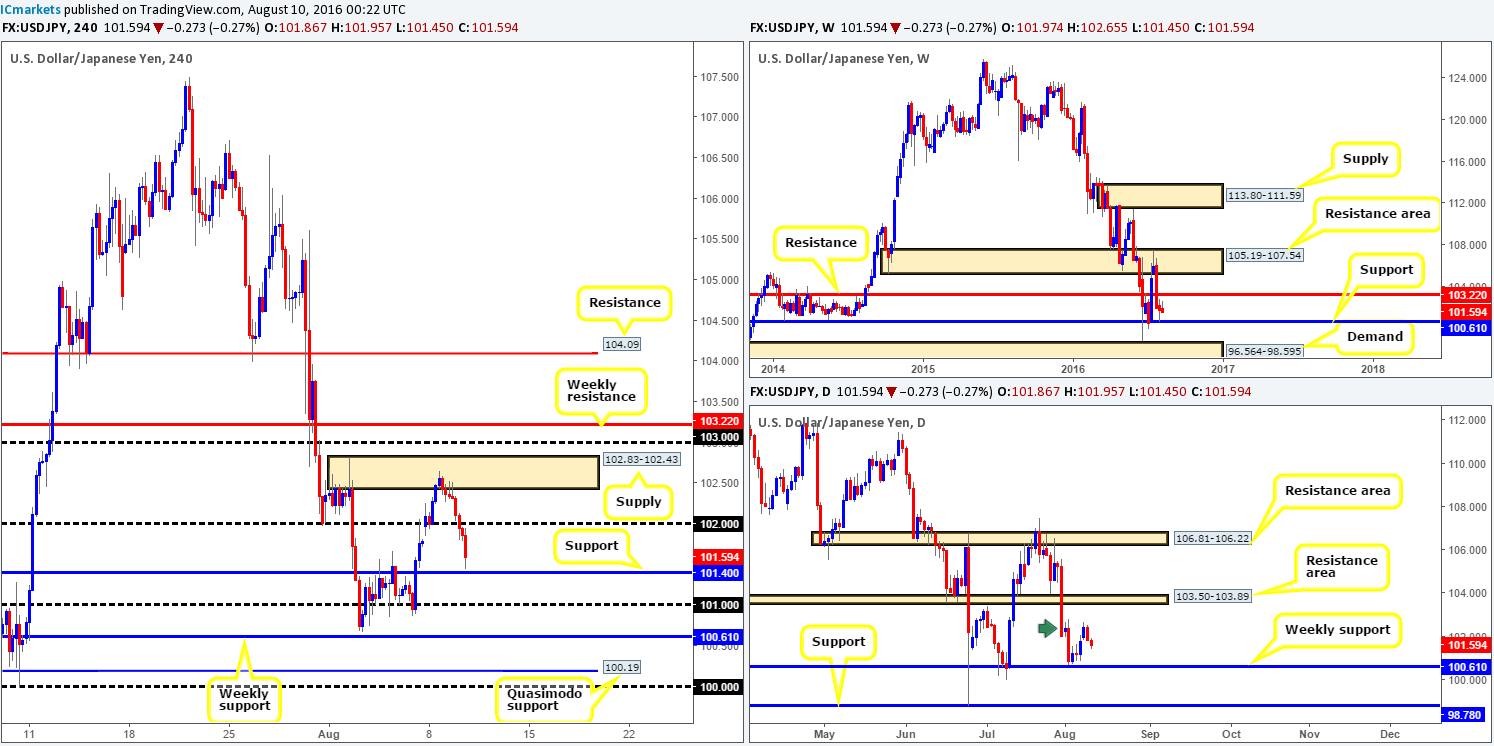
Recent action shows that the USD/JPY pair extended its bounce from the H4 supply zone seen at 102.83-102.43 yesterday, consequently taking out the 102 handle and erasing Monday’s gains. This could, given that the above said H4 supply is lodged within a minor daily supply area at 102.83-101.97 (green arrow), force the unit back down to retest the weekly support level seen at 100.61. At the time of writing, however, we can see that price is now trading within a cat’s whisker of connecting with H4 support at 101.40.
Our suggestions: To our way of seeing things, price could bounce from either the current H4 support or the 101 handle today. Be that as it may, with the weekly support lurking just below we feel this will be too strong of a magnet for price to produce any meaningful bounce from the H4 levels. Therefore, our team’s focus today will be on this weekly support level. Despite it being a higher-timeframe structure, however, waiting for lower timeframe confirmation is still highly recommended, since price could potentially fakeout down to the H4 Quasimodo support at 100.19, or even the key figure 100!
Levels to watch/live orders:
- Buys: 100.61 region [Tentative – confirmation required] (Stop loss: dependent on where one confirms this area).
- Sells: Flat (Stop loss: N/A).
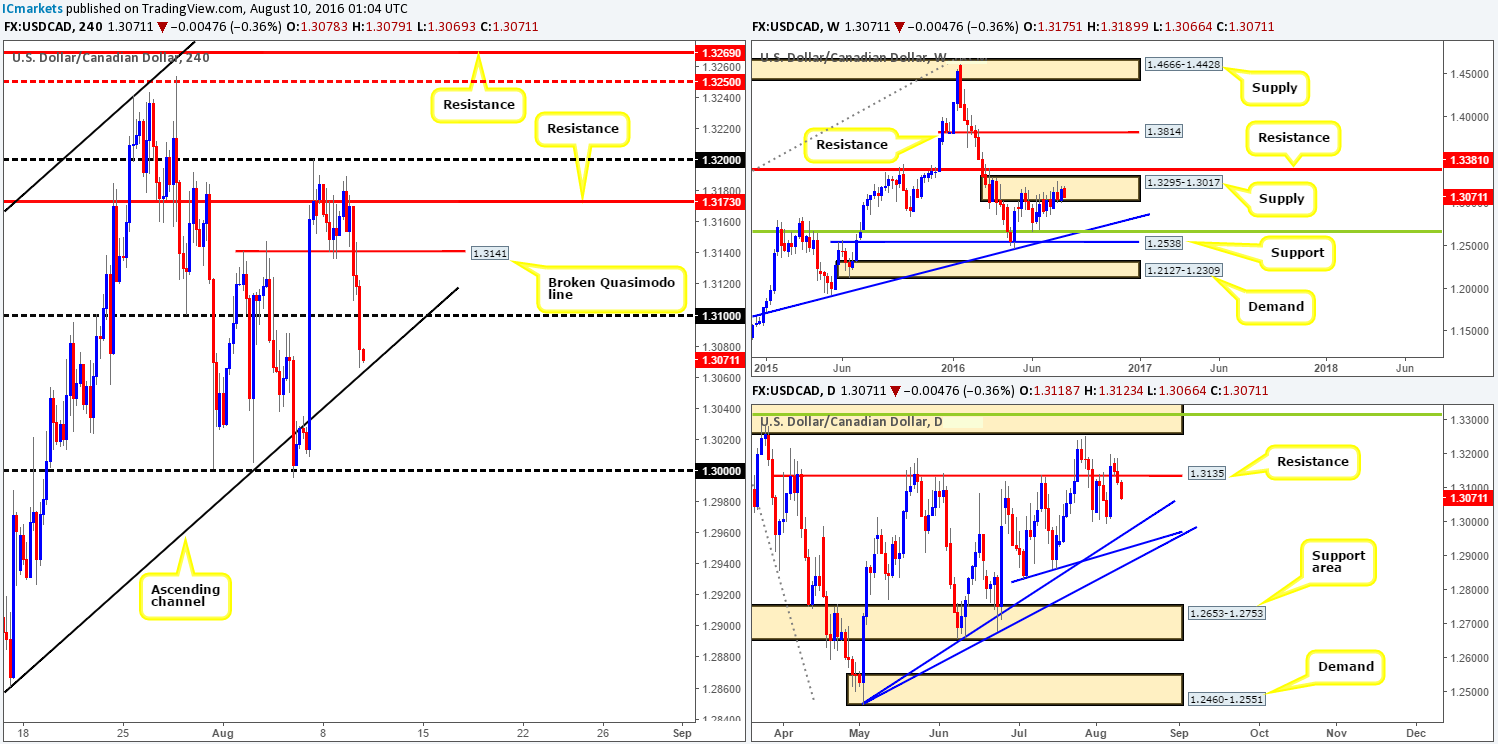
USD/CAD:
Mid-ways through yesterday’s London session the USD/CAD pair aggressively began to sell off. In one fell swoop, the H4 broken Quasimodo line at 1.3141 was taken out (now acting resistance) with the market closing the day just ahead of the 1.31 mark. This morning’s action, however, opened with a succession of offers which, as you can see, has slammed through 1.31 and come within reaching distance of a H4 channel support line extended from the low 1.2677.
While this H4 channel line is a logical area for price to bounce from, one may want to take into consideration where this recent selling has come from: a weekly supply zone drawn from 1.3295-1.3017. This – coupled with space seen to move down to a daily trendline support taken from the low 1.2460 on the daily timeframe, warns that this current H4 channel line may not be a good place to buy.
Our suggestions: With the above notes in mind, here’s what we have logged so far:
Watch for a break below/retest of the current H4 channel support line. This, alongside a favorable lower timeframe sell signal (see the top of this report) would be sufficient enough for us to jump in short targeting the key figure 1.30.
1.30 is not just a nice-looking take-profit level; it’s also a relatively stable buy zone. When extended to the right, the key figure merges beautifully with the above said daily trendline support. So whilst a buy from here would effectively be against weekly flow (see above), a bounce from this number is still high probability given the daily confluence. To be on the safe side though guys, do consider waiting for the lower timeframes to confirm 1.30 before risking capital here (see the top of this report). Fakeouts are, as you’re already likely aware, common around psychological boundaries!
Levels to watch/live orders
- Buys: 1.30 region [Tentative – confirmation required] (Stop loss: dependent on where one confirms this area).
- Sells: Watch for price to close channel support line and look to trade any retest seen thereafter (lower timeframe confirmation required).
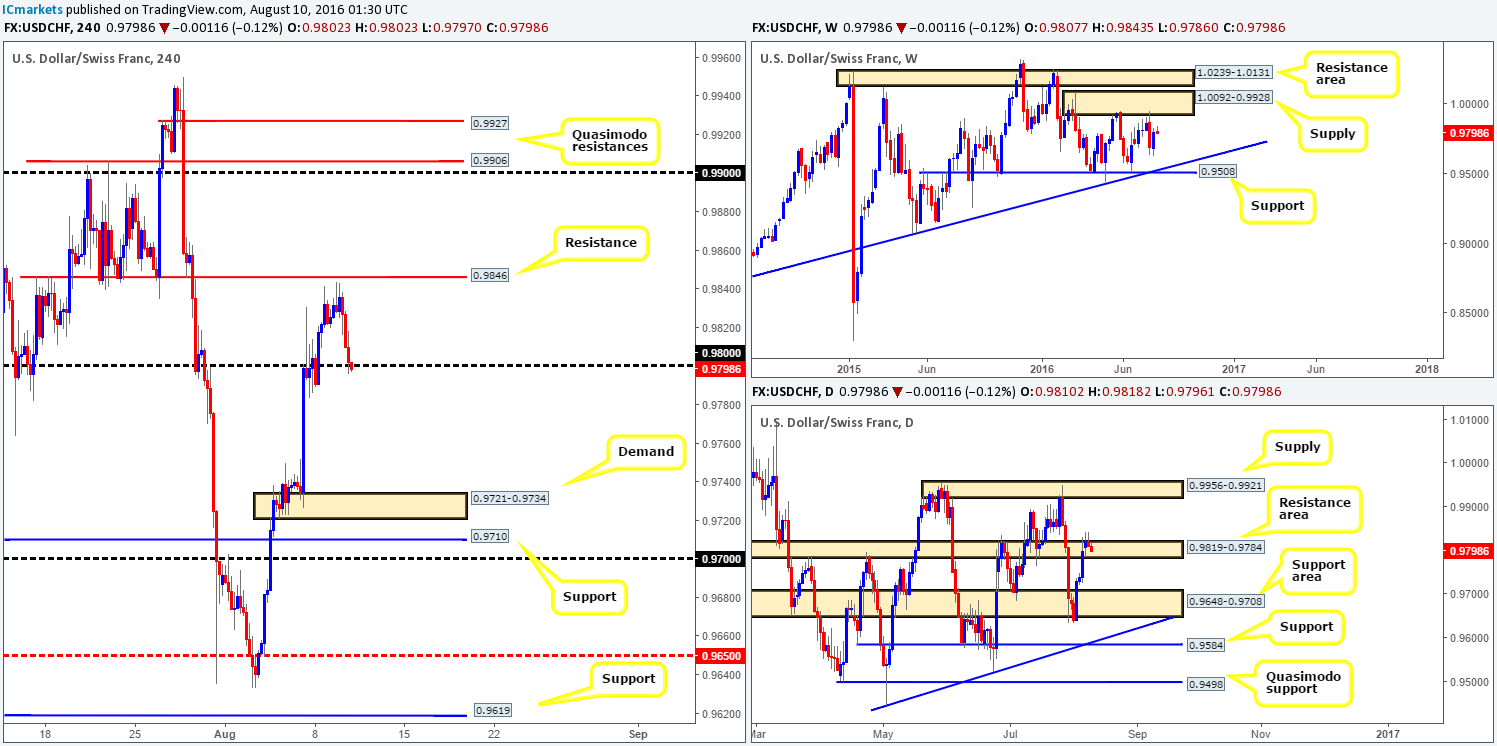
USD/CHF:
Starting with a look on the daily chart, we can see that price chalked up a picture-perfect daily selling wick yesterday, which pierced above a daily resistance area coming in at 0.9819-0.9784. Assuming that this candle encourages further selling in the market, the next downside target to have an eyeball on is the daily support area penciled in at 0.9648-0.9708. Over on the H4 chart, yesterday’s action came within a few pips of connecting with a H4 resistance level at 0.9846, before rather aggressively selling off into the close. Now, with the H4 candles seen trading around the 0.98 handle at the moment, with very little bullish intention seen so far, we feel this number may be on the verge of giving way. This – coupled with the above noted daily action could send the Swissy down to H4 demand at 0.9721-0.9734 today, which sits just above the aforementioned daily support area.
Our suggestions: Quite simply, watch for a decisive close below 0.98 today, followed by a retest and a lower timeframe sell signal (see the top of this report), targeting the above said H4 demand. Confirmation from the lower timeframes in these situations helps avoid being stopped out should price decide to whipsaw through the level on the retest.
Levels to watch/live orders:
- Buys: Flat (Stop loss: N/A).
- Sells: Watch for price to close below the 0.98 handle and look to trade any retest seen thereafter (lower timeframe confirmation required).
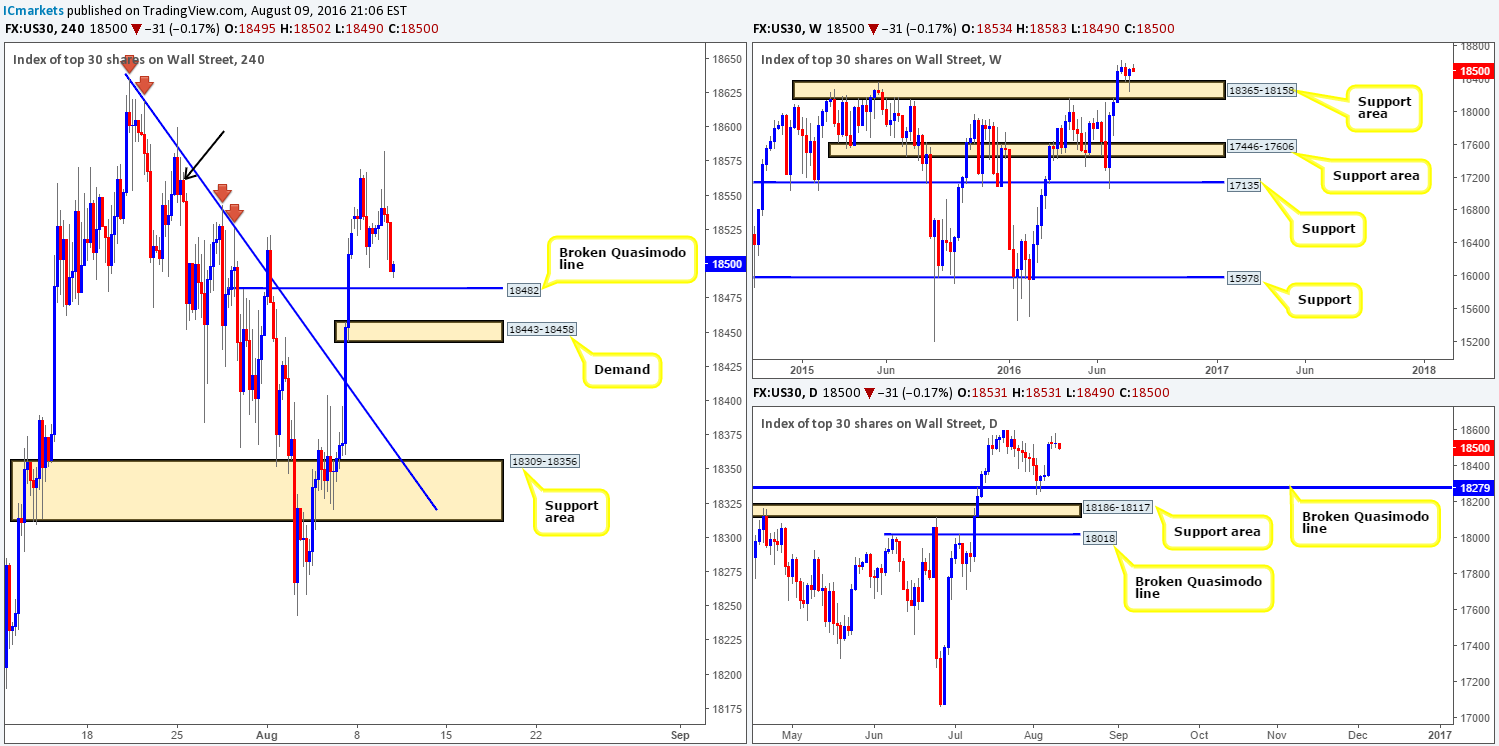
DOW 30:
So far, there’s been very little follow-through on the weekly chart following last week’s nice-looking weekly buying tail from a weekly support area drawn from 18365-18158. However, the week is far from over so a push higher may still come into view! Down on the daily chart, the DOW appears to be stalling ahead of the all-time high 18636. From a technical standpoint, there’s very little active supply seen to the left of current price so a move higher is still likely on the cards despite the indifference being seen from the buy-side of this market at the moment.
Moving over to the H4 chart, H4 supply at 18601-18551 (black arrow) once again managed to hold the unit lower yesterday. This, as you can see, forced the index down to a H4 broken Quasimodo line at 18482. This level and the small H4 demand kink at 18443-18458 is, at least in our opinion, the last lines of defense for the bulls, before price essentially has a free run back down to the H4 support area at 18309-18356 (sits within the above said weekly support zone).
Our suggestions: As of this point, our team remains in favor of a move higher still. Therefore, the levels we have on our radar this morning are:
- The H4 broken Quasimodo line at 18482.
- The small H4 demand kink at 18443-18458.
Both barriers are valid buy zones given the higher-timeframe structures. However, since there has been a rather lackluster response from the bulls recently, waiting for lower timeframe confirmation (see the top of this report) to form around these levels before risking capital might be the safer route to take. In regard to targets, our first line of interest would be around the 18540 region.
Levels to watch/live orders:
- Buys: 18428 region [Tentative – confirmation required] (Stop loss: dependent on where one confirms this area). 18443-18458 region [Tentative – confirmation required] (Stop loss: dependent on where one confirms this area).
- Sells: Flat (Stop loss: N/A).
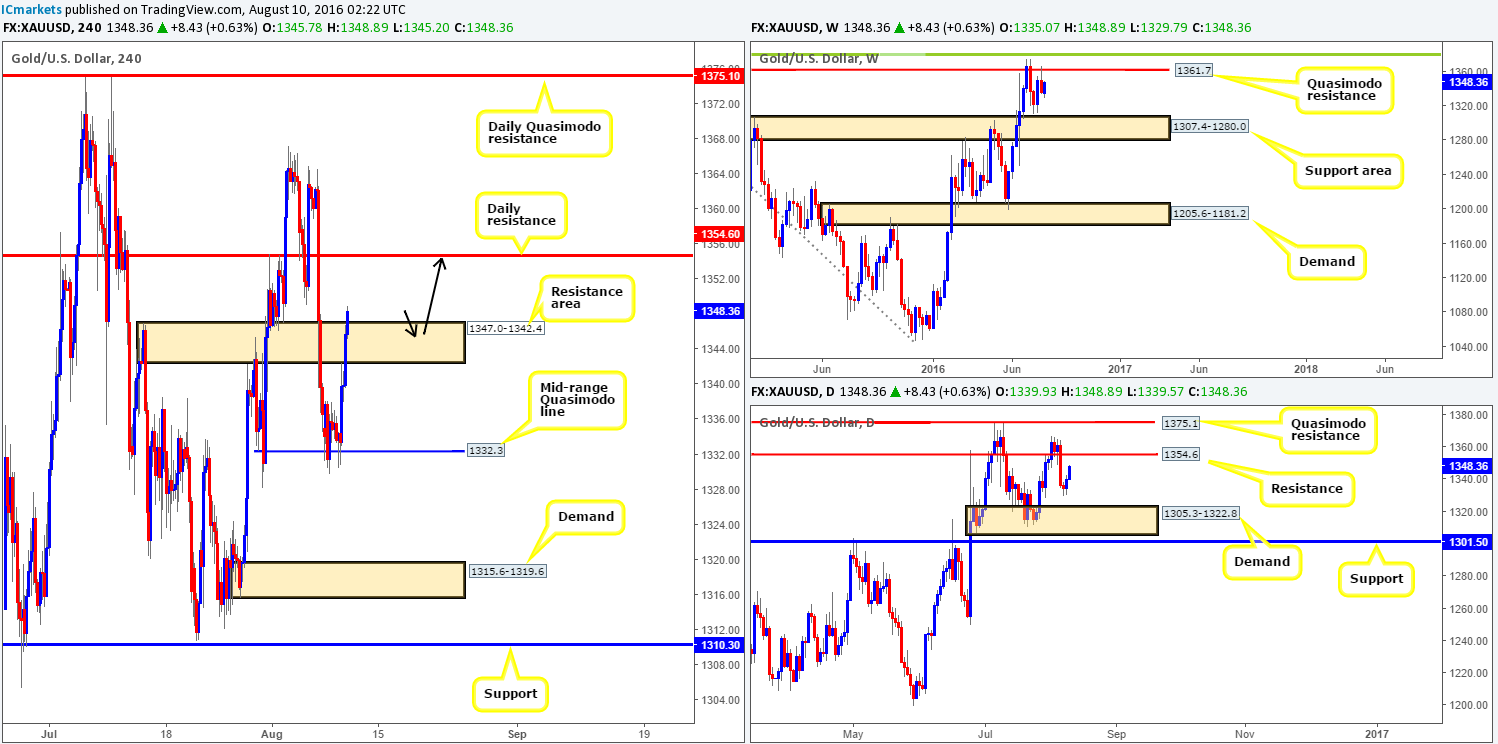
GOLD:
With the US dollar index plunging lower from H4 resistance at 96.50 yesterday, this saw the yellow metal advance higher from the H4 mid-range Quasimodo line at 1332.3. The recent buying brought price up into the jaws of a H4 resistance area at 1347.0-1342.4, which, as you can see, has just recently been engulfed.
In the event that the H4 closes above the current H4 resistance area, a long trade taken on the retest of this broken area is a high-probability move in our book (see black arrows). With stops placed below the traded area, one could look to target the daily resistance line seen at 1354.6, followed closely by the weekly Quasimodo resistance drawn from 1361.7.
Our suggestions: Watch for a close above the current H4 resistance area and look to trade any retest seen thereafter. We feel that waiting for lower timeframe confirmation (see the tip of this report) is the safer route to take, but given the clear run seen above this zone, a bullish H4 close following the retest would suffice.
Levels to watch/live orders:
- Buys: Watch for price to close above the H4 resistance area at 1347.0-1342.4 and look to trade any retest seen thereafter (lower timeframe confirmation preferred).
- Sells: Flat (Stop loss: N/A).


