
EUR/USD:
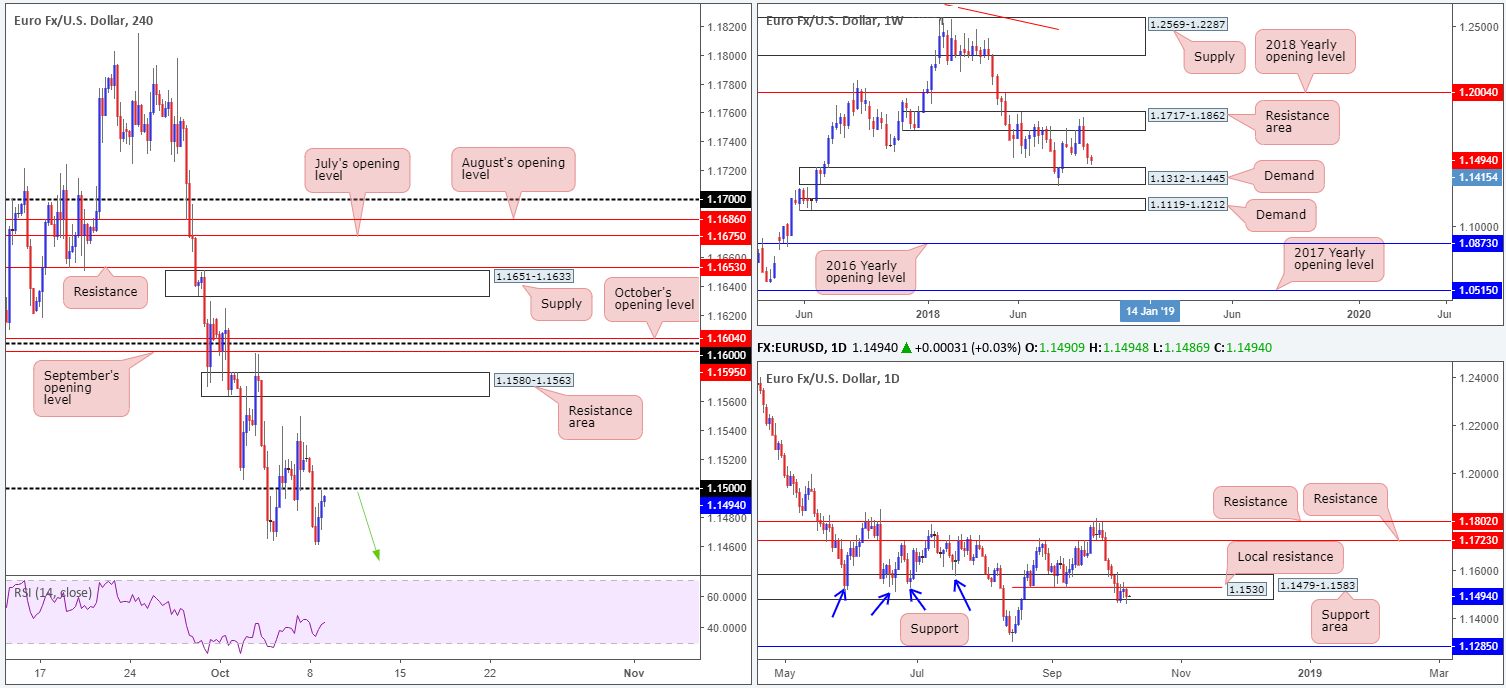
The shared currency sank to lows of 1.1460 vs. its US counterpart on Monday, amid uncertainty surrounding the Italian budget crisis and the EU. An EU Commission letter stated the targets in Italy’s budget are a source of ‘serious concern’.
Despite clocking lows not seen since August, the pair trimmed a portion of its intraday losses during US hours and came within striking distance of retesting the recently lost 1.15 handle into the close. With the unit refreshing multi-month lows, a retest of 1.15 will likely draw attention today.
On a wider perspective, traders might want to pencil in the possibility of weekly price shaking hands with a nearby demand area marked at 1.1312-1.1445. On the other side of the spectrum, though, we have daily price sandwiched between a support area at 1.1479-1.1583 and a local resistance level at 1.1530. Note the lower edge of the support area, although minor on this scale, has suffered numerous breaks to the downside. A decisive violation of 1.1530 could send the unit as far north as resistance drawn from 1.1723, while a pivotal break of 1.1479-1.1583 almost immediately places weekly traders within close proximity of its demand mentioned above at 1.1312-1.1445.
Areas of consideration:
Intraday movement, as highlighted above, is seen grappling sub 1.15 as of current price. A H4 bearish candlestick formation printed from this neighborhood would, given the fresh (H4) lower low and room to move lower on the weekly scale, likely be enough to pull the piece towards the top edge of weekly demand at 1.1445. Therefore, this is certainly a setup to keep eyeballs on today.
Today’s data points: Limited.
GBP/USD:
Brexit woes kept the British pound on the losing side on Monday, as the European Union and Britain continue to face each other down across the negotiating table.
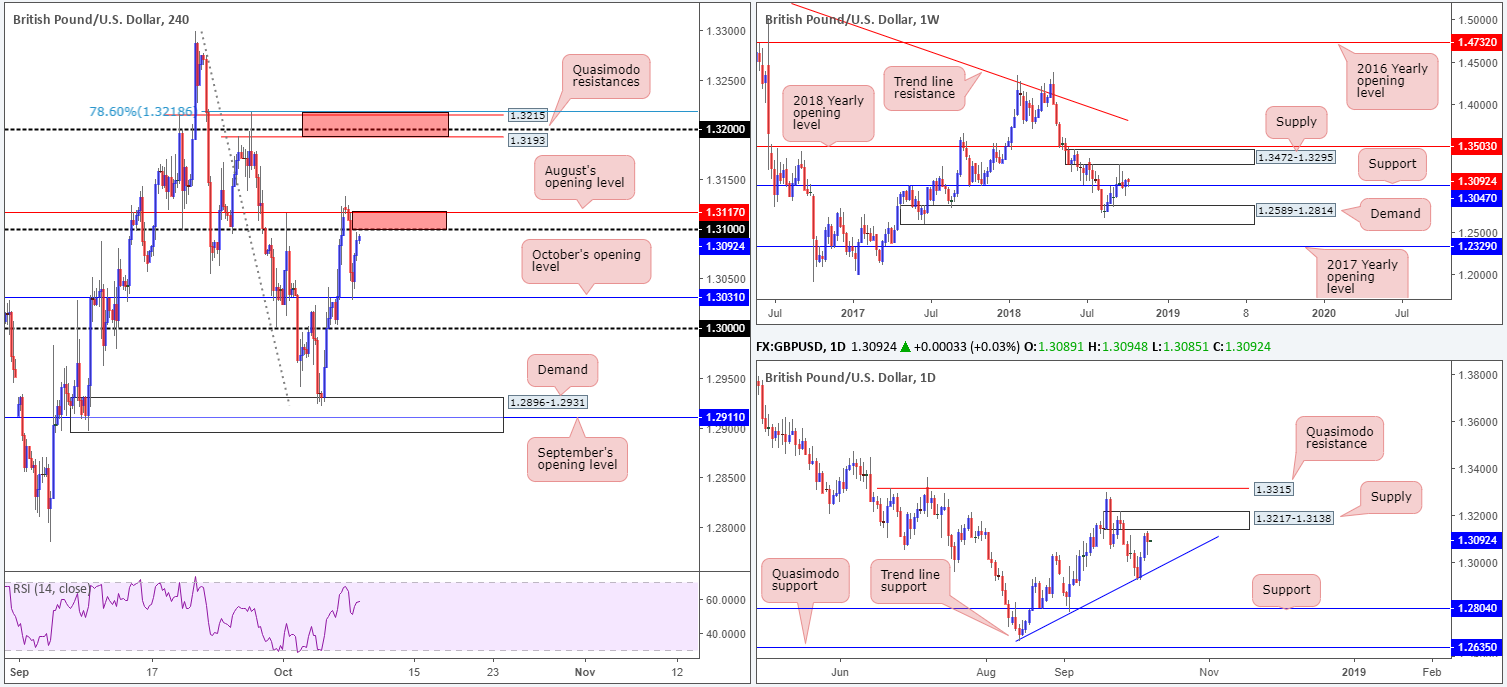
The British pound fell sharply in early European trade, firmly taking out its 1.31 handle on the H4 scale. As is evident from the chart, the pair eventually retested October’s opening level at 1.3031 and pared a large portion of recent losses from here amid US hours, consequently topping out the day just south of 1.31.
Likely bolstering yesterday’s recovery, aside from the US dollar pulling back from session highs of 96.03, was weekly support placed at 1.3047. Further buying on this scale has supply at 1.3472-1.3295 to target. The story on the daily timeframe, nonetheless, has the market positioned just south of supply emerging from 1.3217-1.3138. This base, according to this scale, is likely the last line of supply stopping weekly price from reaching its supply mentioned above at 1.3472-1.3295. For that reason, this is a key area to keep eyes on.
Areas of consideration:
Two points of interest are stand out this morning for possible selling opportunities:
- The lower red H4 area comprised of August’s opening level at 1.3117 and the round number 1.31. Although this base is positioned beneath the current daily supply, an intraday bounce lower (potential to drop as far south as October’s opening level at 1.3031) could still emerge from here. However, traders are urged to consider waiting for additional candlestick confirmation before pulling the trigger.
- Although the upper red H4 zone at 1.3218-1.3193 is positioned in the market before the weekly supply at 1.3472-1.3295 enters the fight, 1.3218-1.3193 is still highly likely to produce a bounce lower due to the following converging tools that make up its base:
- 78.6% H4 Fib resistance value at 1.3218.
- H4 Quasimodo resistance at 1.3215.
- 1.32 handle.
- H4 Quasimodo resistance at 1.3193.
- Located within the upper limits of daily supply at 1.3217-1.3138.
A H4 bearish candlestick formation printed from this red zone, therefore, would be considered a reasonably strong sell signal this week, with an initial downside target resting at 1.3117: August’s opening line.
Today’s data points: MPC member Broadbent speaks.
AUD/USD:
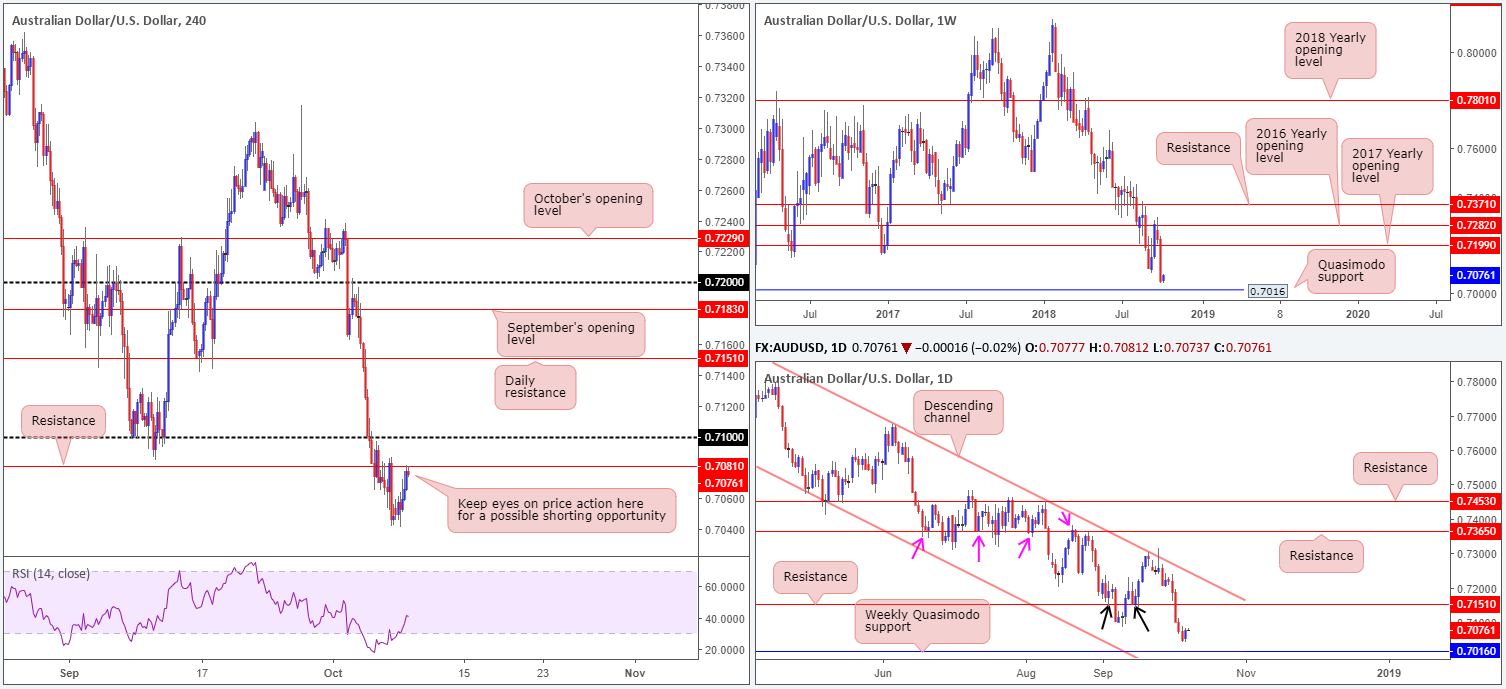
The Australian dollar kicked off the week on a high note, after US holiday-thinned volumes witnessed the buck offer some breathing space. The recovery from lows of 0.7041 lifted the pair towards H4 resistance at 0.7081, which, as you can see, is holding ground for the time being.
A firm H4 bearish candlestick signal from this level could spur further downside in this market, due to both weekly and daily structure exhibiting space to press as far south as the weekly Quasimodo support level drawn from 0.7016.
Areas of consideration:
Seeing as both weekly and daily charts indicate further downside this week, a strong H4 bearish candlestick pattern emerging off H4 resistance at 0.7081 is likely enough to draw in sellers today. Stop/entry parameters, for most traders, are likely to be dictated by the selected candlestick formation.
Today’s data points: AUD NAB business confidence.
USD/JPY:
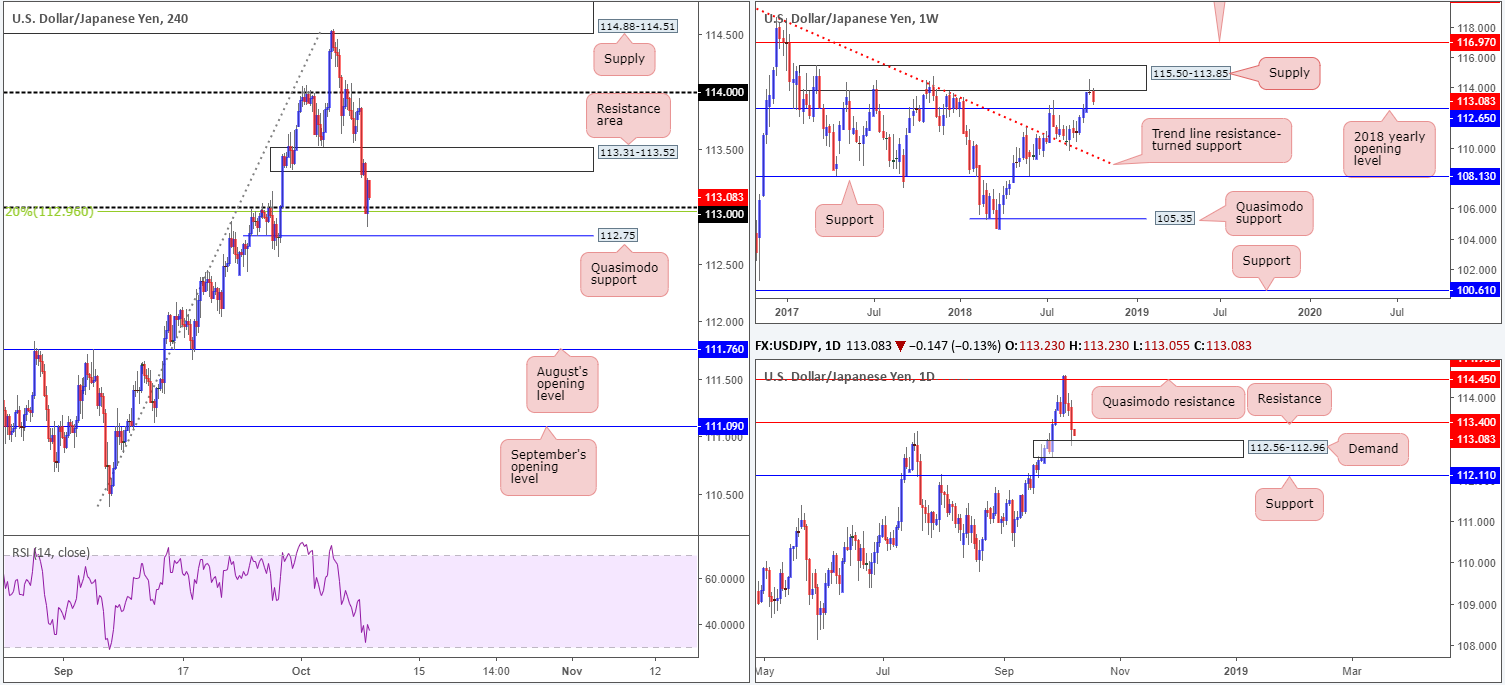
Kicking off this morning with a look at the weekly timeframe, the US dollar is seen poised to approach its 2018 yearly opening level at 112.65. This comes after the market engaged with a notable supply at 115.50-113.85 last week (boasts notable history, capping upside on a number of occasions throughout 2017) in the shape of a bearish pin-bar pattern.
In terms of where we stand on the daily timeframe, a nice-looking demand zone at 112.56-112.96 entered the fold yesterday, following a violent break of nearby support at 113.40 (now acting resistance).
Jumping over to the H4 timeframe, our technical studies witnessed a brief flicker of activity occur around its 113 handle/ 38.2% Fib support at 112.96 in recent trade. Structure on this scale, however, is somewhat restricted. Overhead, the demand-turned resistance area lurks nearby at 113.31-113.52 (houses daily resistance within at 113.40), while beneath 113 we have a nearby Quasimodo support in view at 112.75 (positioned ten pips above the 2018 yearly opening level on the weekly timeframe at 112.65). Traders may also want to acknowledge the RSI indicator is seen fast approaching its oversold value.
Areas of consideration:
Overall, the focus remains on the 2018 yearly opening level at 112.65 based on the weekly timeframe, as it is seen positioned within daily demand mentioned above at 112.56-112.96. A bounce from this vicinity is likely, with stop-loss orders located just beneath the current daily demand at 112.54. Ultimately, the first take-profit target can be seen around daily resistance at 113.40, which you may recall resides within the H4 resistance area at 113.31-113.52. This, should the trade come to fruition, offers incredible risk/reward in only a small move!
Today’s data points: Limited.
USD/CAD:
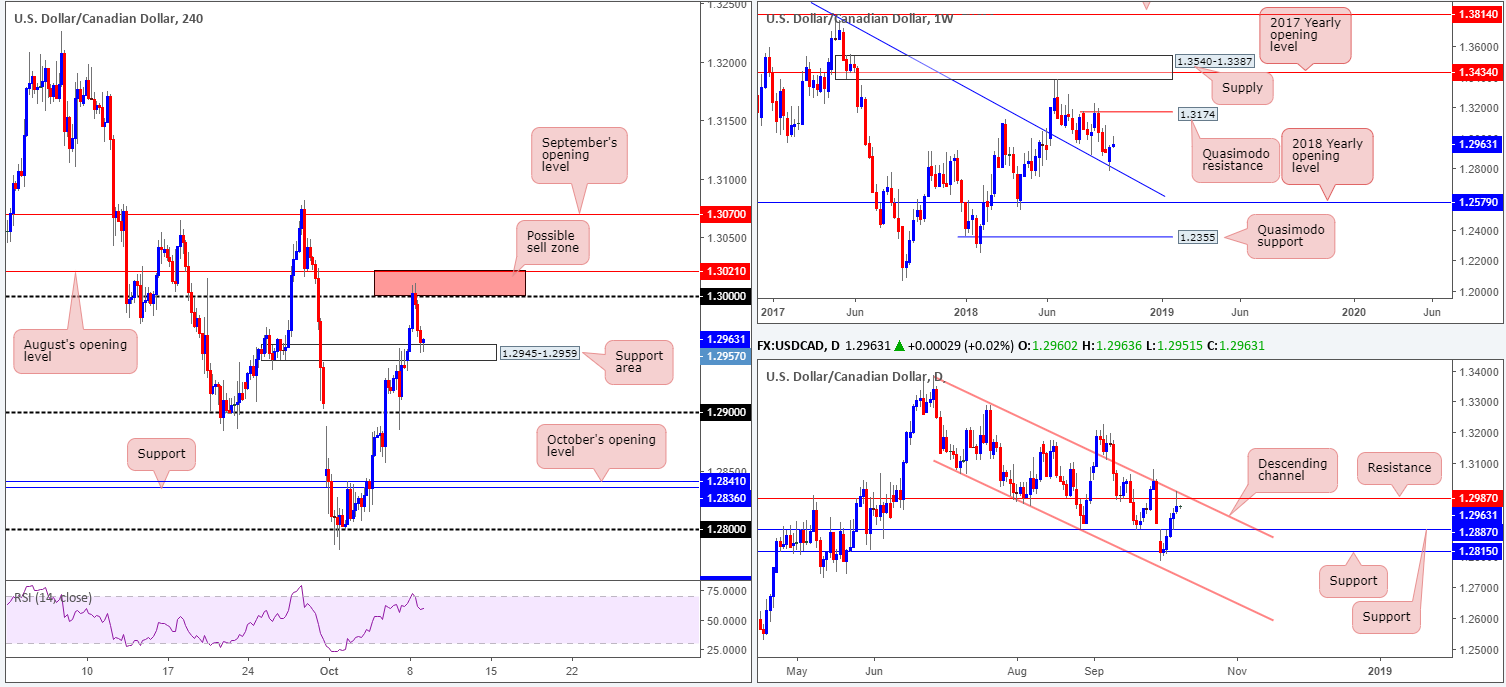
On the back of a stronger US dollar in early European hours on Monday, the USD/CAD pulled itself beyond the 1.30 figure to highs of 1.3010 before stalling and retreating to a nearby H4 support area at 1.2945-1.2959. For those who read Monday’s technical briefing you may recall the team underlined 1.3021/1.30 as a possible sell zone (comprised of August’s opening level and a round number).
The reason behind selecting 1.3021/1.30 came from the daily timeframe: a channel resistance (taken from the high 1.3386) and its converging resistance level priced in at 1.2987. Well done to any of our readers who managed to jump aboard this move. Also worth noting on the daily scale, yesterday’s movement formed a nice-looking bearish pin-bar pattern after connecting with the said structure. The next downside target from here can be seen at support chalked in at 1.2887.
Areas of consideration:
While further selling is possible on the daily timeframe, the current H4 support area mentioned above at 1.2945-1.2959 could hinder downside. Also worth taking into account is the weekly timeframe: its recent response off the trend line resistance-turned support (extended from the high 1.4689), with room to press as high as a Quasimodo resistance level parked at 1.3174.
Those short from 1.3021/1.30 may consider liquidating a portion of their position and reducing risk to breakeven. The threat of further upside on the weekly scale, along with the current H4 support area, should be enough of a red flag at this point. Assuming we continue lower, however, the second take-profit target falls in around 1.29, followed closely by the daily support level at 1.2887.
Today’s data points: CAD Gov. Council Member Wilkins speaks.
USD/CHF:
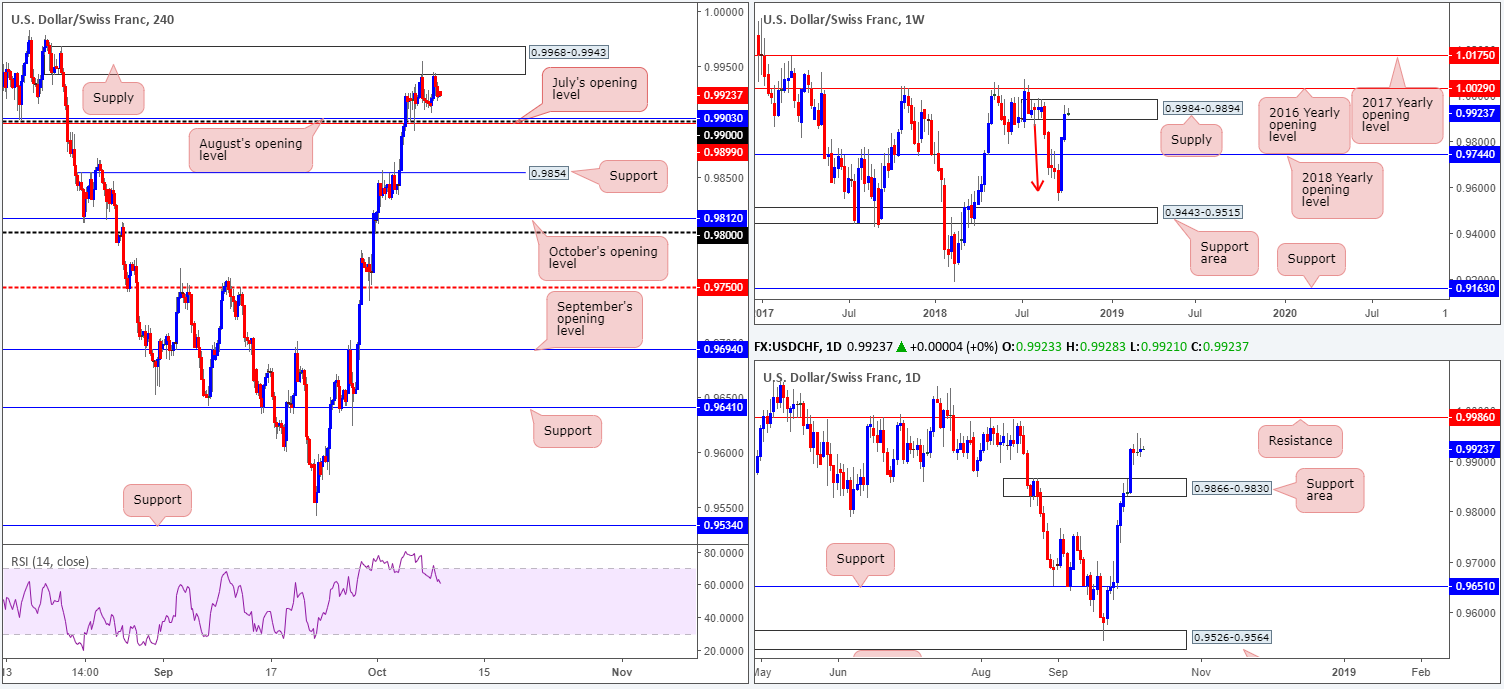
USD/CHF action remained pretty much unchanged on Monday, with the H4 candles continuing to range between supply at 0.9968-0.9943 and the 0.99 handle. Traders might want to acknowledge 0.99 is shadowed closely by two monthly opening levels from August and July at 0.9903 and 0.9899, respectively.
In light of yesterday’s lackluster performance, much of the following report will echo thoughts put forward in Monday’s analysis.
On the higher timeframes, weekly players are seen interacting with supply at 0.9984-0.9894. Although In terms of structure this area boasts solid momentum out of its base (red arrow), traders may want to pencil in the 2016 yearly opening level at 1.0029 in the event we push for higher ground this week. A closer look at price action on the daily timeframe shows Monday’s trade concluded forming another bearish pin-bar pattern. While we know this formation has taken shape within the aforementioned weekly supply, on the daily scale room to move north is seen towards resistance coming in at 0.9986 (sited two pips above the weekly supply). Should the pair push lower this week, the first area of concern can be seen at a support area carved from 0.9866-0.9830.
Areas of consideration:
Regardless of the fact daily price could advance to test its resistance level at 0.9986, H4 and weekly price are both seen selling off from supply. Couple this with back-to-back daily bearish pin-bar formations, we potentially have ourselves some strong sellers in the mix.
A H4 close beneath 0.99 is considered a bearish cue, given the overall picture. A retest of this number in the shape of a bearish candlestick formation would likely be enough to encourage sellers into the market. The only grumble here is limited space to maneuver. Close at hand, we have the top edge of a daily support area at 0.9866, followed closely by H4 support at 0.9854. Beyond here, the team would be eyeing October’s opening level at 0.9812, followed closely by the 0.98 mark as the next support targets.
Traders are urged to consider risk/reward parameters before pulling the trigger to short beneath 0.99. If you’re unable to lock in at least 1:1 to the first take-profit zone (0.9866), it may be best to pass and wait for something a little more substantial to come along.
Today’s data points: Limited.
Dow Jones Industrial Average:
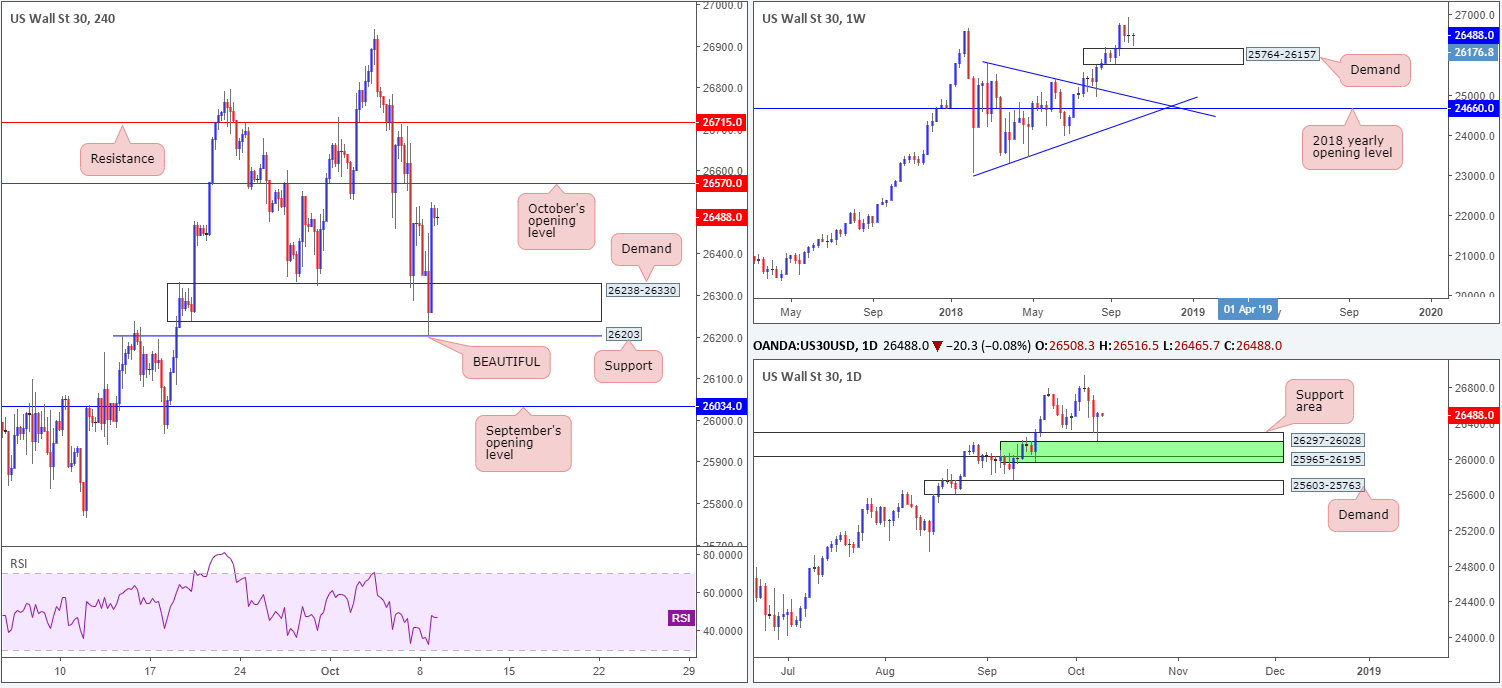
Holiday-thinned markets saw the H4 candles rush through the lower edge of a demand area drawn from 26238-26330 and test support at 26203 to the pip. The response off this line, which was a noted base to watch for longs in Monday’s report, was decisive, reaching session highs of 26523.
Yesterday’s bounce north, according to daily structure, was reinforced by not only a support area coming in at 26297-26028, but also demand shaded in green at 25965-26195 (both zones happen to be glued around the top edge of weekly demand at 25764-26157). What’s also notable from a technical perspective is the daily bullish pin-bar formation that took shape as a result of recent buying, which has likely caught the attention of candlestick enthusiasts.
Well done to any of our readers who managed to take advantage of 26203!
Areas of consideration:
On account of yesterday’s daily bullish pin-bar formation, further buying may be in store today. Traders, are however, urged to take into account October’s opening level at 26570 positioned on the H4 scale, followed by resistance at 26715.
Aside from the call off 26203, we do not really see much to hang our hat on at the moment. A long based off the daily bullish pin-bar pattern may work as a longer-term trade, though intraday sellers are expected obstruct price around its resistance at 26570.
Today’s data points: Limited.
XAU/USD (Gold):
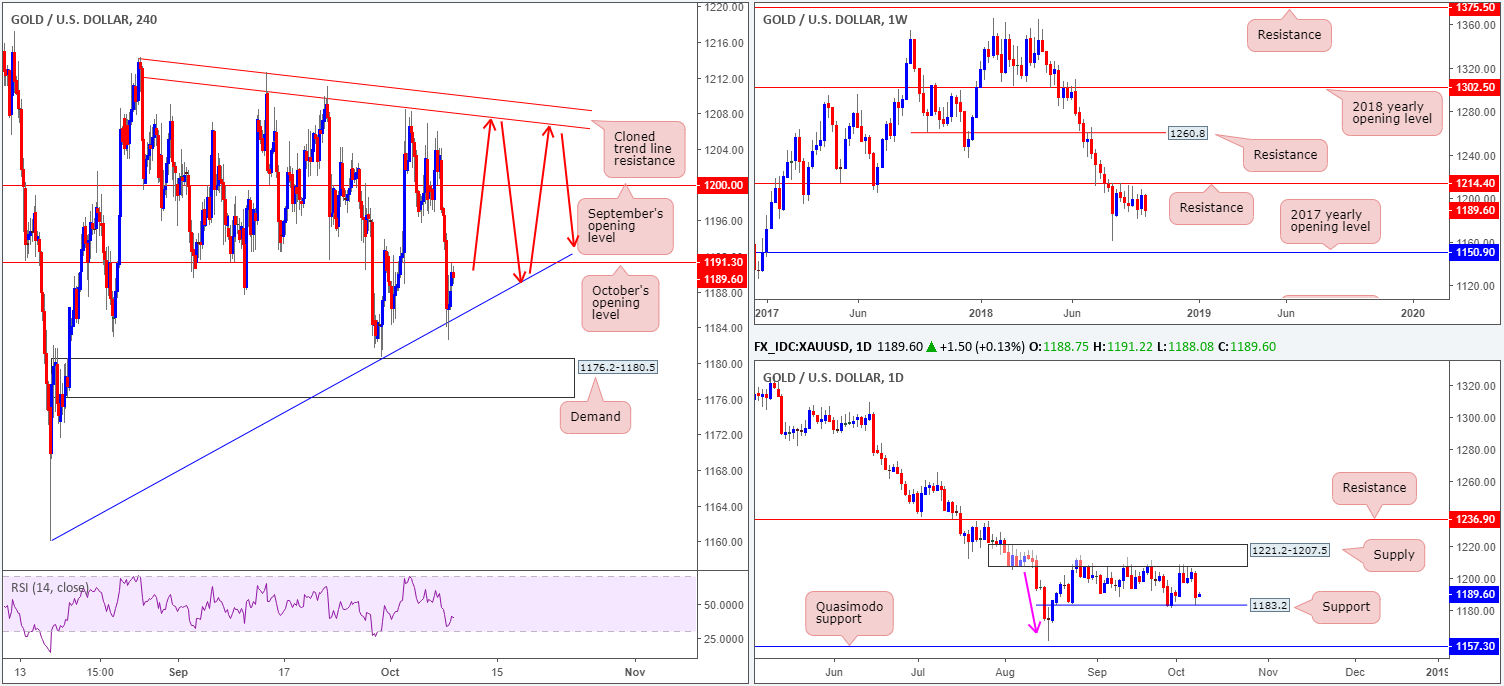
From the top this morning, the price of gold on the weekly timeframe remains languishing beneath key resistance at 1214.4. Further selling on this scale has the 2018 yearly low of 1160.3 to target, followed closely by the 2017 yearly opening level at 1150.9.
In conjunction with weekly flow, daily movement continues to respect a nice-looking supply zone at 1221.2-1207.5. Aside from the base displaying attractive downside momentum (pink arrow), this area could also be considered the ‘decision point’ to print 2018 yearly lows of 1160.3. Traders, however, are also urged to consider support on this scale: 1183.2 (which held price almost to the pip on Monday), followed by a Quasimodo support at 1157.3.
Against the backdrop of higher-timeframe flows, intraday action on the H4 scale remains compressing between two converging trend lines (meeting the characteristics of a bearish pennant formation – 1214.3/1160.0). Of late, the yellow metal responded to its trend line support, lifting the candles towards nearby resistance formed from October’s opening level at 1191.3.
Areas of consideration:
In light of where price is trading from on the higher timeframes, a long in this market will unlikely produce much to get excited about. You’re simply buying against higher-timeframe flow here.
Ultimately, traders should be looking for the H4 bearish pennant to complete and breakout south. Should this come to fruition and price engulfs H4 demand at 1176.2-1180.5, shorts are high probability at this point, targeting the 2018 yearly low of 1160.3.
Until this happens, however, the H4 bearish pennant could continue to compress (as per the red arrows), by which traders could attempt to fade till broken. However, given the likelihood of fakeout occurring around these extremes, waiting for H4 candlestick confirmation to emerge before pulling the trigger is likely the better (safer) path to take right now.
The use of the site is agreement that the site is for informational and educational purposes only and does not constitute advice in any form in the furtherance of any trade or trading decisions.
The accuracy, completeness and timeliness of the information contained on this site cannot be guaranteed. IC Markets does not warranty, guarantee or make any representations, or assume any liability with regard to financial results based on the use of the information in the site.
News, views, opinions, recommendations and other information obtained from sources outside of www.icmarkets.com.au, used in this site are believed to be reliable, but we cannot guarantee their accuracy or completeness. All such information is subject to change at any time without notice. IC Markets assumes no responsibility for the content of any linked site. The fact that such links may exist does not indicate approval or endorsement of any material contained on any linked site.
IC Markets is not liable for any harm caused by the transmission, through accessing the services or information on this site, of a computer virus, or other computer code or programming device that might be used to access, delete, damage, disable, disrupt or otherwise impede in any manner, the operation of the site or of any user’s software, hardware, data or property.


