
EUR/USD:
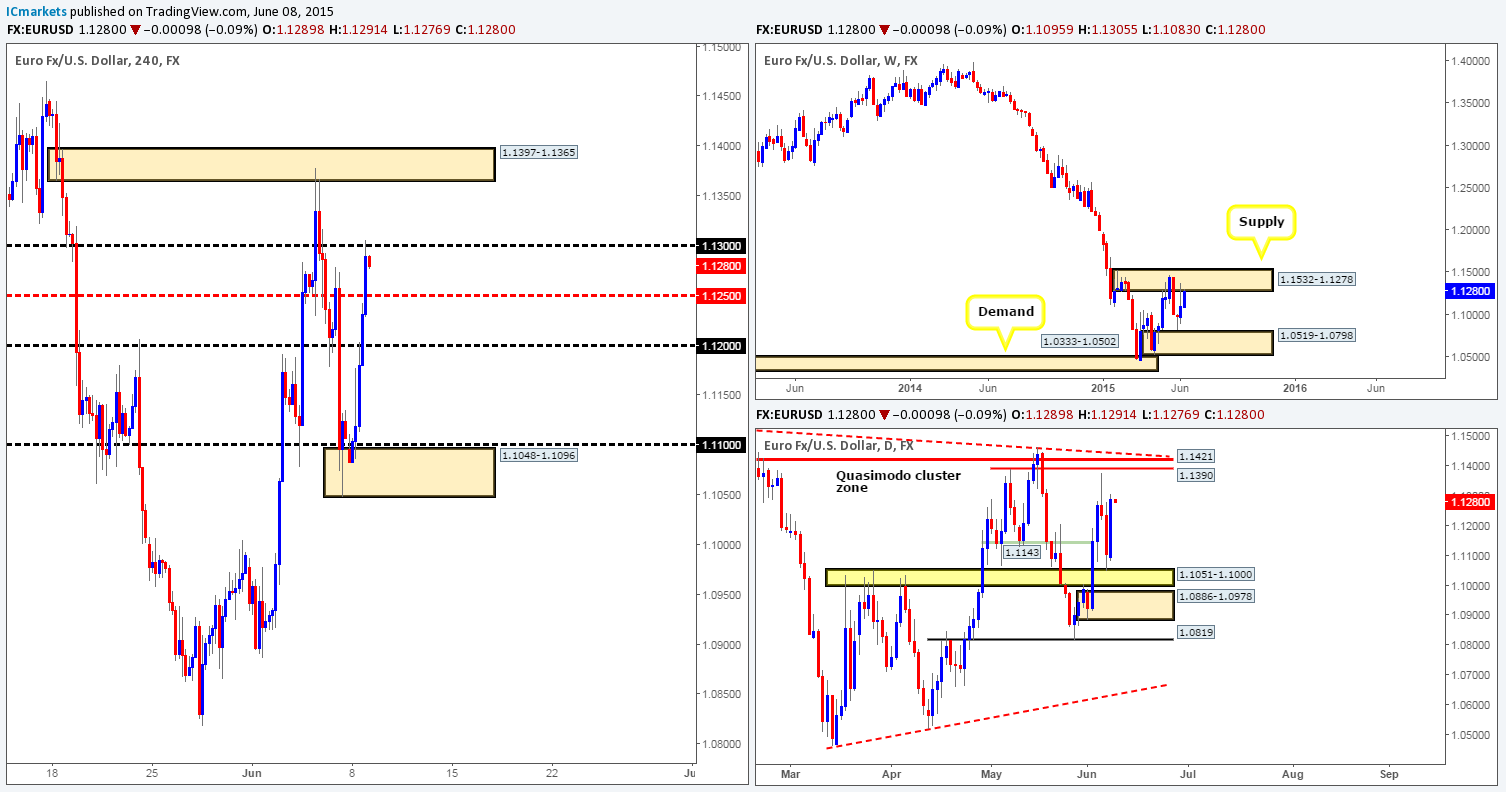
Weekly view – From the weekly timeframe, we can see that price is now crossing swords with the weekly supply area coming in at 1.1532-1.1278 again. This supply zone is very significant in our opinion since if there is a sustained break above this area, our long-term bias on this pair will very likely shift north.
Daily view: This timeframe shows that price rebounded fantastically off of a daily swap area marked in yellow at 1.1051-1.1000 (we completely missed this zone in the previous report!). Should this buying continue going into today’s session, it is possible the Euro may connect with a daily Quasimodo cluster zone coming in at 1.1390/1.1421 (located relatively deep within the aforementioned weekly supply area).
4hr view: Price action on this timeframe shows us that yesterday’s advance begun mid-way through the London session. 1.1200 and 1.1250 were taken out during the onslaught and 1.1300 is, at the time of writing being tested.
With the weekly timeframe showing price trading at supply, and the daily timeframe suggesting we may see more of an advance into this weekly supply (see above), 1.1300 will likely play a key role going into today’s sessions. If this number is taken out and respected as support, there may be (with lower timeframe confirmation) an opportunity to buy up to at least the 4hr supply area seen at 1.1390/1.1421 (positioned around the aforementioned daily Quasimodo cluster zone). In the event that 1.1300 provides resistance in the market today, nonetheless, price may continue to decline down towards at least the mid-level number 1.1250 and potentially 1.1200 given enough time. With that being said, before we consider an entry short here, lower timeframe confirmation is required.
Levels to watch/live orders:
- Buys: Flat (Predicative stop-loss orders seen at: N/A).
- Sells: 1.1300 [Tentative – confirmation required] (Predicative stop-loss orders seen at: dependent on where one confirms this level).
GBP/USD:
Weekly view – At the time of writing, the small weekly demand area at 1.5088-1.5184 is currently holding the GBP nicely. Should this attract further buying into the market, the weekly swap level at 1.5451 will likely be the next objective to reach.
Daily view: Similar to the weekly timeframe, the daily timeframe shows buying pressure coming in from the base of the aforementioned weekly demand area. However, the next objective to reach on this timeframe falls in at a daily swap zone coming in at 1.5478-1.5435.
4hr view: Sterling’s recent advance eventually saw price take out 1.5300 and continue on up towards a small 4hr supply area seen at 1.5368-1.5349. Unfortunately for us, there was no opportunity to enter on the break of 1.5300 without buying the breakout itself – breakout trading agrees with a lot of people but not with us!
We mentioned in our previous report that we believed the current 4hr supply area may be weak from Friday’s NFP spike seen marked with a black arrow at 1.5357. As such, we’re not going to be looking to short this zone today. For anyone that believes a bounce will take place from here, we would advise waiting for lower timeframe confirming price action just to be on the safe side.
In the event that we are correct with our analysis, price will likely continue to rally and connect with the 1.5400 barrier later on, which is somewhere we expect a reaction to be seen. Check out the two red arrows on this chart. The way 1.5400 held the market lower here was very impressive! With that being said, take a look across to the daily chart; see how the wicks that projected above 1.5400 collided beautifully with the daily swap zone at 1.5478-1.5435. This is something we all need to be prepared for again here guys if we look to short 1.5400. It’s a perfect fakeout scenario!
With all the above in mind, we personally would want to see a bearish pin-bar candle form around 1.5400 today (essentially another fakeout), as this would essentially be our trigger to enter short.

Levels to watch/ live orders:
- Buys: Flat (Predicative stop-loss orders seen at: N/A).
- Sells: 1.5400 [Fakeout will need to be seen first] (Predicative stop-loss orders seen at: depends on how deep the fakeout is).
AUD/USD:
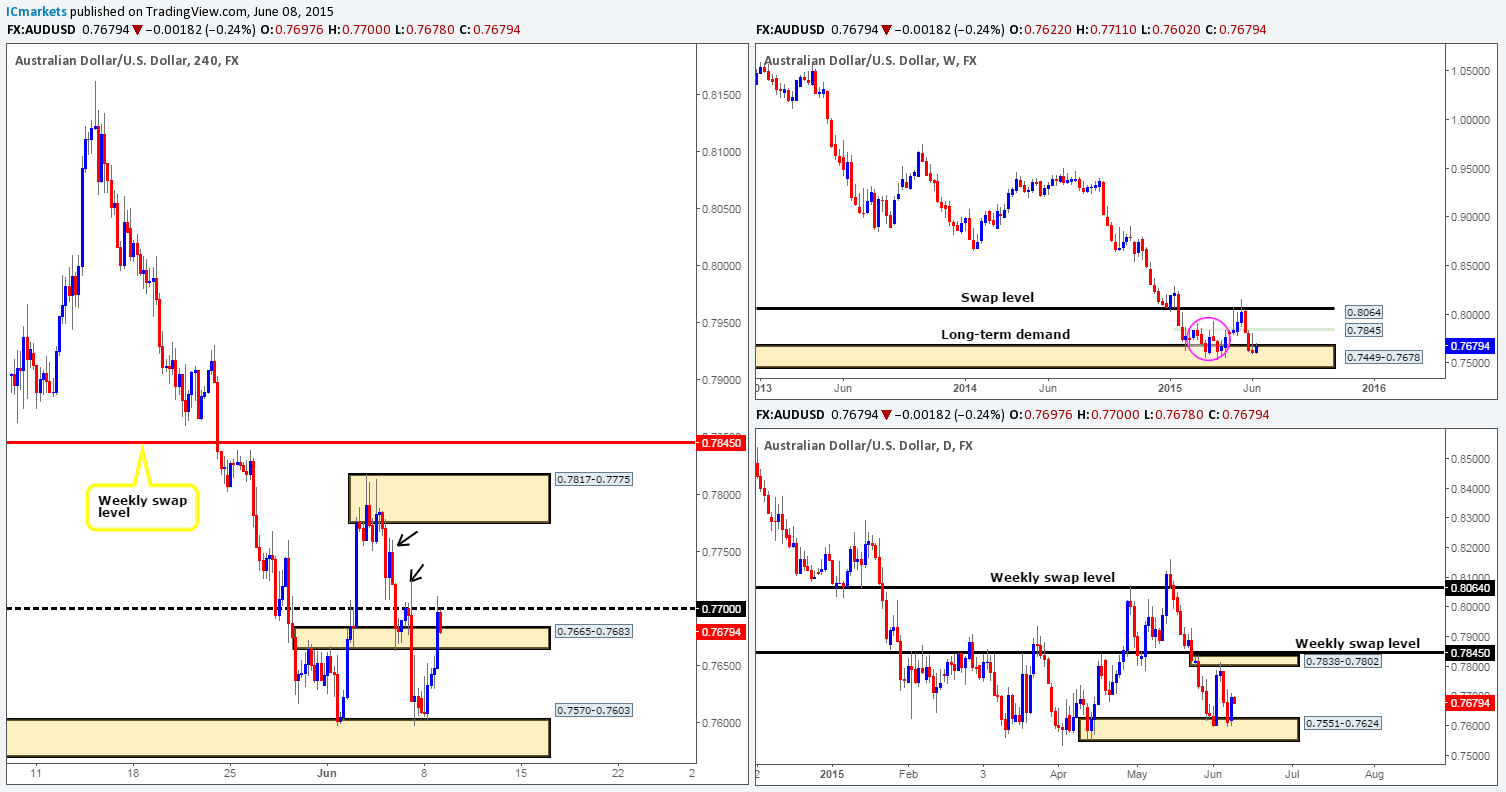
Weekly view – Following the push seen into the weekly demand area at 0.7449-0.7678, last week’s trading action shows that price printed an inverted weekly pin-bar candle. To some traders this may be a sign that the market wants higher prices – a reversal signal, and they could very well be right considering where the candle pattern formed. Nevertheless, Judging by the sloppy reaction seen (pink circle – 02/02/15-06/04/15) at this zone a few months earlier, things could potentially get messy here before we see any decisive move take place. From a long-term perspective, the trend direction on this pair is still very much south in our opinion, and will remain this way until we see a convincing break above 0.8064.
Daily view: Supportive pressure came into the market during yesterday’s session around the upper limit of a daily demand area seen at 0.7551-0.7624 (located within the aforementioned weekly demand area). On the condition that this buying continues, we might, just might see prices challenge the small daily supply area at 0.7838-0.7802 (positioned just below a minor weekly swap level at 0.7845).
4hr view: For those who read our last report on this pair, you may recall that we were interested in entering into a buy position from the 4hr demand area at 0.7570-0.7603 (located within the aforementioned daily demand area) if lower timeframe confirmation was seen.
Our team found a beautiful entry on the 30 minute timeframe and was filled at 0.76230 around 8:10am GMT. Our first take-profit target (the 4hr swap area at 0.7665-0.7683) was hit with little trouble, with price continuing on north to marry up with 0.7700 which is currently repelling the market as we write. Ultimately, we would like to see the 4hr swap area at 0.7665-0.7683 hold as support now, and force price above 0.7700. Should this occur, we’d then believe our second and final take-profit target – the 4hr supply area at 0.7817-0.7775 (located within the aforementioned daily supply area) would likely be hit. Equally important, however, is that a break above 0.7700 potentially opens up the door to a second buying opportunity. If 0.7700 is retested as support and shows some form of lower timeframe confirming price action at this number, we’d happily take another long entry here and use the same take-profit target as what we have on our current long. Why we believe the path north is clear above 0.7700 up to the 4hr supply area at 0.7817-0.7775 simply comes from the two supply consumption wicks seen marked with black arrows at 0.7725 and 0.7760.
Levels to watch/ live orders:
- Buys: 0.76230 [Live] (Predicative stop-loss orders seen at: Breakeven).
- Sells: Flat (Predicative stop-loss orders seen at: N/A).
USD/JPY:
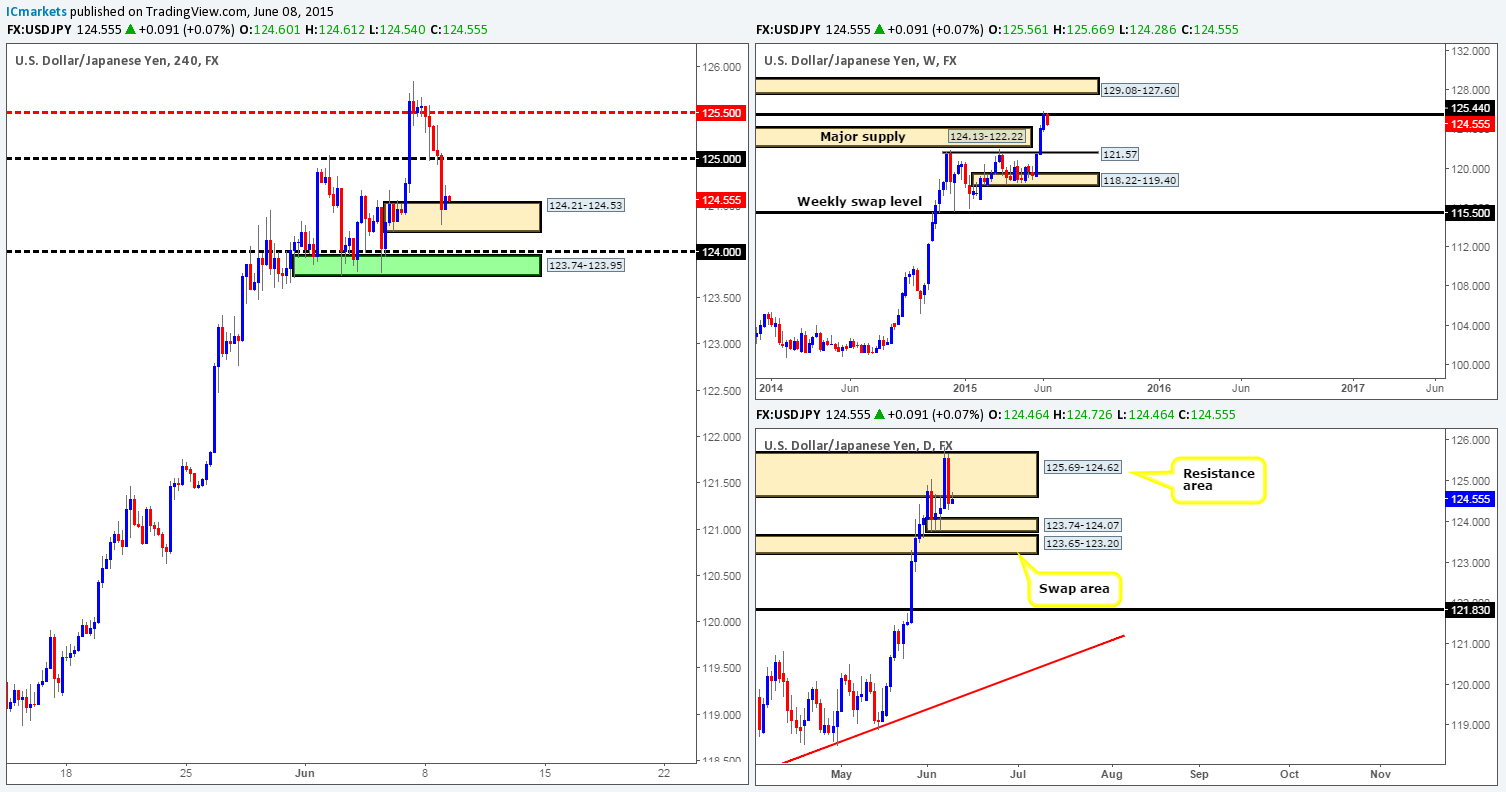
Weekly view – The weekly timeframe shows that price rallied for three consecutive weeks, consequently taking out a weekly supply area at 124.13-122.22, and marrying up with a weekly swap level seen at 125.44.
Daily view: The small break above the daily resistance area at 125.69-124.62 on Friday clearly triggered selling in the market during yesterday’s session. In the event that further selling is seen from here today, price will likely tackle the top side of daily demand seen at 123.74-124.07.
4hr view: The recent descent on this pair, as you can see, took out both the 125.50 level and the round number 125.00, then went on to test a 4hr demand area seen at 124.21-124.53.
Given where price is located on the higher timeframes (see above) at the moment, we would not really be comfortable trading long from the aforementioned 4hr area of demand. An area we do have our eye on for buys, however, is seen a little below it marked in green at 123.74-123.95, which lines up beautifully with the aforementioned daily demand area.
Let’s think about this for a moment. Traders looking to trade long from either the current 4hr demand area or the round number 124.00 will have their stops set just below. These stops provide liquidity for buying (sell stops). Would it not make logical sense for pro money to sell into this market today and take these stops out? We believe so. And the logical place for price to reverse in our opinion is the 4hr buy area we just mentioned above. As such, we’re going to place a pending buy order at 123.94, with a stop set at 123.44.
You may be thinking at this point, why are they attempting to buy against potential weekly sellers from the weekly swap level 125.44??!! Look at the weekly chart again; can you see the recently broken supply area at 124.13-122.22? This will likely provide structural support to the market at least that is what we’re hoping for.
Levels to watch/ live orders:
- Buys: 123.94 (Predicative stop-loss orders seen at: 123.44).
- Sells: Flat (Predicative stop-loss orders seen at: N/A).
USD/CAD:
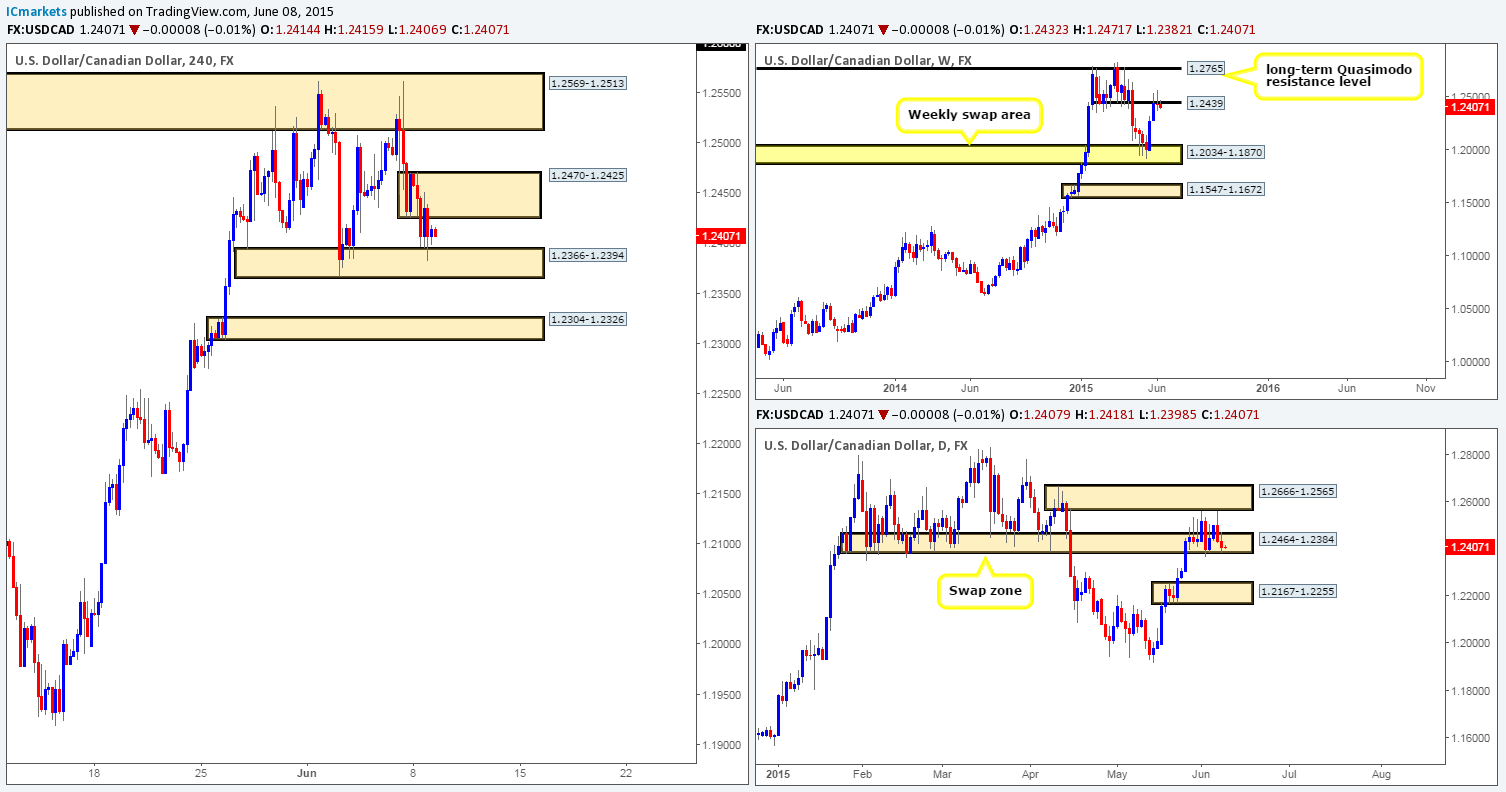
Weekly view – The weekly timeframe shows that the buyers and sellers continue to pull for position around a weekly swap level coming in at 1.2439. A sustained move above this number this week would likely force the market north to test a weekly Quasimodo resistance level at 1.2765. Conversely, should the sellers be victorious here, its likely price will slip down towards the weekly swap area at 1.2034-1.1870.
Overall, our long-term bias on this pair is long. It will only be once we see a break below the aforementioned weekly swap area would our present bias likely shift.
Daily view: For the past week and a half, price has been trading within the confines of a small range formed by a daily supply area at 1.2666-1.2565 and a daily swap zone seen at 1.2464-1.2384. With that being said, one can see that price is trading awfully near the lower limits of this consolidation at the moment, so for anyone looking to enter short on this pair today may want to take a note of this.
4hr view: From this angle, we see that price is pretty much trapped at the moment between a 4hr buy zone located deep within the aforementioned daily swap area seen at 1.2366-1.2394 and a 4hr supply barrier at 1.2470-1.2425. Our team has no intention in trying to attempt to trade in between these two zones.
In the event that the 4hr supply barrier is taken out, the pathway should be resistance free up to 1.2569-1.2513, but, as we’re sure you can see, a long position taken on the break of this 4hr zone would not exactly give one favorable risk/reward.
A break below the 4hr buy zone on the other hand, likely opens the gates for further downside to at least the 4hr demand area at 1.2304-1.2326. The reason we say ‘at least’ is simply because the higher timeframes suggest there is room for price to move much further than this target (see chart). Therefore, with all of the above in mind, we’re going to patiently watch price action on this pair today. Should a break lower be seen as we just discussed, we’ll then look for price to retest the 4hr buy zone as supply, and enter short (with lower timeframe confirmation), targeting 1.2330 as our first take-profit target.
Levels to watch/ live orders:
- Buys: Flat (Predicative stop-loss orders seen at: N/A).
- Sells: Flat (Predicative stop-loss orders seen at: N/A).
USD/CHF:
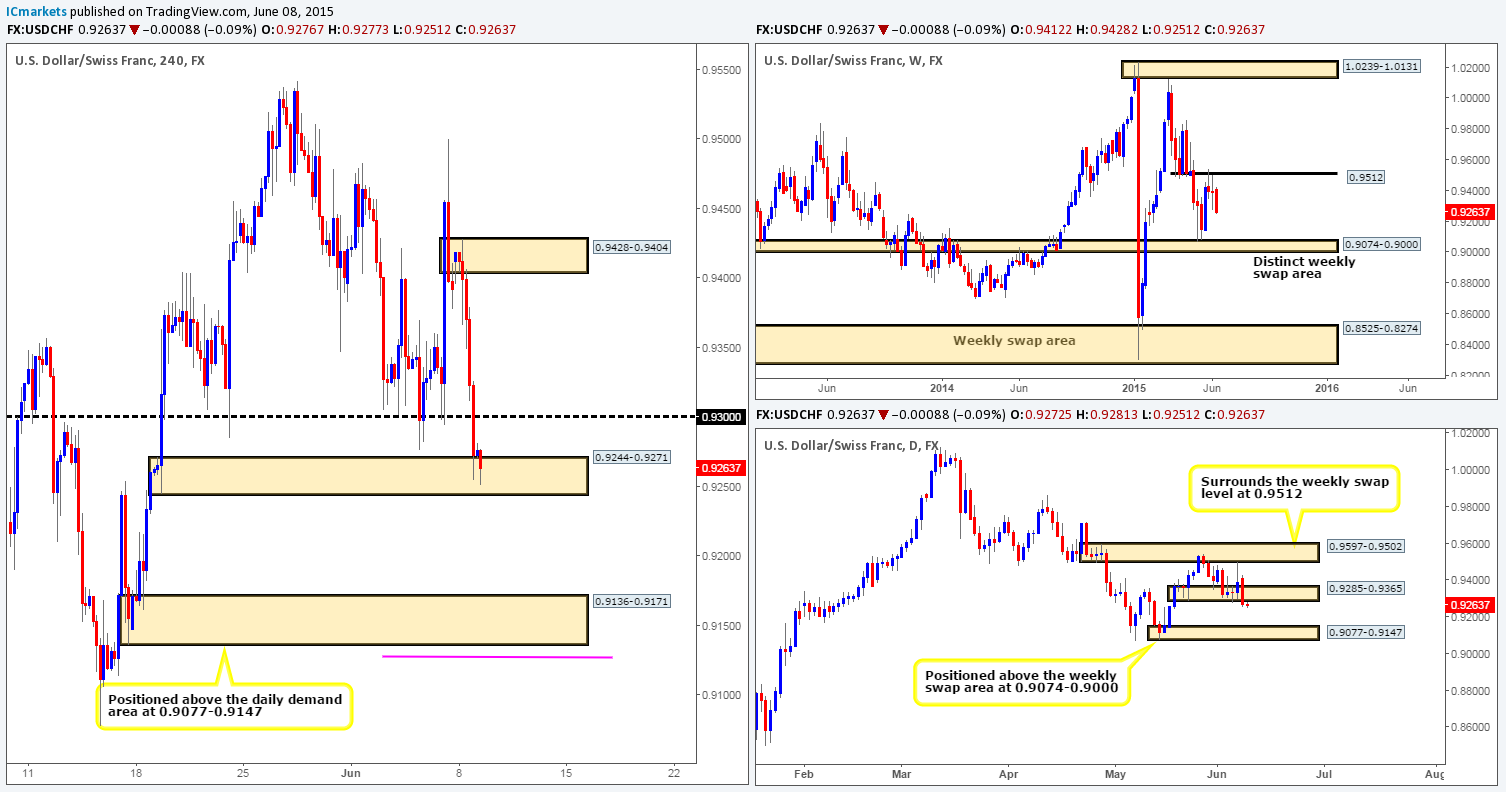
Weekly view – Last week’s trading shows that the USD/CHF pair managed to hold out below the weekly swap level at 0.9512, which as you can probably see, formed a weekly indecision candle in the process. So far this week, the sellers appear to have taken control of this market. If this continues, its likely price will connect with the weekly swap area seen at 0.9074-0.9000.
Daily view: Yesterday’s session reveals that the daily demand area at 0.9285-0.9365 was taken out. This move, as you may be able to see, has likely set the stage for a continuation move south down towards a small daily demand area at 0.9077-0.9147 (located just above the aforementioned weekly swap area). It will be interesting to see what the 4hr timeframe has to say…
4hr view: The recent fall on this pair cleanly took out several 4hr technical barriers. It is only since price collided with a 4hr demand area at 0.9244-0.9271 have we seen any noteworthy buying interest enter the market. Taking into consideration that both the weekly and daily timeframes are indicating further downside may be in store (see above), our team has no interest whatsoever in attempting to enter long from the current 4hr demand area. A break below this 4hr zone, nonetheless, will, in effect, be our cue to begin watching for price to retest this barrier as supply. If we see this happen, we would then consider a short trade (with lower timeframe confirmation) from here. In the event all the above goes to plan, full profits would likely be taken at the 4hr demand area at 0.9136-0.9171, as this zone is positioned directly above the daily demand area mentioned above at 0.9077-0.9147.
Levels to watch/ live orders:
- Buys: Flat (Predicative stop-loss orders seen at: N/A).
- Sells: Flat (Predicative stop-loss orders seen at: N/A).
US 30:
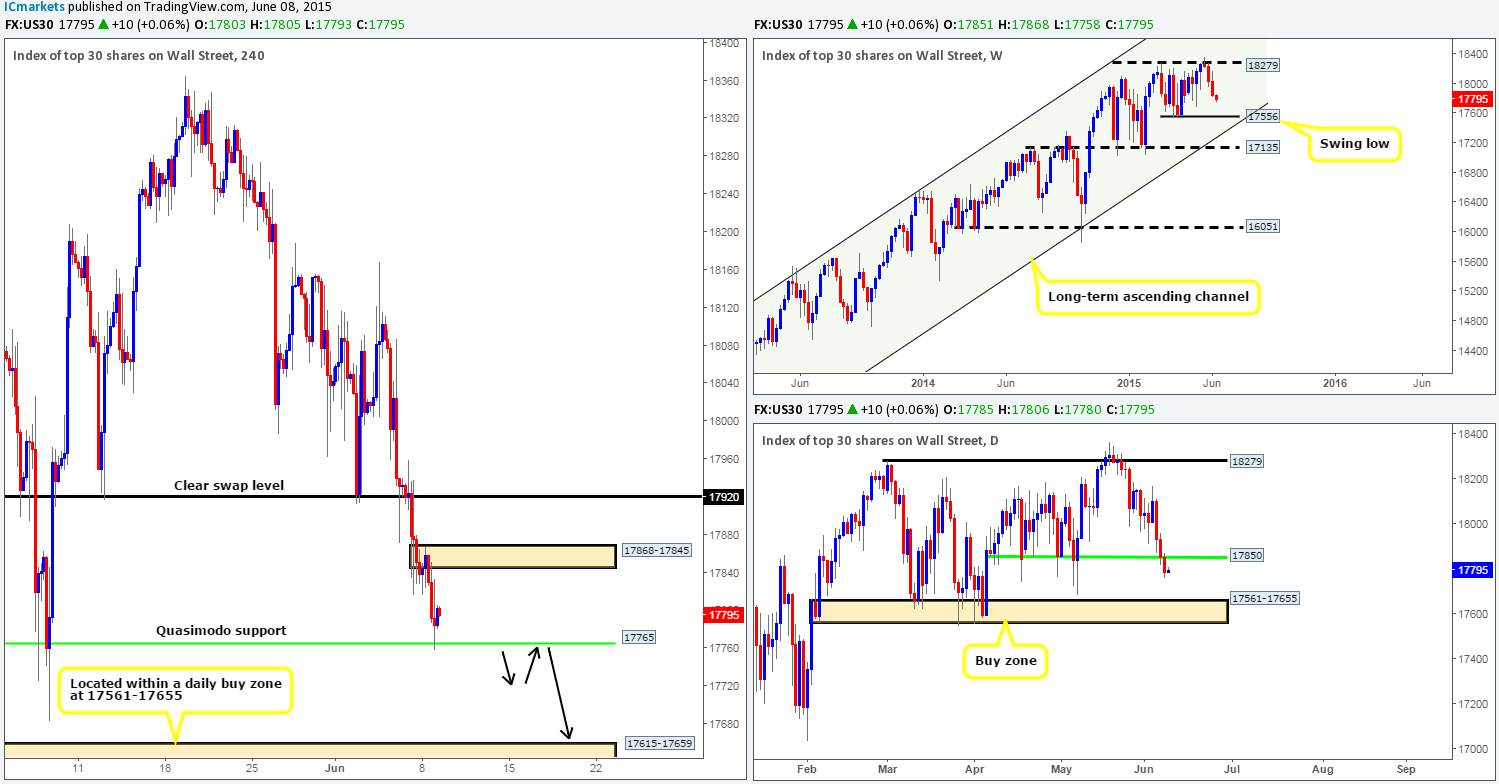
Weekly view – The weekly timeframe shows little sign of buying interest at the moment, as the sellers continue pounding this index south. Should the sellers maintain this position throughout the week, then we believe there is a good chance that price will likely connect with the weekly swing low coming in at 17556. Despite the recent decline in value, however, the uptrend on this index is still very strong, and will remain this way until see a convincing push below 16051.
Daily view: Daily support at 17850 was taken out during yesterday’s session. This has very likely opened up the trapdoor to further downside towards 17561-17655 – a clear daily buy zone.
4hr view: From this angle, price is currently seen rebounding off of a 4hr Quasimodo support level at 17765. Although the rebound from this barrier appears relatively stable at the minute, we would not really be comfortable in trying to enter long from here, even with lower timeframe confirming price action. The reason being is simply because the higher timeframe picture indicates there is room to move further south yet (see above).
For anyone already long from this 4hr Quasimodo support barrier at 17765, we would recommend keeping a close eye on price action today, and maybe even consider reducing your risk if you have not done so already. For us, however, we do not intend to take any further action on this instrument until a close below the aforementioned 4hr Quasimodo base is seen, as the pathway south should then be ‘support free’ so to speak down to a 4hr demand area coming in at 17615-17659 (located relatively deep within the aforementioned daily buy zone). Most of you who follow our analysis on a regular basis will already know that we’re not breakout traders, we prefer to wait for price to retest the broken area before making our decision, and this is exactly what we intend to do should a break below 17765 take place today.
Levels to watch/ live orders:
- Buys: Flat (Predicative stop-loss orders seen at: N/A).
- Sells: Flat (Predicative stop-loss orders seen at: N/A).
XAU/USD (Gold)
Weekly view – For the past three weeks, the gold market sold off and eventually clashed with a weekly demand area at 1142.5-1167.3. From a long-term perspective, however, gold is still trending south in our opinion. For this bias to be invalidated, a push above the weekly trendline extended from the high 1488.0 would need to be seen.
Daily view: The daily timeframe on the other hand, shows price spiked below a proven buy zone at 1170.3-1184.0 on Friday, which has so far held firm. On the condition that the buyers continue to show strength here, it is likely a rally will ensue up to test the small daily supply area at 1196.2-1188.9.
4hr view: From this angle, we can see that the (possible) fakeout below the aforementioned daily buy zone was actually supported by a fresh 4hr demand area positioned at 1159.6-1165.6. What we’re also seeing here is the buyers will need to conquer a small, yet clearly resilient 4hr supply area at 1178.4-1177.5 before further upside can take place from both the weekly and daily demand barriers (see above). As such, we intend to hold fire on any longs at least until a sustained move above this 4hr obstacle is seen.
With regards to selling this market, our team has absolutely no interest in selling at the current 4hr supply area for reasons (higher timeframe position) stated above, and also the fact that price has already visited this zone once already, thus potentially weakening any sell-side liquidity.
So, to sum up, our team is going to remain flat for the time being. An alert has been set just above the current 4hr supply area at 1179.0 to inform us a long trade may be setting up, but other than this, we’re quite happy to take a back seat for the time being and let price do its thing.

Levels to watch/ live orders:
- Buys: Flat (Predicative stop-loss orders seen at: N/A).
- Sells: Flat (Predicative stop-loss orders seen at: N/A).