
A note on lower timeframe confirming price action…
Waiting for lower timeframe confirmation is our main tool to confirm strength within higher timeframe zones, and has really been the key to our trading success. It takes a little time to understand the subtle nuances, however, as each trade is never the same, but once you master the rhythm so to speak, you will be saved from countless unnecessary losing trades. The following is a list of what we look for:
- A break/retest of supply or demand dependent on which way you’re trading.
- A trendline break/retest.
- Buying/selling tails/wicks – essentially we look for a cluster of very obvious spikes off of lower timeframe support and resistance levels within the higher timeframe zone.
- Candlestick patterns. We tend to only stick with pin bars and engulfing bars as these have proven to be the most effective.
We search for lower timeframe confirmation between the M15 and H1 timeframes, since most of our higher-timeframe areas begin with the H4. Stops are usually placed 5-10 pips beyond confirming structures.
EUR/USD:
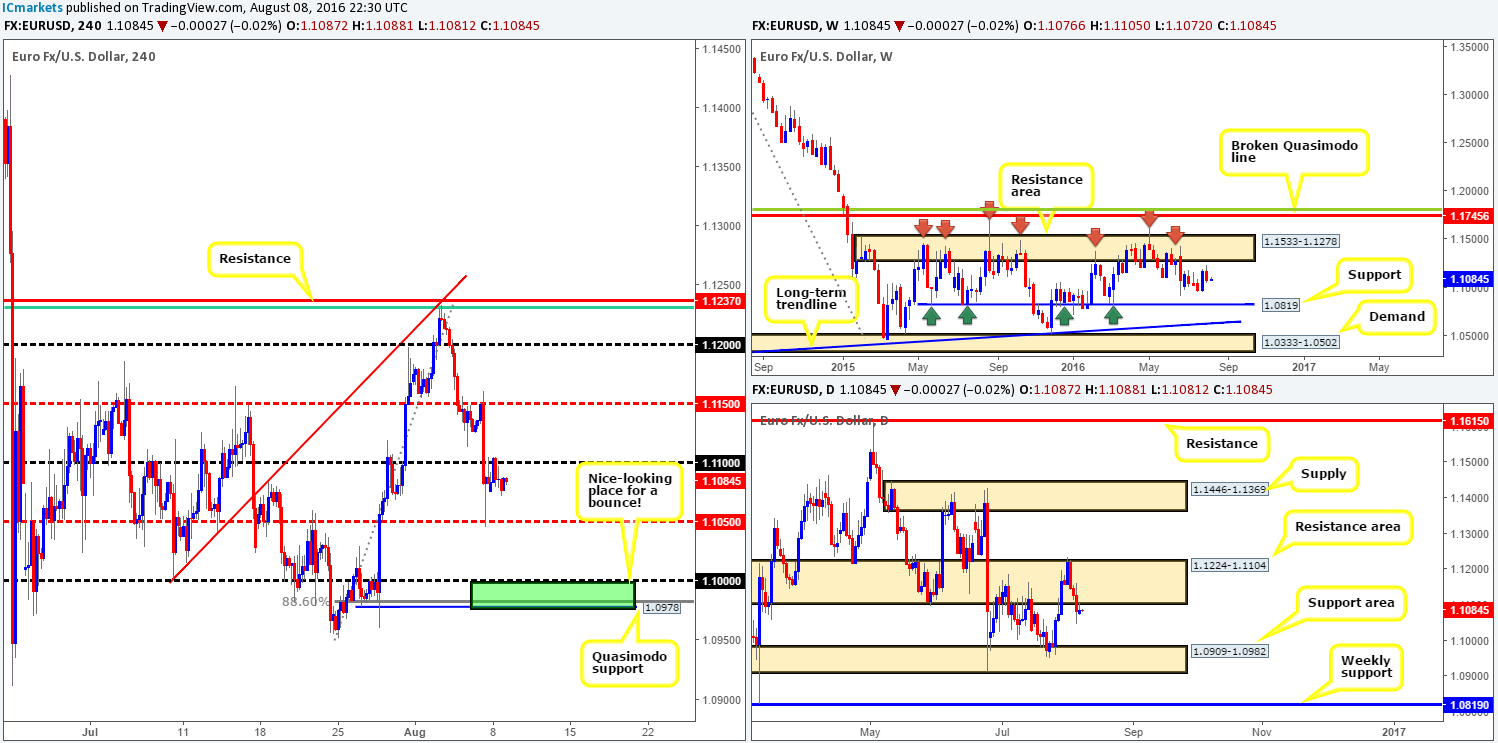
Capped by the psychological number 1.11 and the weekly open 1.1088, the single currency entered into a phase of consolidation during the course of yesterday’s sessions. Consequent to this rather lackluster performance, much of the following report will echo thoughts put forward in Monday’s report…
From the weekly chart, we can see that the pair rotated to the downside last week just ahead of a major weekly resistance area drawn from 1.1533-1.1278. Providing that sellers remain in the driving seat this week, the next downside target can be seen at 1.0819: a major weekly support level.
Moving down to the daily chart, we can see that price recently spiked the lower edge of a daily resistance area at 1.1224-1.1104. By and of itself, this could potentially trigger further downside this week to the daily support area formed by 1.0909-1.0982, followed closely by the above said weekly support level.
Our suggestions: Assuming offers hold ground today, there’s likely to be a push down to the H4 mid-way support 1.1050. While price could bounce from this line, we feel the pressure from the above noted higher-timeframe structures will force the EUR pair down to the key figure 1.10. A break below 1.1050 followed by a subsequent retest (and a lower timeframe sell signal – see the top of this report), with a target objective seen at 1.10 is an intraday setup we’d be interested in taking advantage of. Granted, there’s a possibility that this may not come into view today given the absence of market-moving data for both the EUR and USD.
1.10 coupled with its nearby H4 Quasimodo support level at 1.0978 and a supporting 88.6% H4 Fib level at 1.0983 is also a nice place (green zone) to look for a bounce north this week. In addition to this, this buy zone sits around the top edge of the aforementioned daily support area (the next downside target on the daily timeframe). Should price reach the 1.10 figure, our team would, dependent on the H4 approach and time of day, look to take a long position from this area with our stops planted below the H4 Quasimodo low (1.0960) at 1.0958.
Levels to watch/live orders:
- Buys: 1.0978/1.10 [Dependent on the time of day and approach to the zone, a market order from here is a possibility] (Stop loss: 1.0958).
- Sells: Watch for price to close below the H4 mid-way support at 1.1050 and look to trade any retest seen thereafter (lower timeframe confirmation preferred).
GBP/USD:
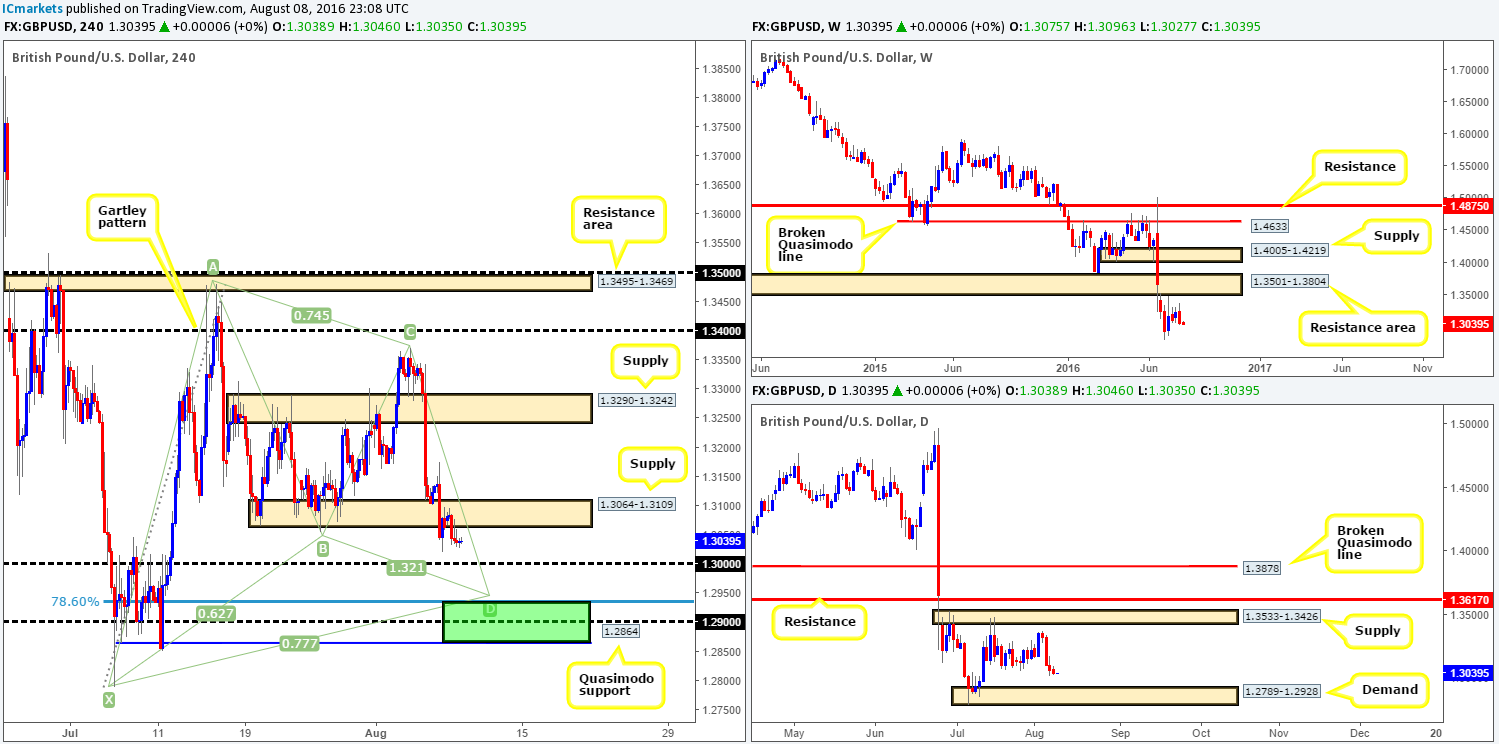
Going into the early hours of yesterday’s European session, a modest sell off was seen from the H4 supply zone drawn from 1.3064-1.3109. As you can see, this was a relatively short-lived move, however, as price fell into a small sideways phase around session lows of 1.3031.
In that the weekly chart shows little (obvious) support in this market until around the 1.20 region, and daily action seems all set to plunge lower towards daily demand at 1.2789-1.2928, its likely traders will be honing in on the key figure 1.30 today. This begs the question, is a buy from this line a viable setup knowing that higher-timeframe flow is trading south? On account of this, although this number will still likely produce a bounce, we’re going to pass on buying from 1.30.
The area we are interested in, nevertheless, is the H4 harmonic Gartley reversal zone fixed between 1.2864 (H4 Quasimodo support)/1.2934 (green zone). This barrier is planted beautifully on top of the daily demand zone mentioned above and is highly likely to produce a bounce to the upside sometime this week. Aggressive traders may look to place stops around the 1.2844 region, while more conservative traders might look to place their stops below the X point of the harmonic formation at 1.2778.
Our suggestions: Since this bullish pattern has formed within a bearish downtrend (easily seen on the higher timeframes), we’d highly recommend waiting for lower timeframe confirmation to form before placing capital on the line. This could be in the form of an engulf of supply followed by a subsequent retest, a trendline/break retest or simply a collection of well-defined buying tails seen around the harmonic reversal zone. This, in our opinion, will likely get you in at a better price and potentially avoid unnecessary drawdown.
Levels to watch/live orders:
- Buys: 1.2864/1.2934 [Tentative – confirmation required] (Stop loss: dependent on where one confirms this area).
- Sells: Flat (Stop loss: N/A).
AUD/USD:
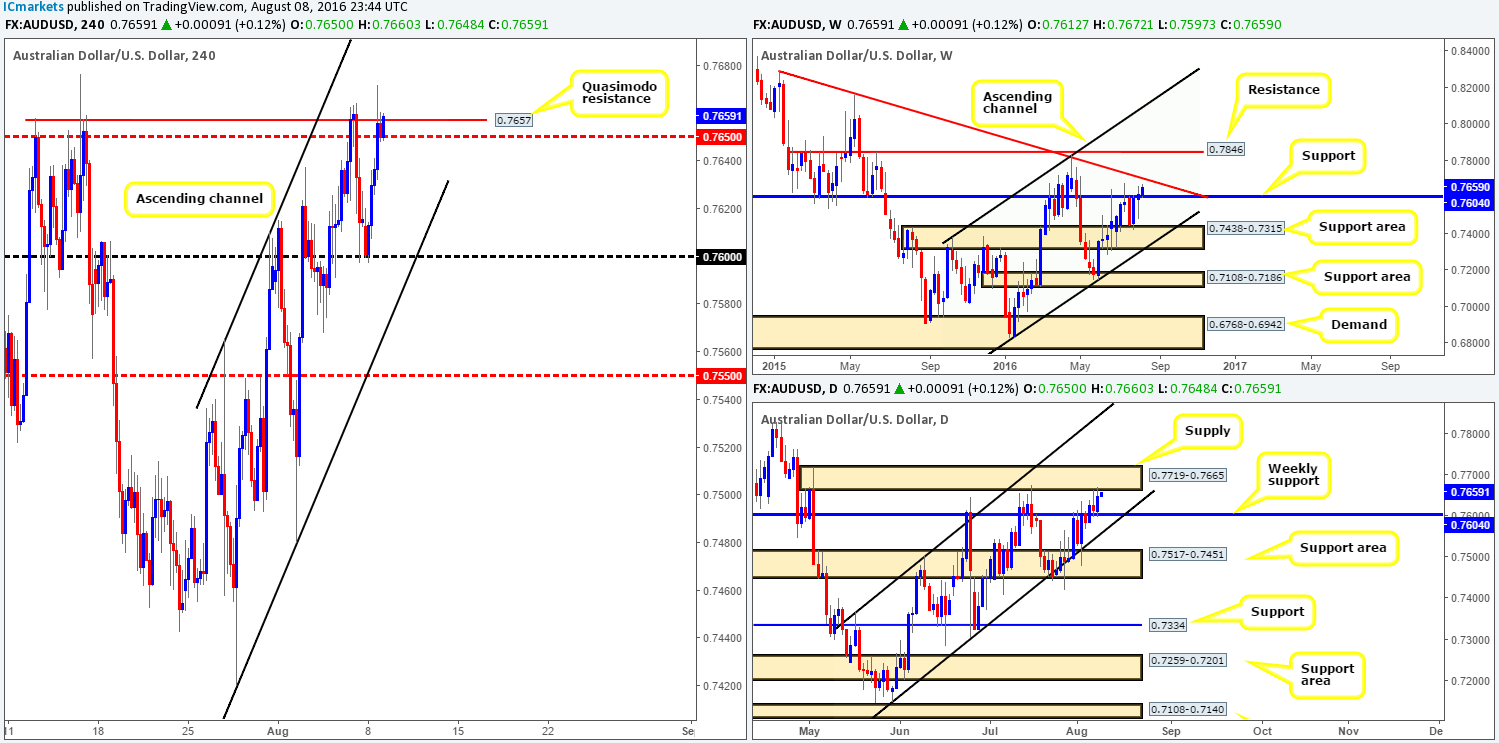
Starting from the top this morning, the weekly chart shows price extending higher following last week’s close above the weekly resistance at 0.7604 (now acting support). Unfortunately, upside from here is rather limited. Just ahead of current price is a weekly trendline resistance extended from the high 0.8895, which has managed to hold the Aussie lower on two previous occasions. This – coupled with the weekly trendline merging with a daily supply area at 0.7719-0.7665, in our opinion, increases the chances of a bearish turnaround being seen from this region.
Stepping across to the H4 chart, we can see that the 0.76 handle held the commodity-linked currency beautifully yesterday, consequently pulling price up to highs of 0.7672. As of now, the pair is capped by a H4 Quasimodo resistance line seen at 0.7657 (positioned just a few pips below the above said daily supply). However, the bears seem to be in a spot of trouble at the moment, as active bulls are currently defending the nearby H4 mid-way support line at 0.7650.
Our suggestions: In that weekly price shows potential for a small advance before connecting with the aforementioned weekly trendline resistance, we’re hesitant to take shorts from the current H4 Quasimodo resistance level. With that being the case, our team’s focus for the time being lies around the 0.77 handle. This number not only sits within upper edge of the daily supply area, but also ties in in nicely with the weekly trendline resistance. Dependent on the time of day and H4 approach, our team would consider taking short positions from this number as we then have the choice of placing our stops above the daily supply zone!
Levels to watch/live orders:
- Buys: Flat (Stop loss: N/A).
- Sells: 0.77 region [Tentative – confirmation required] (Stop loss: dependent on where one confirms this area).
USD/JPY:
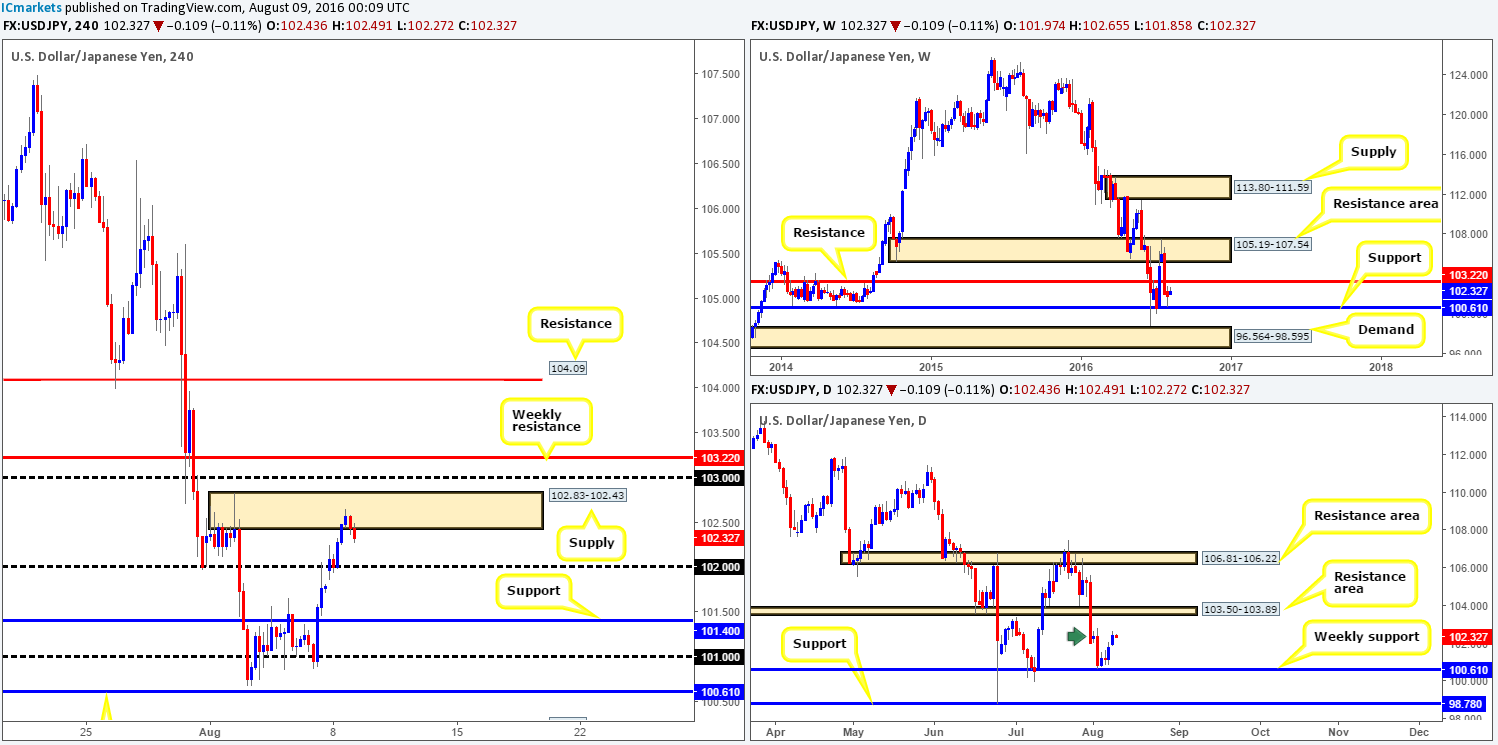
Shortly after the week’s open, the USD/JPY found support around the 102 handle. This, as you can see, allowed price to extend NFP gains up to the H4 supply at 102.83-102.43, which for the time being is showing reasonable resistance. On the whole, we do not expect a large rotation from this H4 area, since there’s a far more attractive line lurking just above at 103.22: a weekly resistance level. However, seeing as how the current H4 supply is lodged within the extremes of a minor daily supply area at 102.83-101.97 (green arrow), this may force price to retest 102.
Our suggestions: Watch for long positions on any retest seen at 102. Be aware though that a whipsaw through this number is likely to be seen in order to fill the weekend gap! Therefore, we’d urge you to consider waiting for lower timeframe confirmation (see the top of this report) before risking capital.
In addition to this level, do keep a close eye on the 103.22/103.00 region for potential shorting opportunities today/this week. A reaction from a weekly barrier can produce a sizable move. With that being said, however, our team would still require a lower timeframe sell signal before trading this area, since there is a strong possibility that price may whipsaw through this level to shake hands with a nearby daily resistance area coming in at 103.50-103.89.
Levels to watch/live orders:
- Buys: 102 region [Tentative – confirmation required] (Stop loss: dependent on where one confirms this area).
- Sells: 103.22/103.22 [Tentative – confirmation required] (Stop loss: dependent on where one confirms this area).
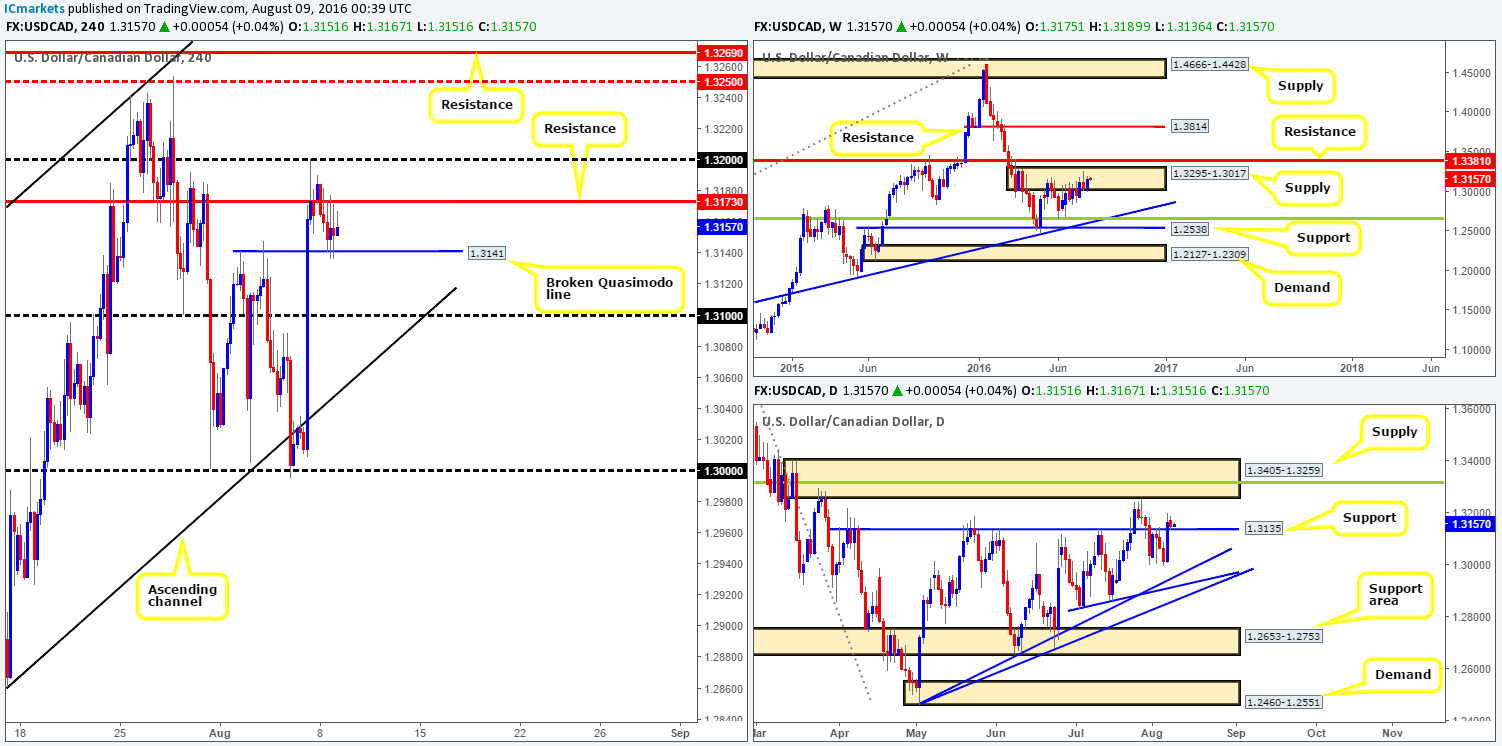
USD/CAD:
Taking into account that weekly action shows that offers appear to be weakening within weekly supply seen at 1.3295-1.3017, and daily price recently seen retesting 1.3135 as support, an advance up to the daily supply area at 1.3405-1.3259 (encapsulates the weekly resistance line at 1.3381 [seen directly above the current weekly supply] and houses a daily 38.2% Fib resistance line at 1.3318) is likely on the cards.
Over on the H4 chart, the H4 broken Quasimodo line at 1.3141 was relatively well-bid during yesterday’s sessions. Be that as it may, buying from this region is challenging. Not only is there a H4 resistance level positioned just above at 1.3173 but there’s also the 1.32 handle just above this to contend with.
Our suggestions: As we highlighted in yesterday’s report, there’s really very little that interests us in this market right now. Here’s why:
A close above the H4 resistance and 1.32 handle would likely open the trapdoor towards the H4 mid-way point 1.3250 – a few pips below the lower edge of the daily supply area mentioned above at 1.3405-1.3259. Despite this move giving up around a fifty-pip profit opening, trading this is still very risky in our opinion since you’d effectively be buying within weekly supply (although it does appear weak) but trading alongside the current daily flow! Therefore, opting to stand on the sidelines here may very well be the best path to take.
Levels to watch/live orders
- Buys: Flat (Stop loss: N/A).
- Sells: Flat (Stop loss: N/A).
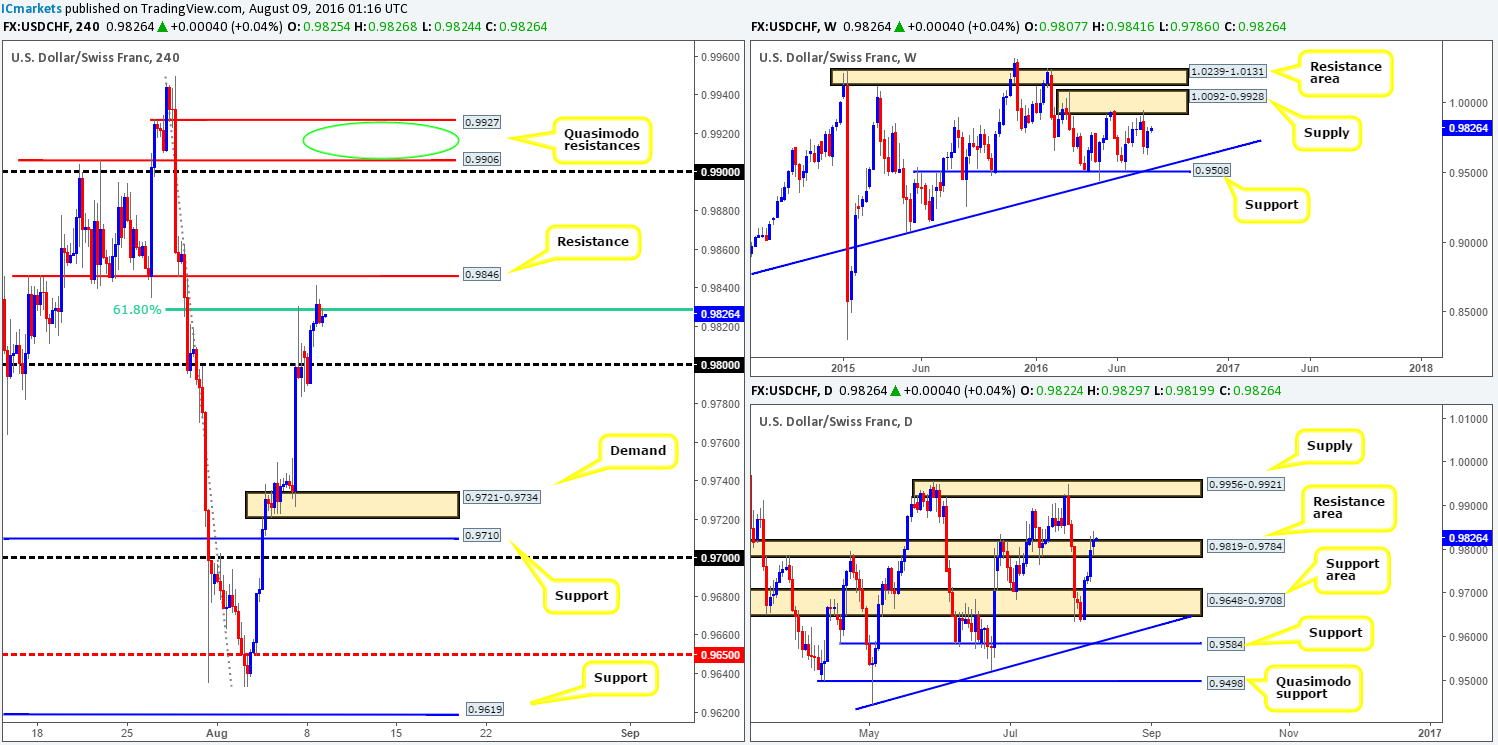
USD/CHF:
The USD/CHF pair, as can be seen from the H4 chart, managed to remain relatively well-bid going into the early hours of yesterday’s European session, piercing through Friday’s high 0.9830. Although the H4 61.8% Fib resistance level at 0.9829 has once again held this unit lower, we feel that offers within this region have severely diminished which could lead to a touch of H4 resistance coming in at 0.9846.
With the above points in mind, how do things stand on the higher-timeframe picture? Up on the weekly chart, price looks set to extend up to weekly supply at 1.0092-0.9928, while yesterday’s daily candle slightly closed above the daily resistance area at 0.9819-0.9784, and potentially cleared the road north up to daily supply seen at 0.9956-0.9921 (glued to the underside of the above said weekly supply zone).
Our suggestions: Given the higher-timeframe direction (see above), we favor further upside in this market. Our team has noted, however, that they will not become buyers until price has cleared the nearby H4 61.8% Fib resistance at 0.9829 as well as the H4 resistance at 0.9846. Beyond these two barriers, price looks clear up to the 0.98 region, followed closely by two nearby H4 Quasimodo resistances at 0.9927/0.9906.
Therefore, we’re watching for price to CLOSE above the 0.9846 region and will look to trade any retest seen to the top-side of this level, targeting 0.98. One could, given the position of the higher-timeframe structure, look to simply enter long from here once price has formed support at this line.
In the event that price does indeed reach 0.98, our team will then be looking to short at market between the aforementioned H4 Quasimodo resistances (green circle) with our stops above the apex high 0.9950. The reason for why comes down to where these H4 Quasimodo lines are located: at the underside of both the above said daily supply area and weekly supply zone.
Levels to watch/live orders:
- Buys: Watch for price to close above the H4 resistance level at 0.9846 and look to trade any retest seen thereafter (lower timeframe confirmation required).
- Sells: 0.9927/0.9906 for shorts at market (Stop loss: 0.9955).
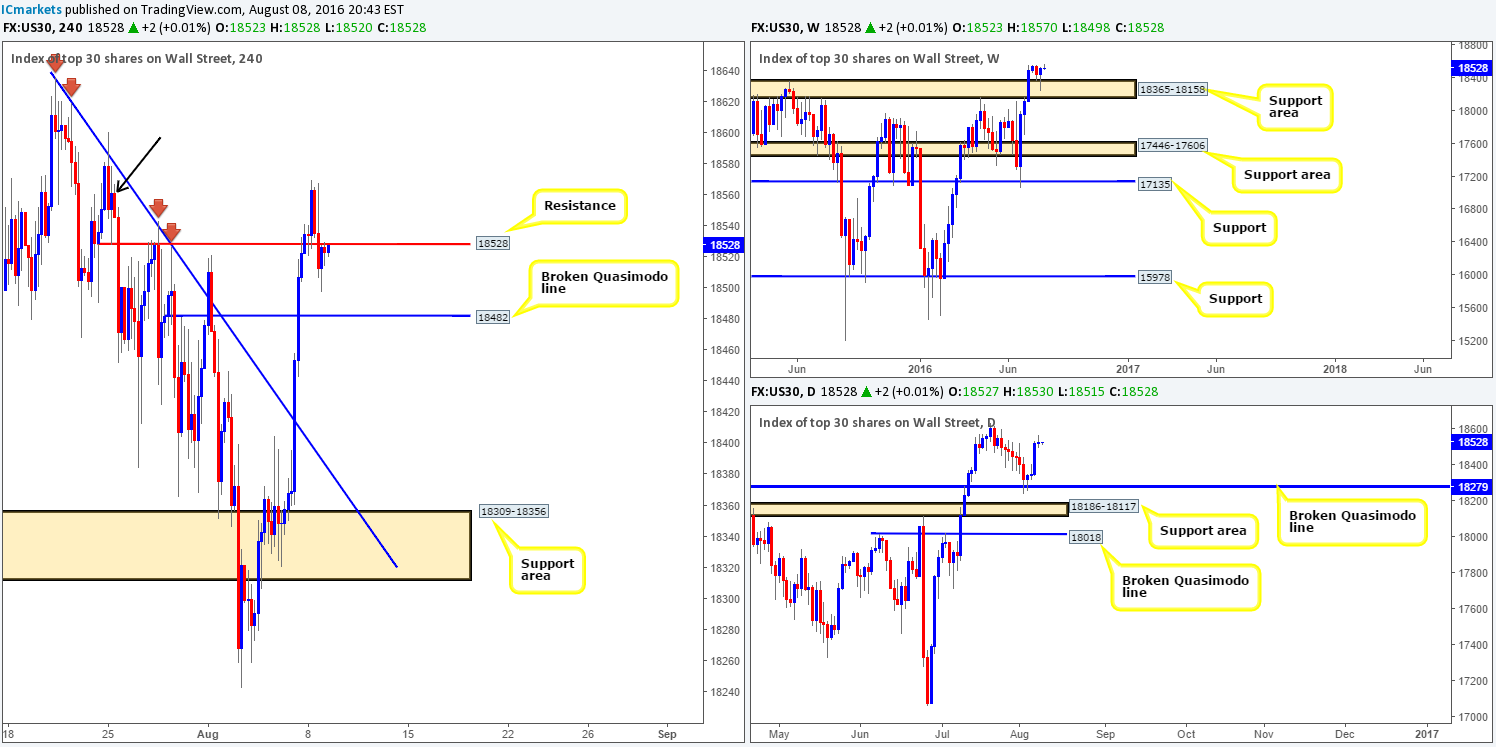
DOW 30:
Going into the early hours of yesterday’s London open, the DOW topped out around 18570 at a H4 supply area marked with a black arrow at 18601-18551, forcing prices to close the day around the weekly open. With price also walloping its way through H4 support at 18528, and later retesting the underside as resistance, where does one go from here?
Of course, from the H4 chart it’s likely that a continuation move down to the H4 broken Quasimodo line at 18482 will be seen. Nevertheless, over on the weekly chart, recent action formed a solid buying tail off a weekly support area chalked up at 18365-18158. Down on the daily chart, we can also see that price recently bounced almost to-the-pip from a daily broken Quasimodo line at 18279. To the left of current price, there’s very little active supply seen. Therefore, a break of the 18636 high could be something to watch for.
Our suggestions: Either watch for a close back above the H4 resistance level at 18528 and look to trade any retest seen at this level, or wait and see if price drives down the aforementioned H4 broken Quasimodo line for buying opportunities. Both levels, in our view, are best traded alongside lower timeframe confirmation (see the top of this report) since fakeouts are likely.
Levels to watch/live orders:
- Buys: Watch for price to close above the H4 resistance level at 18528 and look to trade any retest seen thereafter (lower timeframe confirmation required). 18482 region [Tentative – confirmation required] (Stop loss: dependent on where one confirms this area).
- Sells: Flat (Stop loss: N/A).
GOLD:
Despite the yellow metal finding a pocket of bids around the H4 mid-range Quasimodo line at 1332.3 yesterday, price has so far been unable to register anything noteworthy from here. With the US dollar still sporting a relatively strong bid tone, consequently putting pressure on the commodity, and both the weekly and daily charts showing room to move lower (weekly down to a weekly support area at 1307.4-1280.0 and daily down to a daily demand at 1305.3-1322.8), we feel this level is on the verge of giving way.
Our suggestions: Watch for a decisive close beyond the current H4 mid-range Quasimodo line. Should this come to fruition, this could pave the way south to H4 demand at 1315.6-1319.6 which is located within the above said daily demand area. For our team to be permitted to trade this move, however, a retest to the underside of this level MUST be seen, followed by (an optional) lower timeframe signal (see the top of this report).

Levels to watch/live orders:
- Buys: Flat (Stop loss: N/A).
- Sells: Watch for price to close below the H4 broken Quasimodo line at 1332.3 and look to trade any retest seen thereafter (lower timeframe confirmation preferred).


