
EUR/USD:
A scarce macroeconomic calendar along with UK banks being closed in observance of May Day kept the majority of major currencies within reasonably subdued states on Monday.
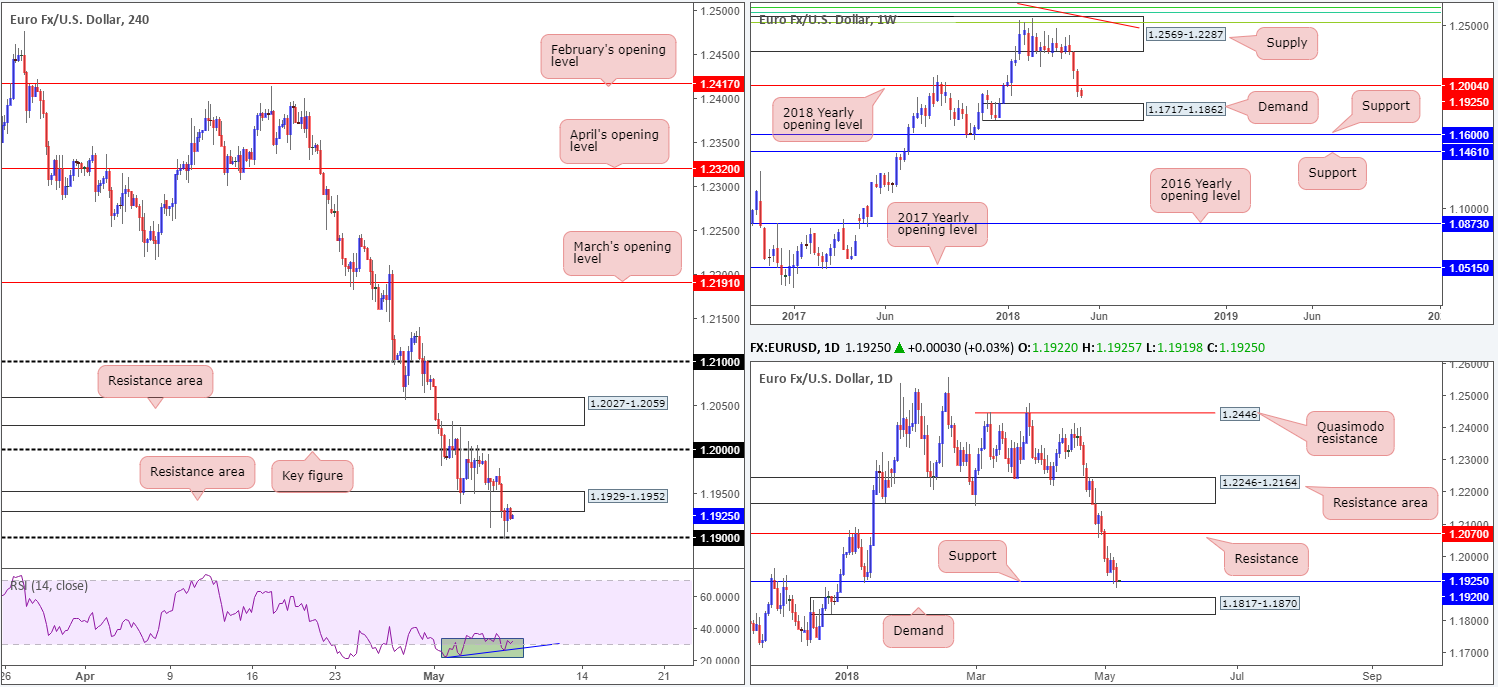
H4 demand at 1.1929-1.1952, as you can see, was consumed amid London trade, leaving H4 price free to challenge the nearby 1.19 handle during the US session. Although a reaction off of 1.19 was seen, it is currently contained by the recently broken H4 demand, now acting resistance area.
Supporting further downside in this market is weekly structure. In the shape of a near-full-bodied weekly bearish candle, price swallowed the 2018 yearly opening level at 1.2004 and positioned weekly demand at 1.1717-1.1862 in the firing range. Because of that, additional selling could be on the horizon. On the other side of the spectrum, though, daily movement recently checked in with support priced in at 1.1920. With that being said, however, this level has yet to advertise any meaningful rotation to the upside. Should we see a violation of this level, daily demand propped up at 1.1817-1.1870 will almost immediately be brought into the fight (notice that this area is glued to the top edge of the aforementioned weekly demand).
Potential trading zones:
A H4 close sub 1.19 will likely open up the possibility for intraday shorts today. As the next downside target falls in at the top edge of daily demand at 1.1870, followed closely by the top edge of weekly demand at 1.1862, one can expect the buyers to make an appearance from this position. For that reason, locking in profits and reducing risk to breakeven around this vicinity is recommended.
Longer term, we can see that the US dollar index is currently toying with the lower edge of a monthly supply at 95.13-92.75, following a sweet bounce off of monthly support at 88.50. This, in our book, adds weight to a potential round of buying being seen from the highlighted weekly demand on the EUR/USD, and therefore could be a location to consider building a case for a medium-term position long.
Data points to consider today: Fed Chair Powell to make an appearance during London trade, and President Trump due to speak later amid US trading.
GBP/USD:
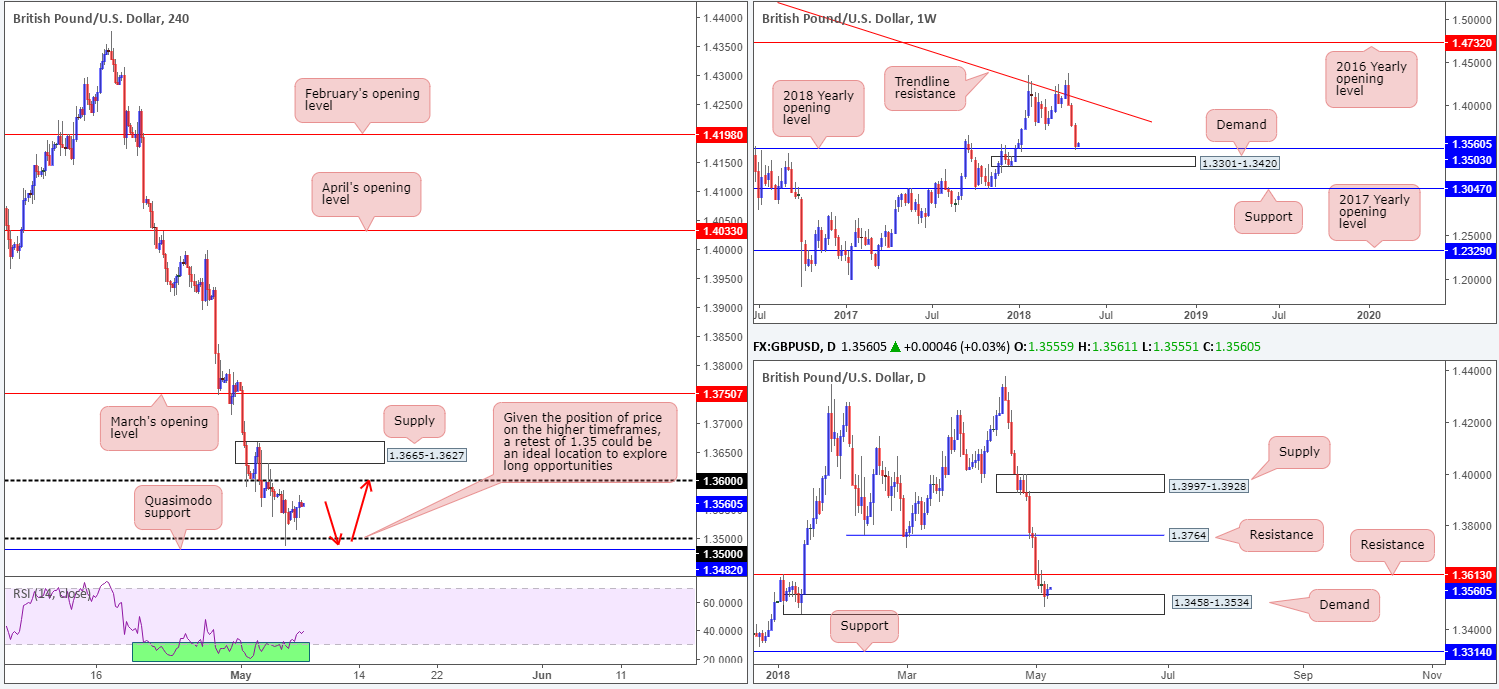
As noted in Monday’s weekly outlook, the GBP/USD is currently emphasizing a market with strong supportive structure seen across the board.
Weekly flow, although recorded reasonably steep losses last week, shook hands with a 2018 yearly opening level at 1.3503, which happens to be placed just ahead of a weekly demand base drawn from 1.3301-1.3420. This is further supported by daily demand that surrounds the weekly level at 1.3458-1.3534, and a nearby H4 Quasimodo support at 1.3482/round number 1.35. Also, let’s not forget that the US dollar index is currently testing the lower edge of a monthly supply at 95.13-92.75, potentially adding weight to a move higher on the GBP/USD.
Potential trading zones:
In light of the above structures, selling is complicated right now. Buying, on the other hand, could be an option. This would, however, involve going against current sentiment (the trend).
A pullback to 1.35ish (see red arrows) and a retest molded in the shape of a H4 full or near-full-bodied bull candle would, as far as we can see, be a reasonable signal to consider longs. In regard to stop-loss placement, traders could utilize the lower edge of the current daily demand at 1.3458.
Nearby resistance targets from 1.35 fall in at 1.36, shadowed closely by H4 supply at 1.3665-1.3627.
Data points to consider today: UK Halifax HPI m/m; Fed Chair Powell to make an appearance during London trade, and President Trump due to speak later amid US trading.
AUD/USD:
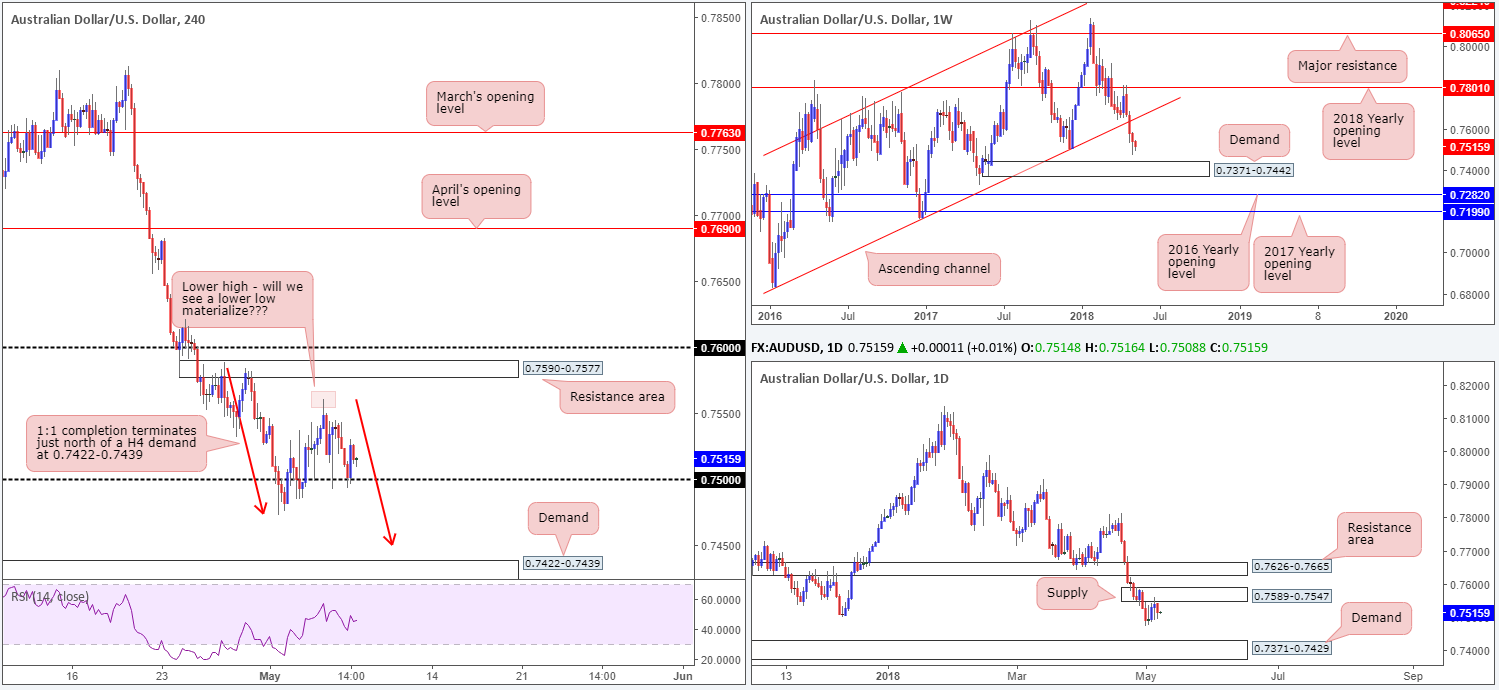
The commodity currency inched lower on Monday, after failing to develop any legs to extend Friday’s gains. As can be seen from the H4 timeframe, the 0.75 handle was brought into the picture and has so far held ground. Overall, we can see that the market remains in a clear downtrend and recently chalked up a lower high at 0.7560. A 1:1 completion to the downside (see red arrows), as denoted on the chart, terminates just north of H4 demand at 0.7422-0.7439. Therefore, beyond 0.75, there’s room to push lower it seems.
Weekly structure continues to reflect a strong bearish stance after wiping out weekly channel support taken from the low 0.6827. Further selling from this point has the weekly demand area at 0.7371-0.7442 to target. In conjunction with weekly price, daily flow is seen making a play at the underside of a daily supply zone drawn from 0.7589-0.7547. Continued selling from here has daily demand at 0.7371-0.7429 in sight that is positioned within the lower limit of the noted weekly demand area.
Potential trading zones:
Overall, this market is likely to continue pressing south, at least until we reach H4 demand mentioned above 0.7422-0.7439. As this area is glued to the top edge of the current daily demand and also positioned within the top limits of the noted weekly demand, traders should pencil in the possibility of buyers making an appearance from here.
In terms of possible setups, the team has noted to keep eyeballs on 0.75. A H4 close beneath this boundary, followed up with a retest in the form of a full or near-full-bodied H4 bearish candle would, in our view, be enough to validate a sell, targeting the aforesaid H4 demand.
In addition to the technicals, traders also need to be aware that the Aussie may experience volatility soon. Australian retail sales m/m and Chinese trade data – both potential market movers – are scheduled for release during early Asia.
Data points to consider today: Aus. retail sales m/m; Chinese trade balance; Aus. annual budget release; Fed Chair Powell to make an appearance during London trade, and President Trump due to speak later amid US trading.
USD/JPY:
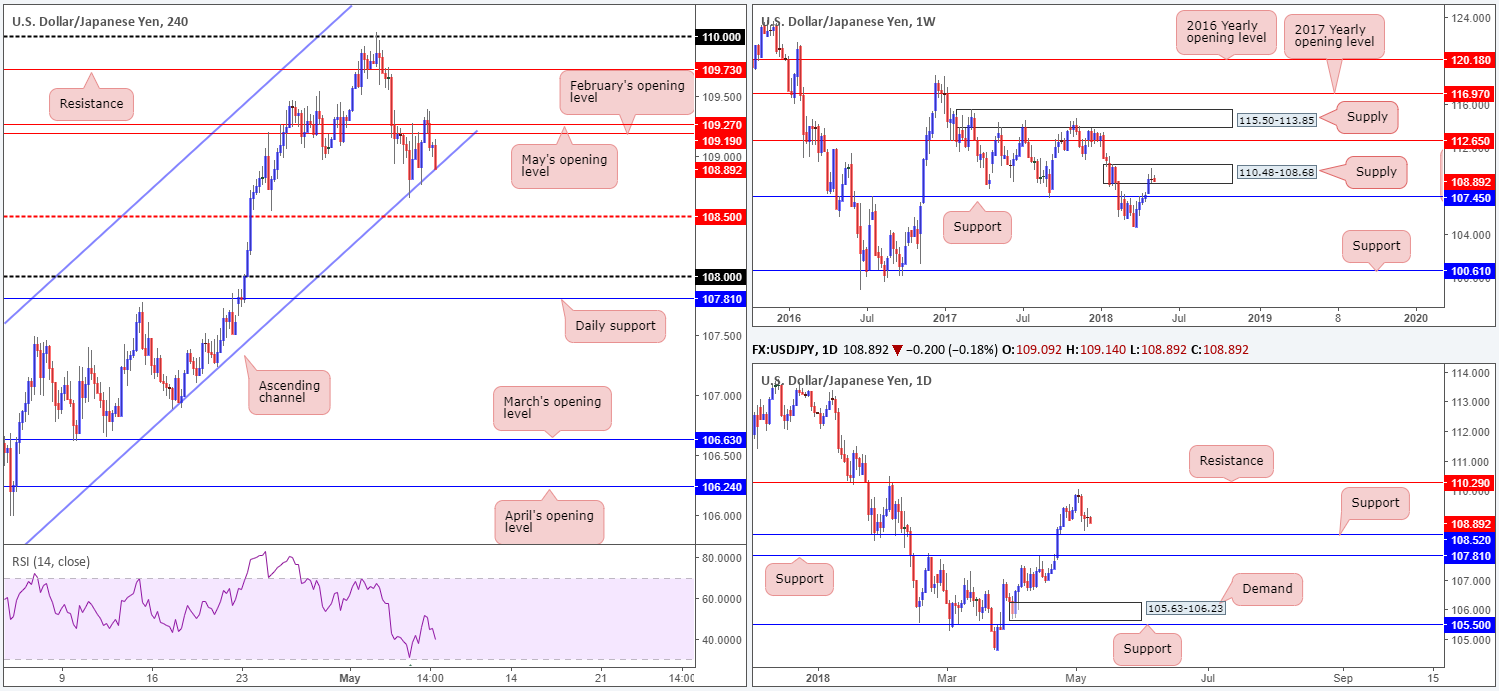
In recent dealings, the USD/JPY failed to sustain gains beyond February and March’s opening levels at 109.19/109.27, and have since pared gains observed amid London trade. To the downside, we can see that H4 price is currently testing a H4 ascending channel support extended from the low 104.62. A violation of this boundary has the H4 mid-level support at 108.50 in view.
In terms of higher-timeframe structure, daily price penciled in a clear-cut indecision candle on Monday as it lingers just north of daily support plotted at 108.52. Higher up on the curve, nevertheless, the weekly candles are seen trading within the walls of a weekly supply zone pictured at 110.48-108.68. As you can see, the pair concluded last week’s trading in the shape of a robust weekly selling wick, also known as a bearish pin-bar formation. Should this attract sellers into the market this week, traders will likely have their crosshairs pinned on weekly support drawn from 107.45.
Potential trading zones:
A break of the current H4 channel support is likely, in our assessment. Overhead pressure coming in from the higher timeframes may force the unit down to the H4 mid-level support 108.50, which, as you can probably see, aligns beautifully with daily support mentioned above at 108.52. Unfortunately, this does not leave much wiggle room to trade short. In fact, by the time H4 price closes below the H4 channel support, there will likely be less than 20 pips to play with. To that end, as of current price, neither a long nor short seems attractive at the moment.
Data points to consider today: Fed Chair Powell to make an appearance during London trade, and President Trump due to speak later amid US trading.
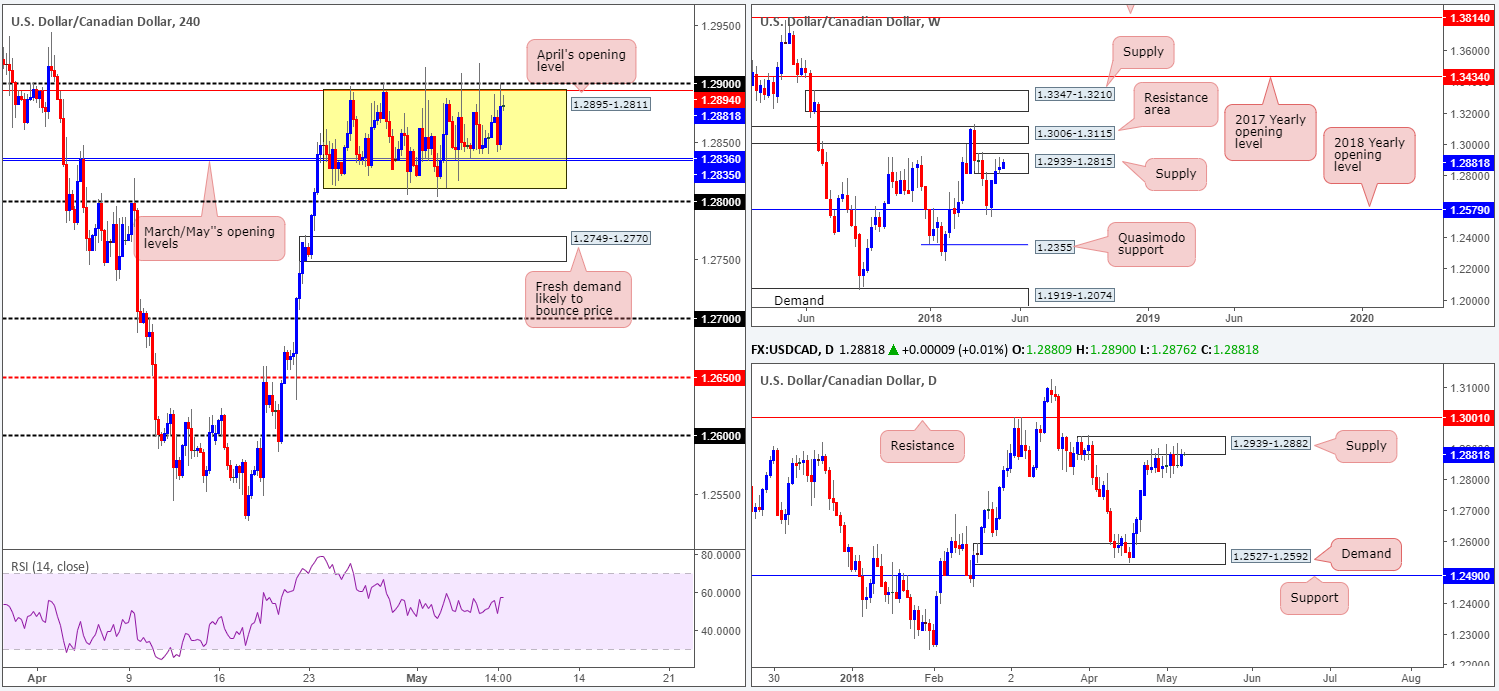
USD/CAD:
Despite WTI heading north in recent trade, tapping highs of $70.80, the USD/CAD continues to emphasize a somewhat directionless state. Since April 25 H4 price has remained fluctuating between 1.2895/1.2811 (within the area is March/May’s opening level seen at 1.2836). As highlighted in previous writings, the team is still biased to the downside in spite of the ranging structure we’re seeing at the moment. This is largely due to where price is positioned on the bigger picture.
Following a stronger-than-expected rebound off the 2018 yearly opening level seen on the weekly timeframe at 1.2579, the pair has recently been engaging with a weekly supply zone plotted at 1.2939-1.2815. In the event of a break higher here, nevertheless, buyers would immediately face potential selling pressure from a weekly resistance zone seen at 1.3006-1.3115. In conjunction with weekly flow, daily price crossed swords with a daily supply zone at 1.2939-1.2882 back on April 25 (supporting the top edge of the H4 range currently in play) and has remained stagnant since. There have been numerous daily selling wicks printed off this zone, but none have generated any follow-through action thus far. The next upside target beyond the current supply can be seen in the form of a daily resistance at 1.3001 (sited just beneath the noted weekly resistance zone), whereas a move lower has the daily demand at 1.2527-1.2592 (houses the 2018 yearly opening level within) to target.
Potential trading zones:
Should a H4 full or near-full-bodied bearish candle present itself around 1.29s today: the top edge of the current H4 range, selling could be an option. Take note, though, that although higher-timeframe action indicates lower prices, the unit could potentially stall around 1.2835 due to February and May’s opening levels.
Data points to consider today: Fed Chair Powell to make an appearance during London trade, and President Trump due to speak later amid US trading.
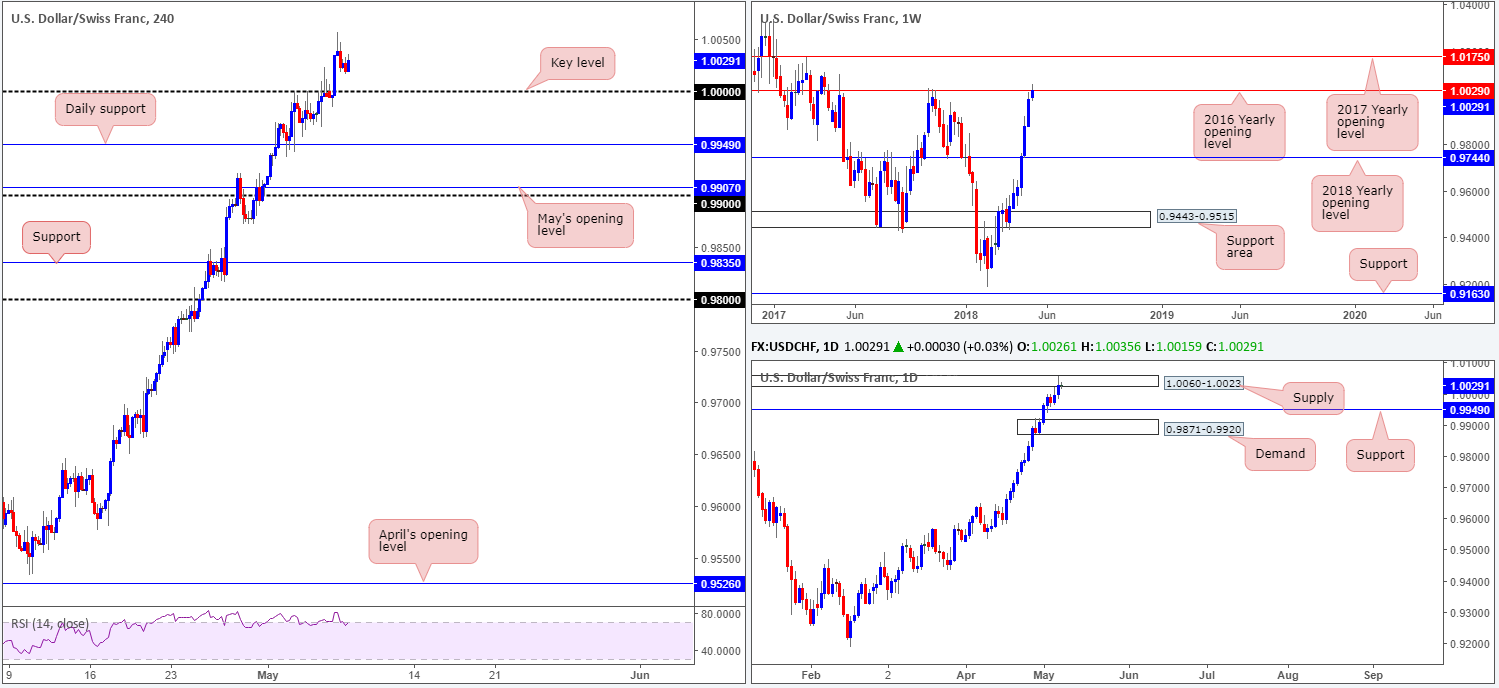
USD/CHF:
Aggressively breaking through parity (1.0000) on the H4 timeframe on Monday, the US dollar advanced against its Swiss counterpart and managed to record a high of 1.0056 before paring gains into US trade.
In light of recent movement, a large portion of traders are understandably looking to 1.0000 to hold as support for a possible retest play to the upside. While we agree that sentiment is strong, concern over where the market is positioned over in the bigger picture remains a weak point for prospective buyers.
Thanks to last week’s strong bout of buying, weekly price recently bumped heads with the 2016 yearly opening level seen at 1.0029. This is not a level one should overlook! Check out the clean rejection formed on October 2017 which dropped price in excess of 800 pips! Turning the focus over to the daily timeframe, we can clearly see daily supply carved from 1.0060-1.0023 is also in play (encapsulates current weekly level).
Potential trading zones:
1.0000 is likely to play a key role in trade today.
A retest of 1.0000 as support is appealing, despite higher-timeframe concern. Should one witness a H4 full or near-full-bodied bullish rotation drawn from here, then we believe longs could be a consideration.
If you’re somewhat nervous at the sight of the current higher-timeframe structure, nevertheless, waiting and seeing if 1.0000 can be taken out could be the way forward. A retest following the break is, according to the technical arrangement, a strong sell signal, targeting daily support as an initial take-profit zone at 0.9949.
Data points to consider today: Fed Chair Powell to make an appearance during London trade, and President Trump due to speak later amid US trading.
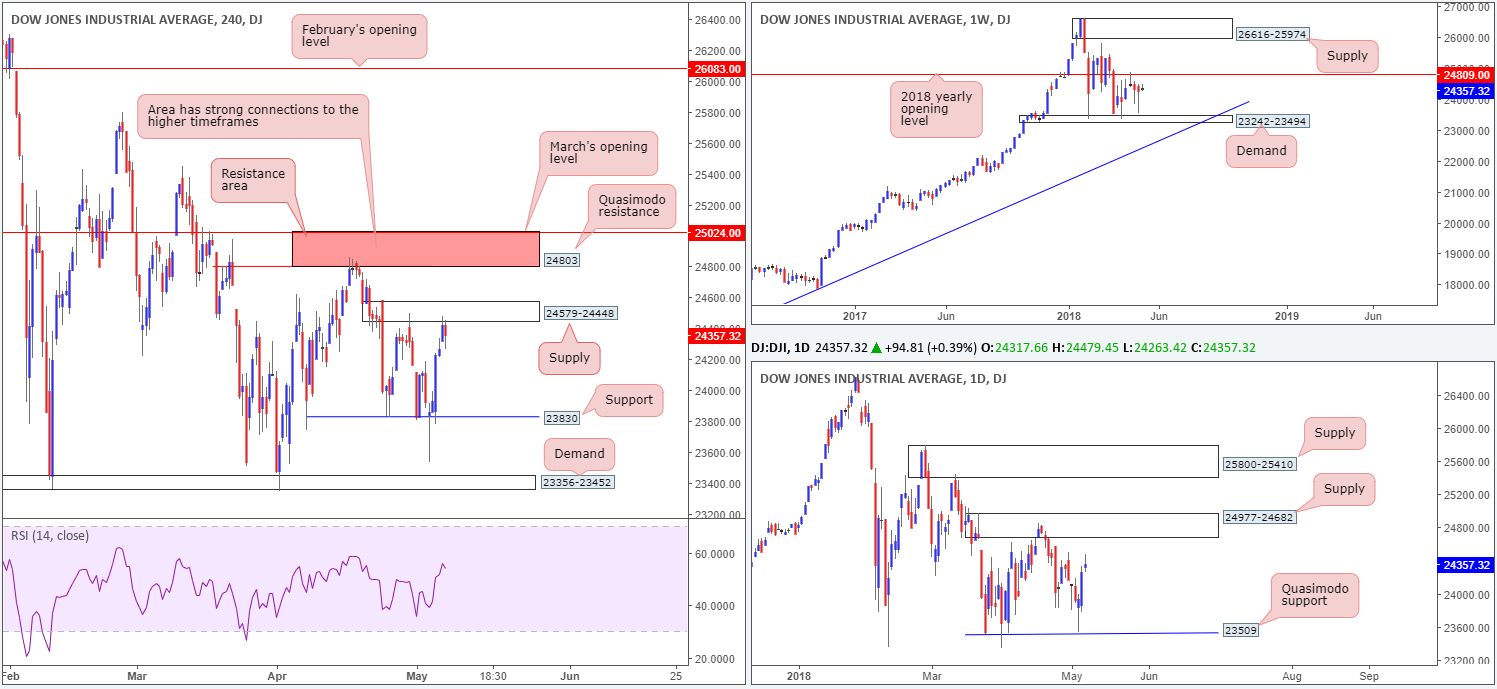
DOW 30:
The Dow Jones Industrial Average extended Friday’s strong push to the upside, kicking the week off on a positive note. Energy stocks supported early gains, which benefited from the ongoing surge in oil prices, currently trading above the $70 mark, as we write.
Yesterday’s advance, however, came to a halt after connecting with H4 supply marked at 24579-24448. This area, as visible on the chart, has already proven its worth (see April 30) and therefore could potentially send prices lower once more.
Despite this, the area we have our eye on right now is the H4 resistance zone marked in red from 25024/24803 (comprised of March’s opening level and a H4 Quasimodo resistance). The reason behind this comes down to its connections with daily supply noted at 24977-24682,and also due to the H4 zone housing the 2018 yearly opening level at 24809 seen on the weekly timeframe.
Potential trading zones:
Having seen the confluence surrounding the current H4 resistance area, shorting from the H4 supply below it at 24579-24448 might not be the best path to take.
As a result, traders may want to consider placing alerts for potential sell trades at the underside of the H4 resistance area. Stop-loss orders, technically speaking, would be best placed above 25024, clearing not only the top edge of daily supply but also the H4 resistance zone as well.
The initial take-profit target can be set around 23830ish: a local area we’ve seen support materialize in recent trading.
Data points to consider today: Fed Chair Powell to make an appearance during London trade, and President Trump due to speak later amid US trading.
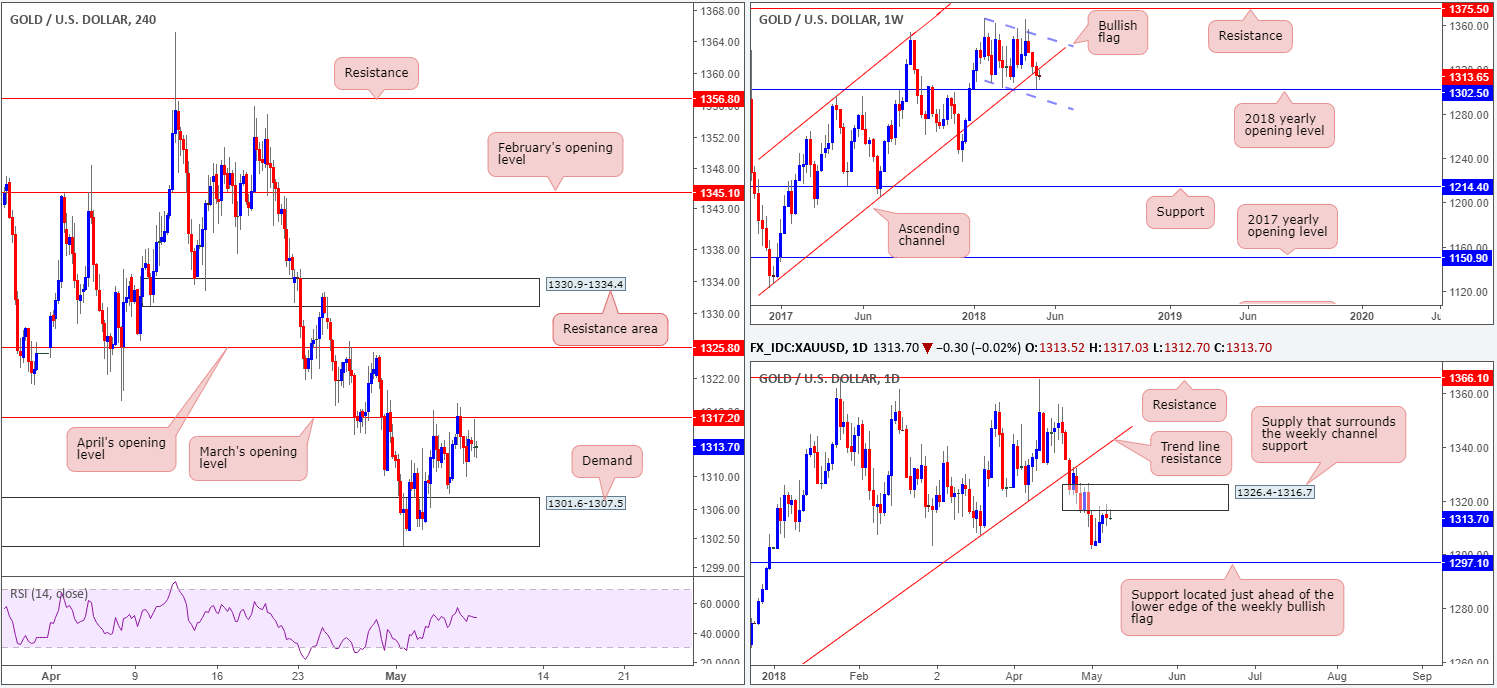
GOLD:
It was a reasonably quiet session for the yellow metal on Monday.
Here’s a quick rundown of the overall picture, as we see it:
- A violation of March’s opening band at 1317.2 on the H4 timeframe could lead to a move towards April’s opening level plotted at 1325.8, whereas a move lower from 1317.2 has nearby H4 demand in view at 1301.6-1307.5.
- A rejection off daily supply at 1326.4-1316.7 has daily support at 1297.1 to target, which happens to be located just ahead of the lower edge of the weekly bullish flag taken from the low 1307.2.
- Weekly action is currently sandwiched between the 2018 yearly opening level at 1302.5 and the weekly channel support-turned resistance taken from the low 1122.8.
Given that the current daily supply surrounds the weekly channel resistance, this is considered a significant area.
A push above March’s opening level (located within the lower limit of the current daily supply) is possible since April’s opening barrier (the next upside target on the H4 scale) is also positioned within the noted daily supply, only around the upper limit of the area.
Potential trading zones:
Selling from the aforementioned daily supply seems the more logical route at the moment, in view of its connection to weekly structure. However, H4 players may struggle to short here – the H4 demand mentioned above at 1301.6-1307.5 leaves little room for the sellers to stretch their legs! Given this, the team has noted to look for H4 price to break higher and test April’s opening level for possible shorting opportunities. That way, H4 price should have room to work and bring prices lower.
Stop-loss orders are best positioned above the daily supply (1326.4). Conservative traders, on the other hand, may want to consider waiting for a H4 bearish rotation candle (preferably a full-bodied formation) to form before pulling the trigger.
This site has been designed for informational and educational purposes only and does not constitute an offer to sell nor a solicitation of an offer to buy any products which may be referenced upon the site. The services and information provided through this site are for personal, non-commercial, educational use and display. IC Markets does not provide personal trading advice through this site and does not represent that the products or services discussed are suitable for any trader. Traders are advised not to rely on any information contained in the site in the process of making a fully informed decision.
This site may include market analysis. All ideas, opinions, and/or forecasts, expressed or implied herein, information, charts or examples contained in the lessons, are for informational and educational purposes only and should not be construed as a recommendation to invest, trade, and/or speculate in the markets. Any trades, and/or speculations made in light of the ideas, opinions, and/or forecasts, expressed or implied herein, are committed at your own risk, financial or otherwise.
The use of the site is agreement that the site is for informational and educational purposes only and does not constitute advice in any form in the furtherance of any trade or trading decisions.
The accuracy, completeness and timeliness of the information contained on this site cannot be guaranteed. IC Markets does not warranty, guarantee or make any representations, or assume any liability with regard to financial results based on the use of the information in the site.
News, views, opinions, recommendations and other information obtained from sources outside of www.icmarkets.com.au, used in this site are believed to be reliable, but we cannot guarantee their accuracy or completeness. All such information is subject to change at any time without notice. IC Markets assumes no responsibility for the content of any linked site. The fact that such links may exist does not indicate approval or endorsement of any material contained on any linked site.
IC Markets is not liable for any harm caused by the transmission, through accessing the services or information on this site, of a computer virus, or other computer code or programming device that might be used to access, delete, damage, disable, disrupt or otherwise impede in any manner, the operation of the site or of any user’s software, hardware, data or property.


