
A note on lower timeframe confirming price action…
Waiting for lower timeframe confirmation is our main tool to confirm strength within higher timeframe zones, and has really been the key to our trading success. It takes a little time to understand the subtle nuances, however, as each trade is never the same, but once you master the rhythm so to speak, you will be saved from countless unnecessary losing trades. The following is a list of what we look for:
- A break/retest of supply or demand dependent on which way you’re trading.
- A trendline break/retest.
- Buying/selling tails/wicks – essentially we look for a cluster of very obvious spikes off of lower timeframe support and resistance levels within the higher timeframe zone.
- Candlestick patterns. We tend to stick with pin bars and engulfing bars as these have proven to be the most effective.
We typically search for lower-timeframe confirmation between the M15 and H1 timeframes, since most of our higher-timeframe areas begin with the H4. Stops are usually placed 3-5 pips beyond confirming structures.
EUR/USD:
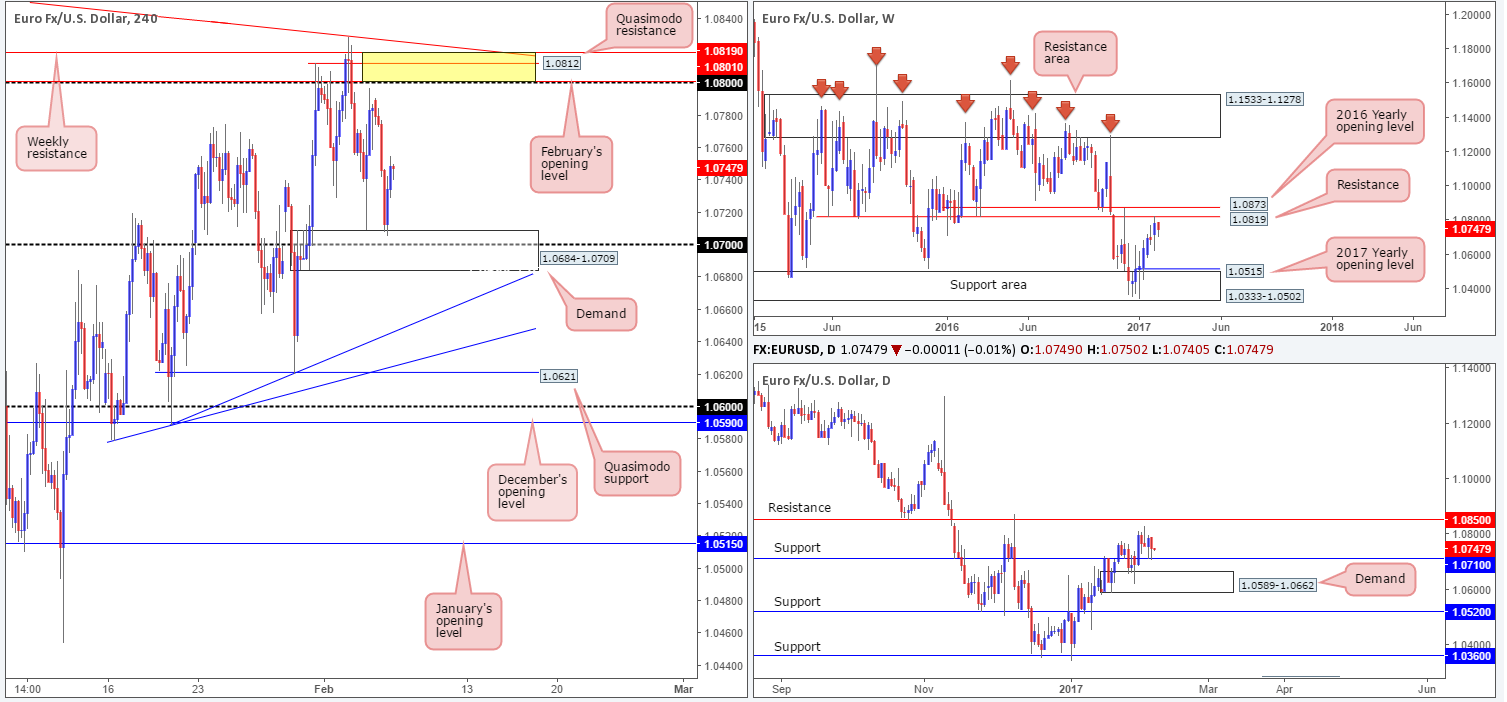
The sellers managed to find their feet early on in the day yesterday, consequently surrendering all of Friday’s gains. It was only once price struck the top edge of a H4 demand base coming in at 1.0684-1.0709 (houses the 1.07 handle) going into the US segment did we see the tables begin to turn. It may be worth noting here that this H4 demand area is reinforced by a daily support level drawn from 1.0710 that stretches as far back as March 2015.
While the buyers may be growing confidence, one thing to keep in mind here is that weekly action recently shook hands with a weekly resistance level seen at 1.0819. With that being the case, here is our two cents’ worth on the direction this market may head today/tomorrow:
- Ideally, what we’d like to see happen is the bulls continue bidding prices higher, and form a H4 AB=CD approach in the direction of 1.08. 1.08, coupled with February’s opening level at 1.0801, a H4 Quasimodo resistance at 1.0812, a H4 trendline resistance extended from the high 1.0873 and also the weekly resistance mentioned above at 1.0819 is a stable enough zone to consider shorts from (yellow area). Still, there is a possibility that price may possibly fake through this H4 sell area to tap the daily resistance at 1.0850 and maybe even the 2016 yearly opening level at 1.0873 (sits above the current weekly resistance). To that end, opting to wait for a reasonably sized H4 bearish candle to take shape here before placing an order is, in our view, the better/safer route to take.
- A second scenario, given the position of price on the weekly timeframe, is a breakdown through the current H4 demand zone. This would likely open up the trail south to a H4 trendline support taken from the low 1.0589, which is planted within daily demand seen at 1.0589-1.0662.
Our suggestions: Unless price comes into contact with the 1.08 band today, or breaks below the current H4 demand and retests the area as a resistance, we’ll likely remain flat during today’s sessions.
Data points to consider: There are no scheduled high-impacting news events on the docket today relating to these two markets.
Levels to watch/live orders:
- Buys: Flat (stop loss: N/A).
- Sells: 1.0819/1.08 ([wait for a reasonably sized H4 bear candle to form before looking to execute a trade] stop loss: ideally beyond the trigger candle). Watch for H4 price to engulf the H4 demand at 1.0684-1.0709 and retest the area as resistance.
GBP/USD:
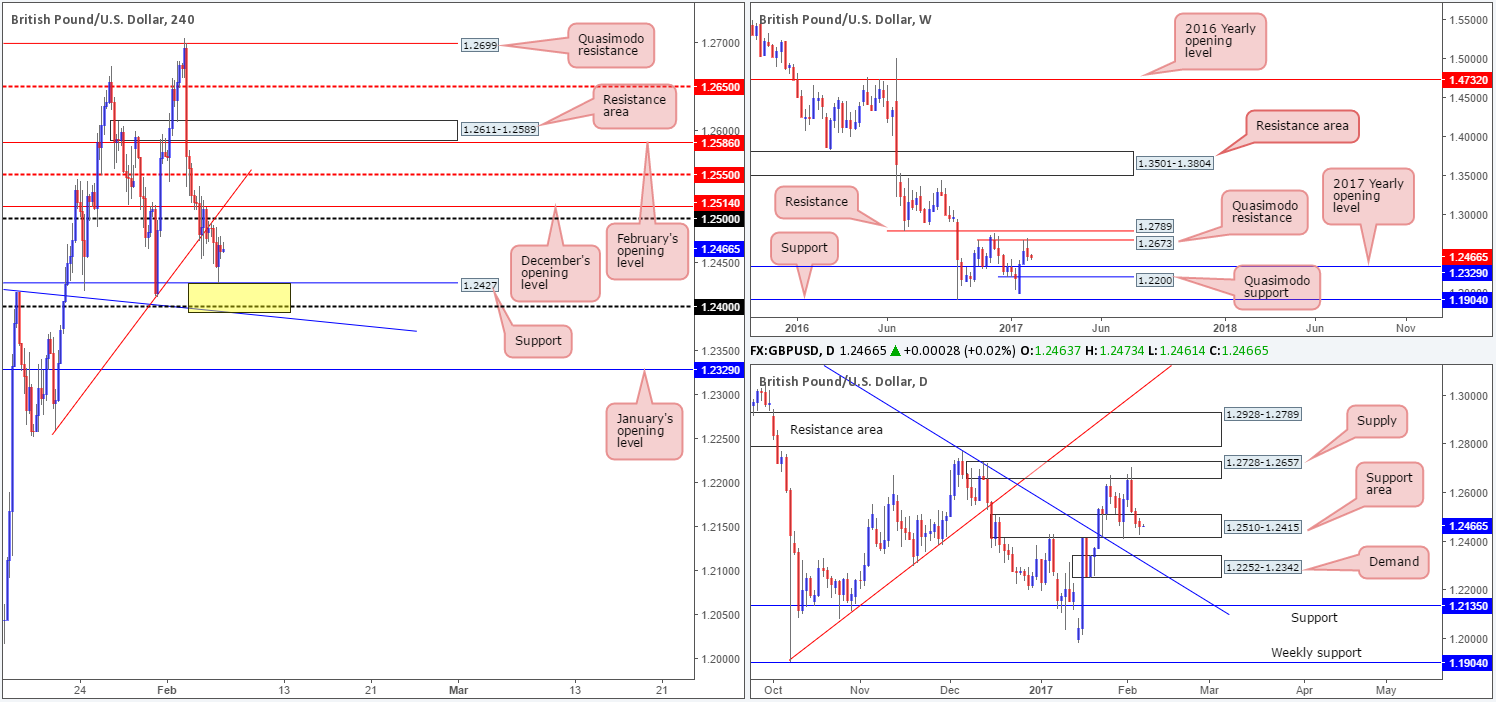
For those who read Monday’s report you may recall that our desk highlighted the possibility of a bullish reaction being seen from the 1.2390/1.2427 H4 zone marked in yellow. Comprised of a H4 support at 1.2427, a psychological level at 1.24 and a H4 trendline support drawn from the high 1.2432, the pair, as demonstrated on the H4 chart, did manage to catch a bid from the top edge of this barrier as the US opened their doors for business. While the bounce has rallied around 50 pips already, there’s a chance that price will likely tap the 1.25 number today, followed closely by December’s opening level at 1.2514. Our reasoning behind this simply comes down to the fact that although the GBP has declined for three consecutive days now, it is situated within the walls of a daily support area chalked in at 1.2510-1.2415. On the other side of the coin though, let’s also take into consideration that weekly price is selling off from a weekly Quasimodo resistance level at 1.2673, which happens to show room for further selling to the 2017 yearly opening level at 1.2329.
Our suggestions: As of current prices, neither a long nor short seems attractive at this time. A short from the 1.25 region, while it would place you in-line with weekly flow, it simultaneously positions you against potential daily buyers! The same goes for a buy from the above noted H4 yellow buy zone. Buying from here places you alongside daily buying, but at the same time against weekly selling. What makes this area slightly more risky, in our opinion, is also the fact that it has already been tested once, thus it could potentially be much weaker now.
Data points to consider: There are no scheduled high-impacting news events on the docket today relating to these two markets.
Levels to watch/live orders:
- Buys: Flat (stop loss: N/A).
- Sells: Flat (stop loss: N/A).
AUD/USD:
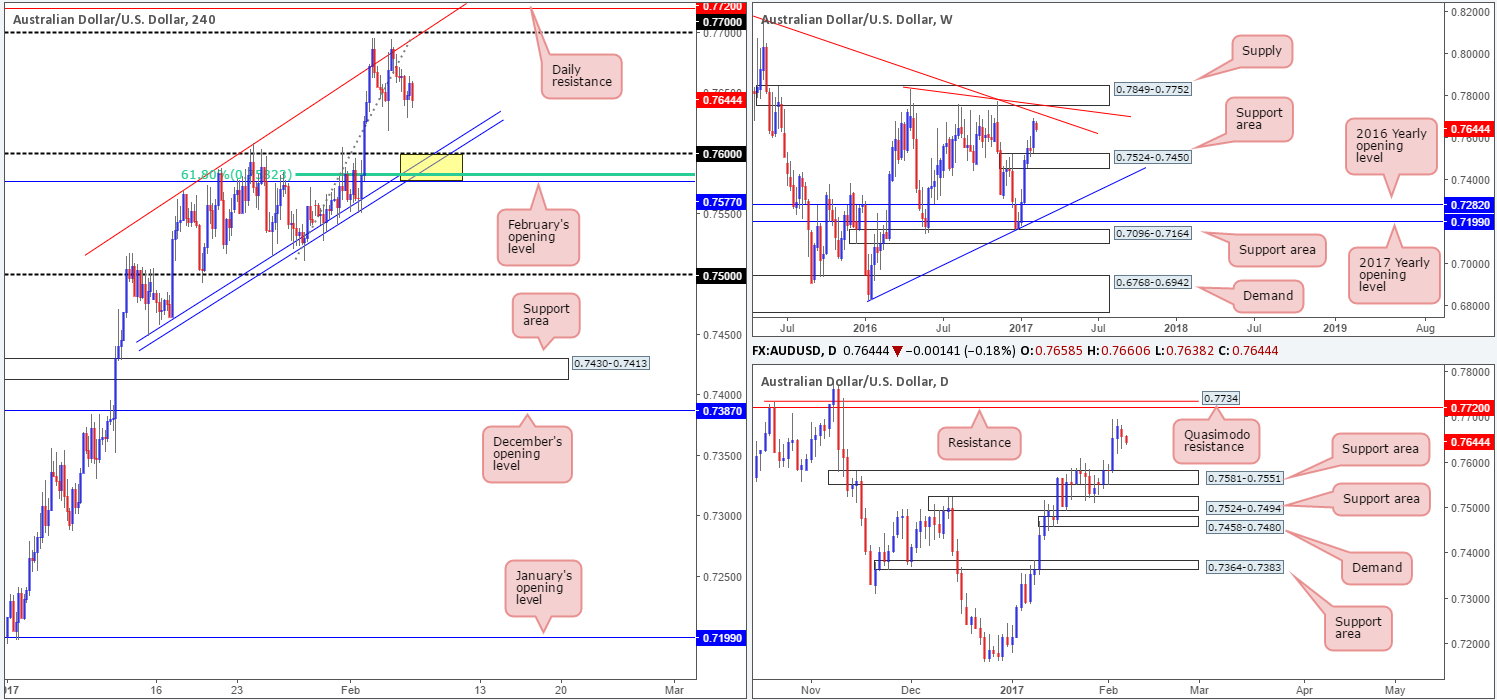
Weighed on heavily by disappointing Australian retail sales data yesterday, the commodity-driven currency tapered off from the H4 channel resistance band drawn from the high 0.7569. Evident from the H4 chart, Monday’s downside move erased all of Friday’s gains, and currently looks to be on course to attack the other side of the H4 channel taken from the low 0.7449.
Building a case for a potential buy trade here we have the following converging structures forming a buy zone (marked in yellow) around 0.7557/0.76: a round number at 0.76, a H4 61.8% Fib at 0.7582 and February’s opening level at 0.7577. On top of this, we also have the top edge of a daily support area at 0.7581 bolstering the above noted H4 buy zone. This area will remain valid as long as price does NOT connect with the 0.77/0.7720 (daily resistance) beforehand.
Our suggestions: Dependent on how the Reserve Bank of Australia conducts itself today, although there is no change expected at this meeting, our desk favors the 0.7557/0.76 region for buys today. Given the confluence surrounding this H4 area, one may consider entering here without waiting for additional confirmation. To give the trade room to breathe, however, we’d look to place stops around the 0.7570 mark. As for take-profit targets, we typically look to take some off the table at the closest H4 supply (in this case) formed on approach.
Data points to consider: The RBA will announce its benchmark interest rate today at 3.30am.
Levels to watch/live orders:
- Buys: 0.7557/0.76 ([an area that can, dependent on the time of day, be traded without additional confirmation] stop loss: 0.7570).
- Sells: Flat (stop loss: N/A).
USD/JPY:
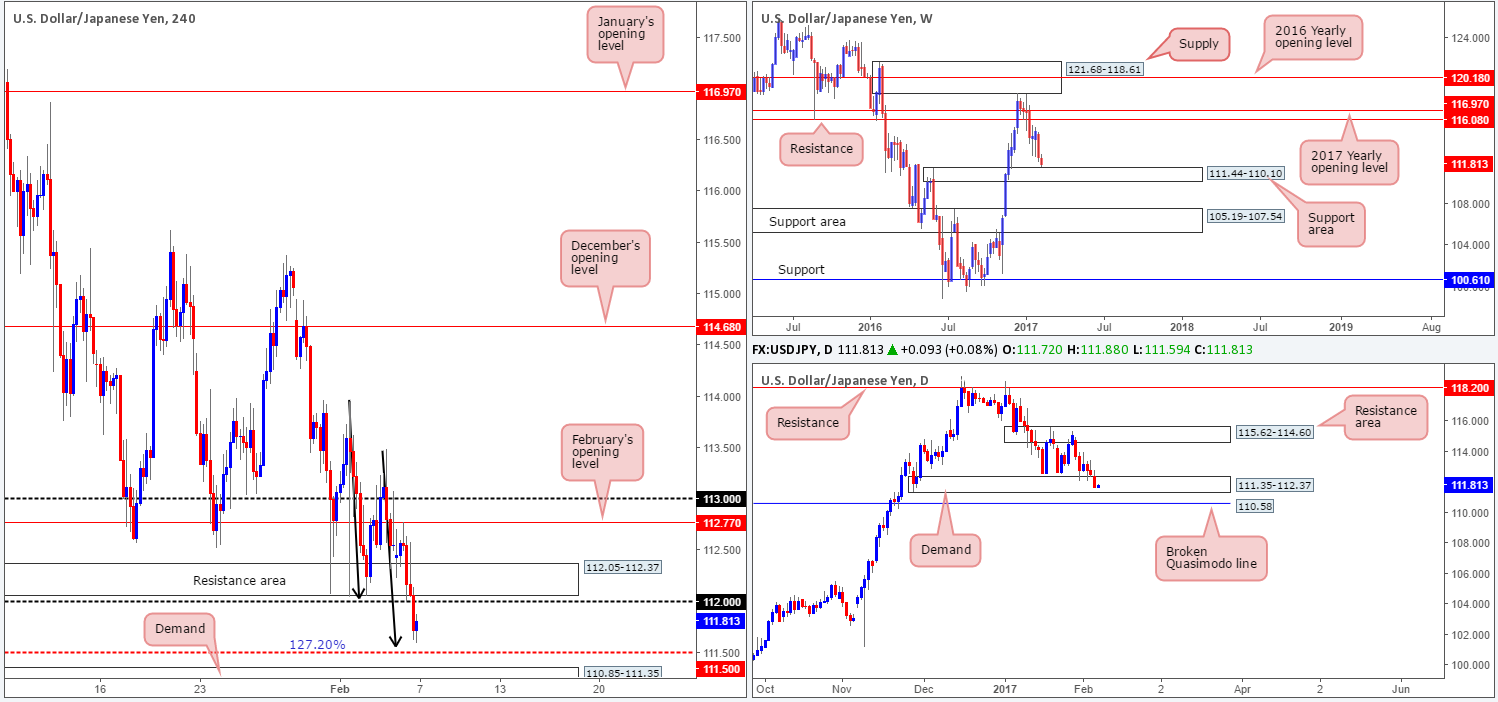
Kicking this morning’s report off with a quick look at the weekly chart, we can see that the current weekly candle is trading within touching distance of a weekly support area coming in at 111.44-110.10. Looking down to the daily chart, however, price is already seen trading within the walls of a daily demand area seen at 111.35-112.37. In the event that price does connect with the top edge of the weekly support area, there’s a chance that price could fakeout below the current daily demand to test the nearby daily broken Quasimodo line at 110.58.
Stepping across to the H4 chart, this is where we find things get interesting! The H4 candles are currently in the process of completing the D-leg of a H4 AB=CD bull pattern that terminates just ahead of the H4 mid-way point 111.50. This – coupled with the H4 demand seen just below it at 110.85-111.35 is, in our opinion, a high-probability reversal zone, since let’s not forget that 111.50 also denotes the top edge of a weekly support area and is situated deep within the current daily demand.
Our suggestions: To avoid the possibility of a fakeout through 111.50, nevertheless, we have placed a pending buy order at 111.36 (just ahead of the current H4 demand zone), with a stop-loss order set below at 110.83. Should this order trigger today, our first take-profit target will be the 112 neighborhood.
Data points to consider: There are no scheduled high-impacting news events on the docket today relating to these two markets.
Levels to watch/live orders:
- Buys: 111.36 ([pending order] stop loss: 110.83).
- Sells: Flat (stop loss: N/A).
USD/CAD:
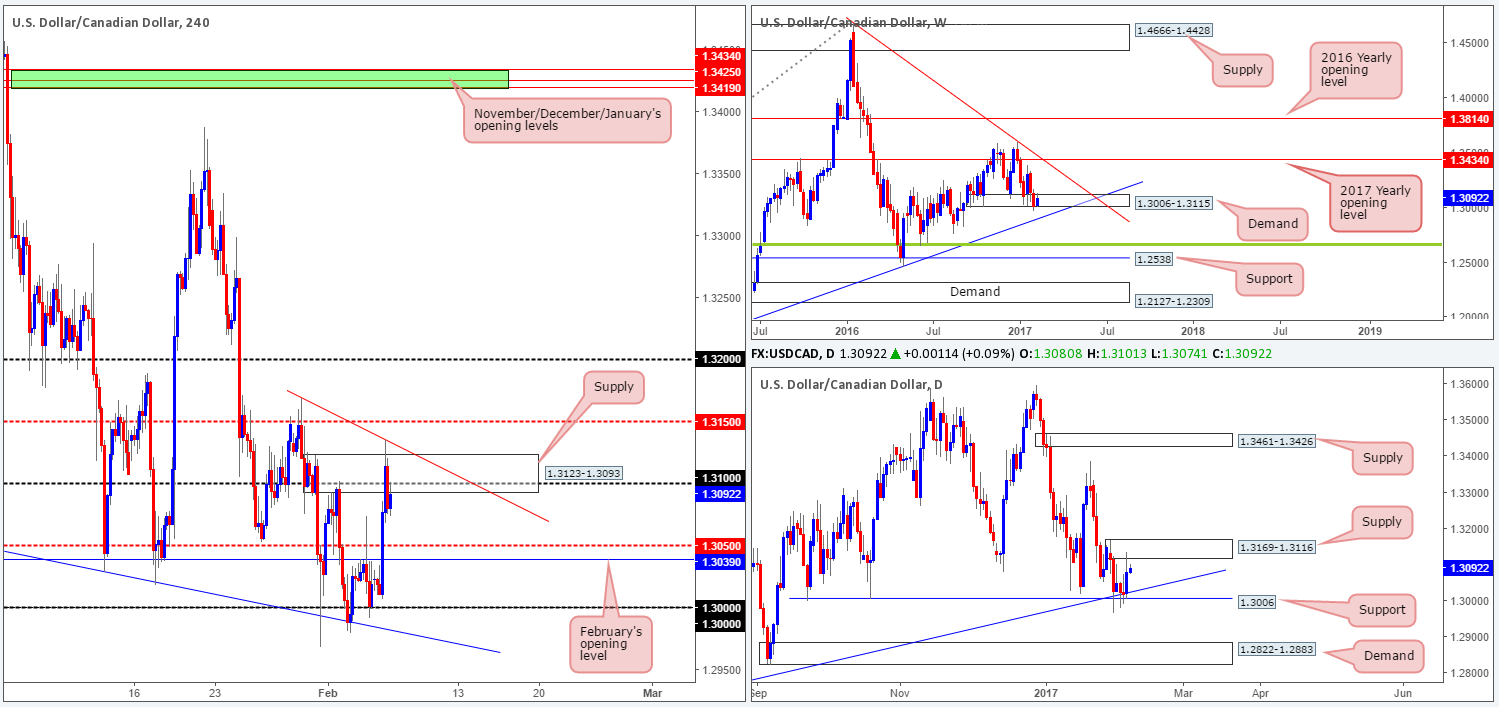
Bolstered by an overall stronger dollar, the USD/CAD exploded to the upside during the course of yesterday’s London morning segment. As you can see from the H4 chart, the pair ended the day aggressively whipsawing through a H4 supply area at 1.3123-1.3093 and closed out just below the 1.31 boundary. What this recent up move also accomplished was bringing the daily supply zone at 1.3169-1.3116 into the picture, which happens to support the above noted H4 supply zone.
Ultimately, for our team to become buyers in this market, the H4 mid-way resistance level at 1.3150 will need to be consumed. This would not only likely confirm bullish strength from the current weekly demand area at 1.3006-1.3115, but also open the doors up to 1.32 and possibly beyond. In regards to selling this pair today, there’s room seen on the H4 chart for the candles to stretch down to the H4 mid-way support at 1.3050, followed closely by February’s opening base at 1.3039.
Our suggestions: To our way of seeing things, an intraday short could be possible today from the 1.31 region. However, we would advise waiting for a lower-timeframe sell signal to form before pulling the trigger, as selling against potential weekly buyers (see above) can be a very risky play indeed! Apart from this, as mentioned above, a H4 close above 1.3150 would need to take shape before we look to buy into this market.
Data points to consider: Canadian trade balance report scheduled for release at 1.30pm.
Levels to watch/live orders:
- Buys: Flat (stop loss: N/A).
- Sells: 1.31 region ([waiting for a lower-timeframe signal to form is advised prior to pulling the trigger] stop loss: dependent on where one confirms this area).
USD/CHF:
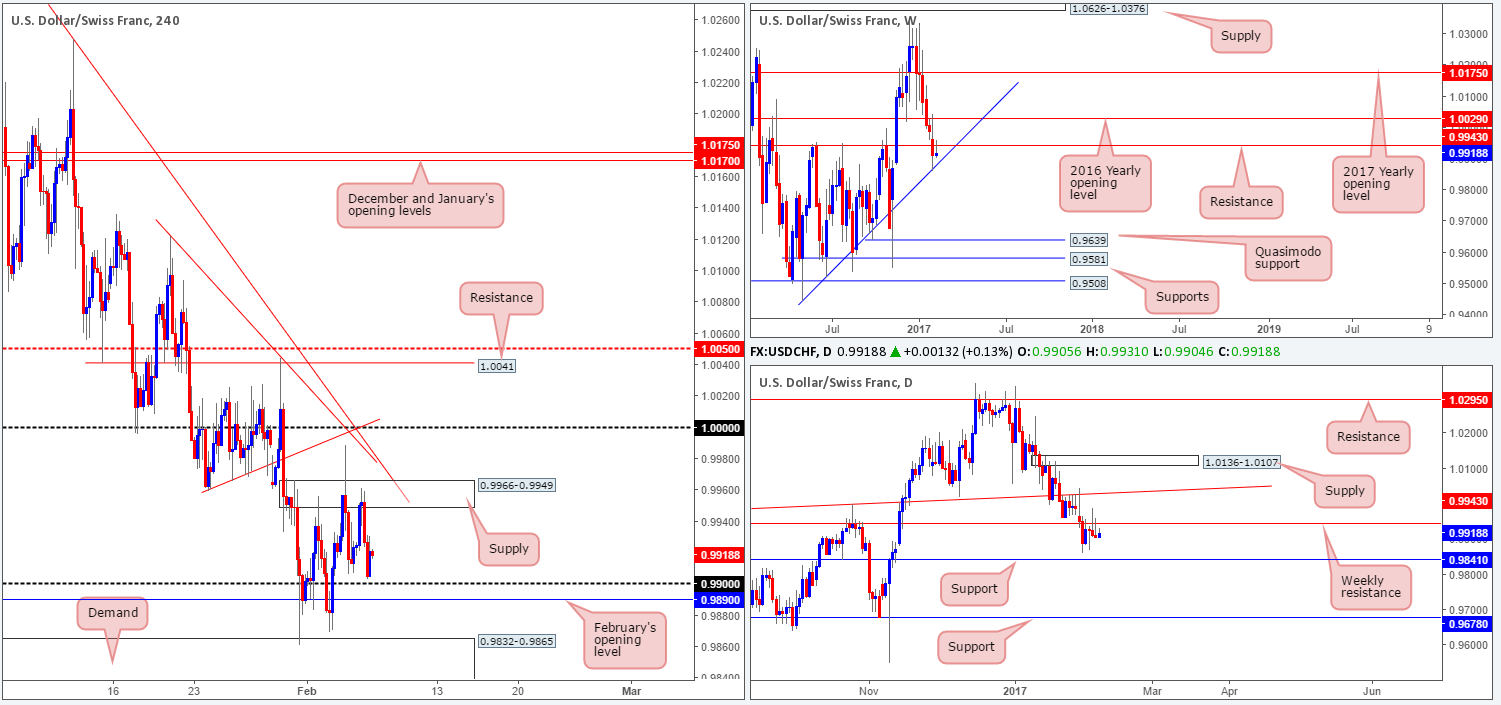
Beginning with the weekly timeframe this morning, the Swissy probed the underside of a weekly resistance yesterday at 0.9943, following last week’s correction off the weekly trendline support etched from the low 0.9443. Turning our attention to the daily timeframe, we now have two back-to-back daily selling wicks printed at the underside of the aforementioned weekly resistance. This, alongside room seen for the pair to drop down as far as daily support at 0.9841 could very well spark further selling in the days ahead.
While selling the daily bearish candles is tempting, the H4 timeframe seems to be throwing up a red flag! By selling this market, the H4 bears would have to contend with the possibility that the 0.99 handle along with February’s opening level at 0.9899 could put the brakes on any downside moves today! Additionally, even with a break below these H4 barriers, H4 demand at 0.9832-0.9865 is seen just below, which happens to merge with the daily support level discussed above at 0.9841.
Our suggestions: In the absence of clear price action, the desk has come to a consensus that remaining flat could very well be the safer route to take.
Data points to consider: There are no scheduled high-impacting news events on the docket today relating to these two markets.
Levels to watch/live orders:
- Buys: Flat (stop loss: N/A).
- Sells: Flat (stop loss: N/A).
DOW 30:
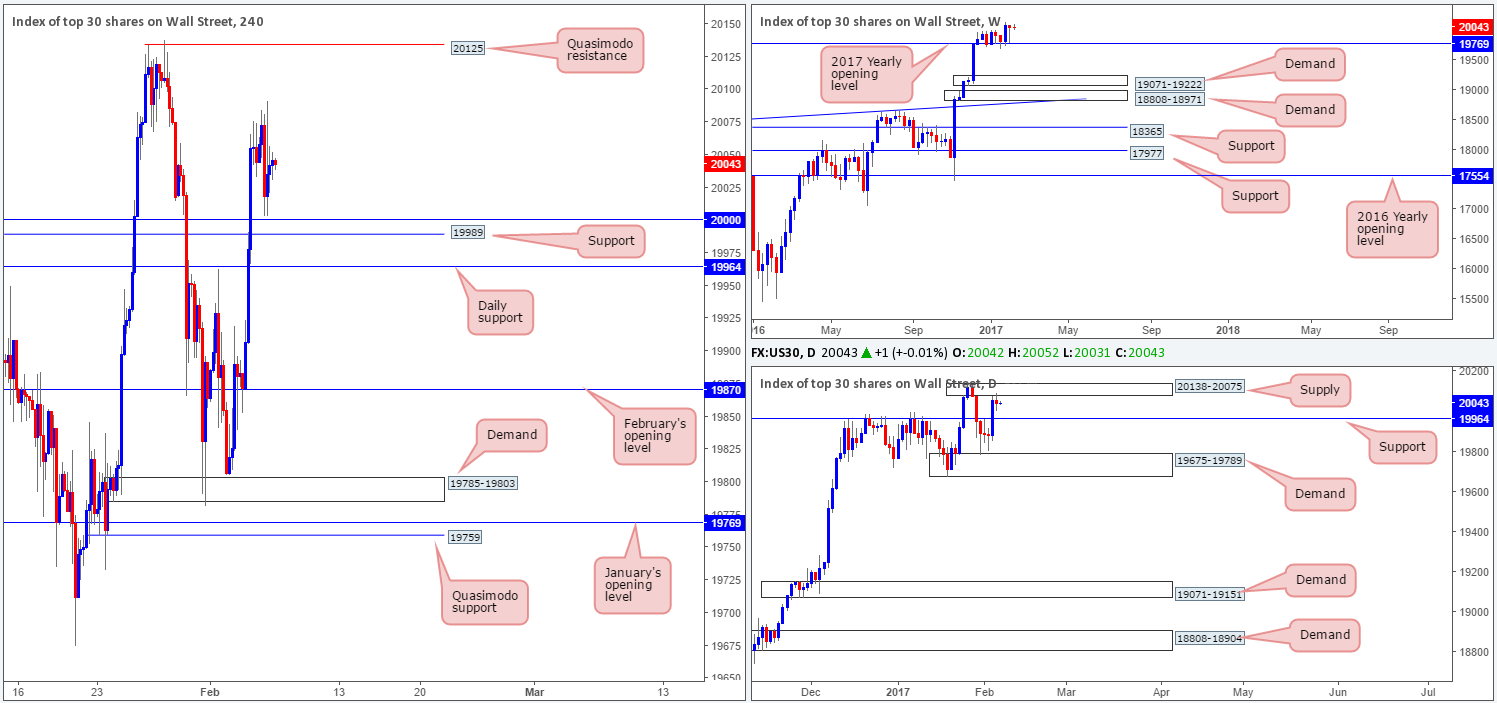
US equities fell sharply going into yesterday’s London lunchtime, but, as you can see, managed to recover relatively quickly after bottoming just ahead of the 20000 mark amid the US open. Despite this, we can see that equity prices are little changed this morning. On the H4 chart, the next upside target, apart from Monday’s high point at 20091, is a H4 Quasimodo resistance level fixed at 20125. To the downside, we not only have the 20000 neighborhood representing potential support, there’s also a nearby H4 support at 19989, followed closely by daily support penciled in at 19964.
The other key thing to note in this market is that although the DOW closed marginally in the red last week, the unit chalked in a nice-looking weekly bullish tail that missed clipping the 2017 yearly opening level at 19769 by only a few points. In view of this, there are absolutely no weekly resistance levels in this market right now. Therefore, the best we can do for the time being is continue looking to ‘buy the dips’.
Our suggestions: Regardless of the weekly chart (see above), however, the buyers will need to overcome daily supply at 20138-20075 before buying this market medium term is made possible. With this in mind, we unfortunately do not see anything with ‘trade me’ written on it at the moment. Therefore, we’ll remain on the sidelines and wait for further developments.
Data points to consider: There are no scheduled high-impacting news events on the docket today that will likely affect the US equity market.
Levels to watch/live orders:
- Buys: Flat (stop loss: N/A).
- Sells: Flat (stop loss: N/A).
GOLD:
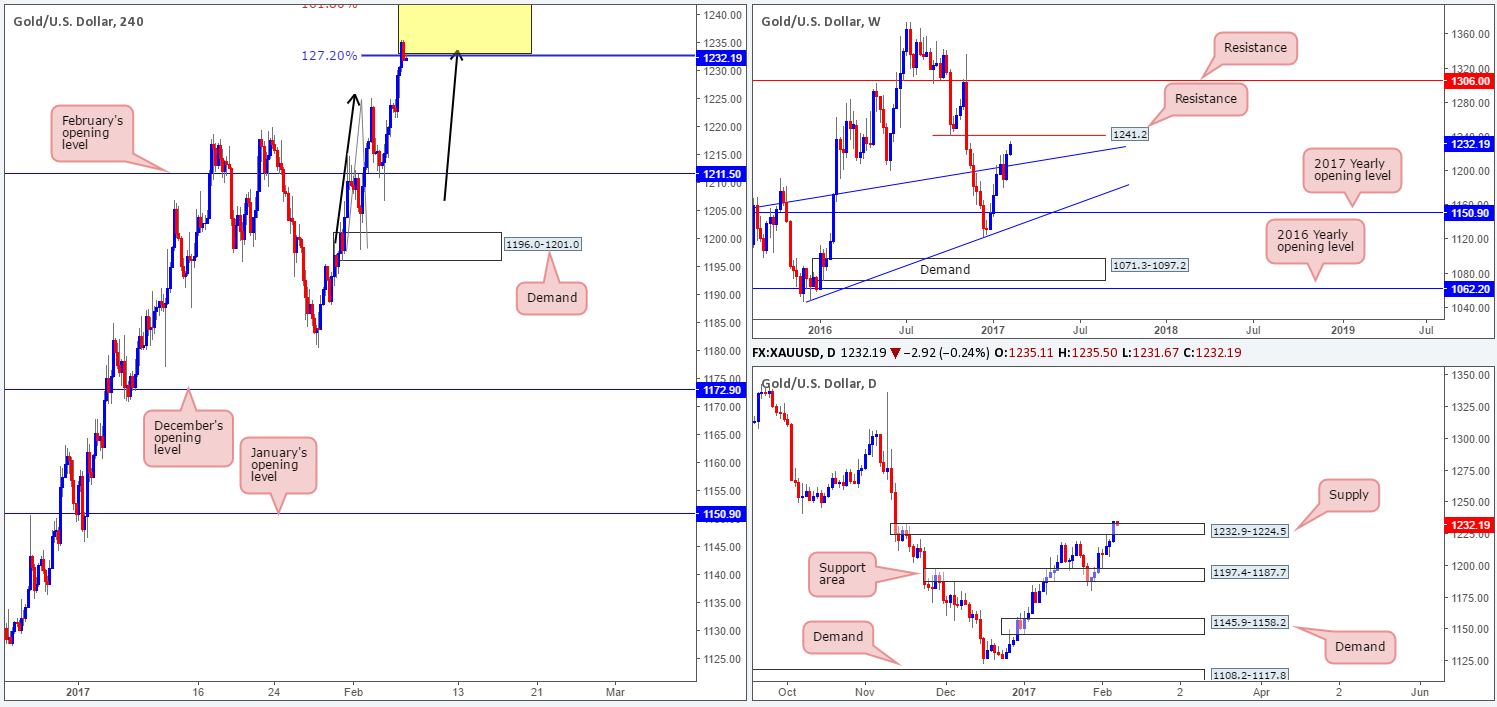
As you can see from the charts this morning, the gold market continued to accelerate to the upside yesterday. This was likely helped by the US dollar index topping out just ahead of a H4 resistance at 100.26.
At the time of writing, we believe the yellow metal to be currently underlining overbought conditions. To put it differently, the H4 candles are presently trading within a H4 AB=CD (see black arrows) sell zone comprised of both the 127.2%/161.8% Fib extensions (yellow area – 1232.9/1241.7). Supporting a downside move from this area is also the fact that the top edge is strengthened by a weekly resistance level pegged at 1241.2. With that being the case, there may be trouble ahead for traders who bought into the breakout above daily supply at 1232.9-1224.5!
Our suggestions: For us personally, we have chosen to wait and see if bullion can stretch a little higher into the above noted H4 sell zone, before looking to short. Ideally, the closer the better to the weekly resistance at 1241.2! In addition to this, our trigger to sell will be on the basis that a reasonably sized H4 bear candle forms. Granted, this will by no means guarantee a winning trade, but what it will do is show seller intent within a high-probability reversal zone.
Levels to watch/live orders:
- Buys: Flat (stop loss: N/A).
- Sells: 1241.7/1232.9 ([wait for a H4 bear candle to form within the upper limit of this zone before looking to execute a trade] stop loss: ideally beyond the trigger candle).


